1461
Spinal cord fMRI heatmaps reveal a structured cardiac artifact “traveling” along the length of the cord
Kimberly J. Hemmerling1,2, Mark A. Hoggarth2, Todd Parrish3, and Molly G. Bright1,2
1Biomedical Engineering, Northwestern University, Evanston, IL, United States, 2Physical Therapy & Human Movement Sciences, Northwestern University, Chicago, IL, United States, 3Department of Radiology, Northwestern University, Chicago, IL, United States
1Biomedical Engineering, Northwestern University, Evanston, IL, United States, 2Physical Therapy & Human Movement Sciences, Northwestern University, Chicago, IL, United States, 3Department of Radiology, Northwestern University, Chicago, IL, United States
Synopsis
Denoising of spinal cord fMRI data is important to address physiological noise confounds. Heatmaps used to visualize structured variance in spinal cord fMRI data reveal a unique artifact of aliased cardiac signals from pulsatile flow adjacent to the cord, which appears to travel along the longitudinal cord axis. Cardiac-related RETROICOR noise maps indicate that this artifact is successfully modeled and removed. The artifact velocity along the length of the spinal cord was calculated and is moderately correlated to the heart rate. This artifact may also provide insight into CSF flow in the spinal canal.
Introduction
The spinal cord is in close proximity to several sources of physiological noise that influence the fMRI signal. Cardiac driven cerebrospinal fluid (CSF) pulsations through the spinal subarachnoid space surrounding the cord may impact measurement of the BOLD fMRI signal in both white and gray matter voxels1,2. Additionally, the lungs cause B0 inhomogeneity, and respiratory cycle dependent distortions1,3. One method that has been shown to effectively denoise respiratory and cardiac confounds from spinal cord fMRI is RETROICOR4–6.2D heatmaps are used to visualize structured patterns of signal variance in spinal cord fMRI, enabling qualitative assessment of denoising7. In select datasets, this visualization revealed a sloped artifact, indicating signals traveling along the length of the cord (Fig. 1). The presence of this artifact in the outermost white matter (WM) voxels indicates that the artifact may be a result of CSF pulsations immediately adjacent to the spinal cord. Additionally, this artifact was effectively removed with RETROICOR, indicating its physiological origin (Fig. 2). If this type of artifact is not modeled correctly, it may confound our signal of interest. This artifact may also reflect interesting physiology of the spinal cord, perhaps giving new insight into pulse wave velocity in the spinal canal. Therefore, our goal is to characterize this artifact to better understand its utility and how to effectively model and remove it.
Methods
Spinal cord fMRI data were collected from 12 healthy participants (25.8±5.6y, 8F, 4M) on a 3T Siemens Prisma scanner. Data were acquired at the cervical spine with GRE-EPI and ZOOMit selective excitation (TE/TR=30/2000ms, 1x1x3mm3, 25 slices, FA=90°, FOV=128x44mm2, 300 volumes) with interleaved, ascending slices. Hand-grip task (alternating left/right, targeting 25% MVC for 15 trials) fMRI scans were collected in two sessions. Physiological data (pulse, respiration, and expired gases) were acquired during scanning.Functional data were motion corrected8 and registered to the PAM50 template space9. Spinal cord fMRI heatmaps were created on motion corrected data to visually identify the artifact (Fig. 1). RETROICOR4 was applied using 8 cardiac and 8 respiratory terms, for which cardiac fitted noise maps of the outermost WM were created to isolate the artifact (Fig. 3A). Implementing a portion of the slope detection algorithm developed by Fitzgerald et al.10, the data were smoothed to reduce noise and the temporal derivative was taken (Fig. 3B). These data were thresholded at 0.015 to obtain a derivative map with distinct peaks (Fig. 3C). Data above this threshold were plotted and the points were manually grouped (Fig. 3D). Points that were not distinctly arranged in groups were not included in the analysis. The least squares regression line was calculated for each group (Fig. 3E-F).
In this heatmap organization, the outermost WM voxels (where the artifact is most visible) are organized from the most superior to the most inferior slice. The velocity at which the artifact “travels” up the cord was calculated for the three datasets in which the artifact was qualitatively visible and distinct groups of points could be identified. The boundary points at the ends of each regression line were identified, and the velocity was calculated as follows,$$\frac{(Slice_A-Slice_B)\times SliceThickness}{(TR_A-TR_B)\times TR}.$$Heart rate (HR) was calculated from the pulse recording and compared to the artifact velocity.
Results
The sloped artifact is distinctly visible in three datasets (Fig. 1). Cardiac noise maps illustrate the sloped artifact, while respiratory noise maps do not (Fig. 2). Additionally, the slopes of the artifact change direction mid-scan (Fig. 4). The correlation between the calculated aliased velocity and downsampled heart rate is positive in two scans (r=0.57, r=0.57), and negative in the third (r=-0.47). In Figure 5, a heatmap of the CSF adjacent to the spinal cord shows the described sloped artifact.Discussion and Conclusion
Spinal cord fMRI heatmaps and fitted cardiac noise maps show an aliased cardiac artifact traveling along the longitudinal axis of the cord. The HR cannot generally be resolved in spinal cord fMRI at 3T – the Nyquist frequency for our TR is 0.25Hz, while a typical HR of 60bpm is 1Hz. RETROICOR addresses aliased cardiac noise by regression of a low-order Fourier series based on the phases of the cardiac cycle4. That RETROICOR effectively models and removes the artifact is an illustration of the cardiac origin of this artifact. Furthermore, voxels both adjacent to and contained within the CSF show this sloped artifact, indicating that partial voluming may bring this artifact into the spinal cord tissue. The small size of the cord additionally emphasizes that partial voluming of CSF into the gray matter signal of interest should be considered.Although 24 scans were initially evaluated, we could only extract artifact velocity on three. The artifact was semi-visible in other scans but they were excluded primarily because groups of points were not distinct. More data that overtly display this artifact will be important for further characterization. The order of slice acquisition (ascending) also indicates that the artifact could be due to inflow effects; data acquired with descending slices should be collected to test this. Although the artifact was effectively removed in these data, it is important to further characterize as the artifact may represent physiologically important information about CSF flow in the spinal canal.
Acknowledgements
Research supported by the Craig H. Neilsen Foundation (595499). K.J.H. is supported by an NIH funded Training Program (T32EB025766).References
- Eippert F, Kong Y, Jenkinson M, Tracey I, Brooks JCW. Denoising spinal cord fMRI data: Approaches to acquisition and analysis. NeuroImage. 2017;154:255-266. doi:10.1016/j.neuroimage.2016.09.065
- Giove F, Garreffa G, Giulietti G, Mangia S, Colonnese C, Maraviglia B. Issues about the fMRI of the human spinal cord. Magnetic Resonance Imaging. 2004;22(10 SPEC. ISS.):1505-1516. doi:10.1016/j.mri.2004.10.015
- Raj D, Anderson AW, Gore JC. Respiratory effects in human functional magnetic resonance imaging due to bulk susceptibility changes. Physics in Medicine and Biology. 2001;46(12):3331-3340. doi:10.1088/0031-9155/46/12/318
- Glover GH, Li TQ, Ress D. Image-based method for retrospective correction of physiological motion effects in fMRI: RETROICOR. Magnetic Resonance in Medicine. 2000;44(1):162-167. doi:10.1002/1522-2594(200007)44:1<162::AID-MRM23>3.0.CO;2-E
- Kong Y, Jenkinson M, Andersson J, Tracey I, Brooks JCW. Assessment of physiological noise modelling methods for functional imaging of the spinal cord. NeuroImage. 2012;60(2):1538-1549. doi:10.1016/j.neuroimage.2011.11.077
- Brooks JCW, Beckmann CF, Miller KL, et al. Physiological noise modelling for spinal functional magnetic resonance imaging studies. NeuroImage. 2008;39(2):680-692. doi:10.1016/j.neuroimage.2007.09.018
- Hemmerling KJ, Bright MG. A visualization tool for assessment of spinal cord functional magnetic resonance imaging data quality. 2021 43rd Annual International Conference of the IEEE Engineering in Medicine & Biology Society (EMBC).
- de Leener B, Lévy S, Dupont SM, et al. SCT: Spinal Cord Toolbox, an open-source software for processing spinal cord MRI data. NeuroImage. 2017;145:24-43. doi:10.1016/j.neuroimage.2016.10.009
- de Leener B, Fonov VS, Collins DL, Callot V, Stikov N, Cohen-Adad J. PAM50: Unbiased multimodal template of the brainstem and spinal cord aligned with the ICBM152 space. NeuroImage. 2018;165:170-179. doi:10.1016/j.neuroimage.2017.10.041
- Fitzgerald B, Yao JF, Talavage TM, Hocke LM, Frederick B de B, Tong Y. Using carpet plots to analyze transit times of low frequency oscillations in resting state fMRI. Scientific Reports. 2021;11(1):1-14. doi:10.1038/s41598-021-86402-z
Figures
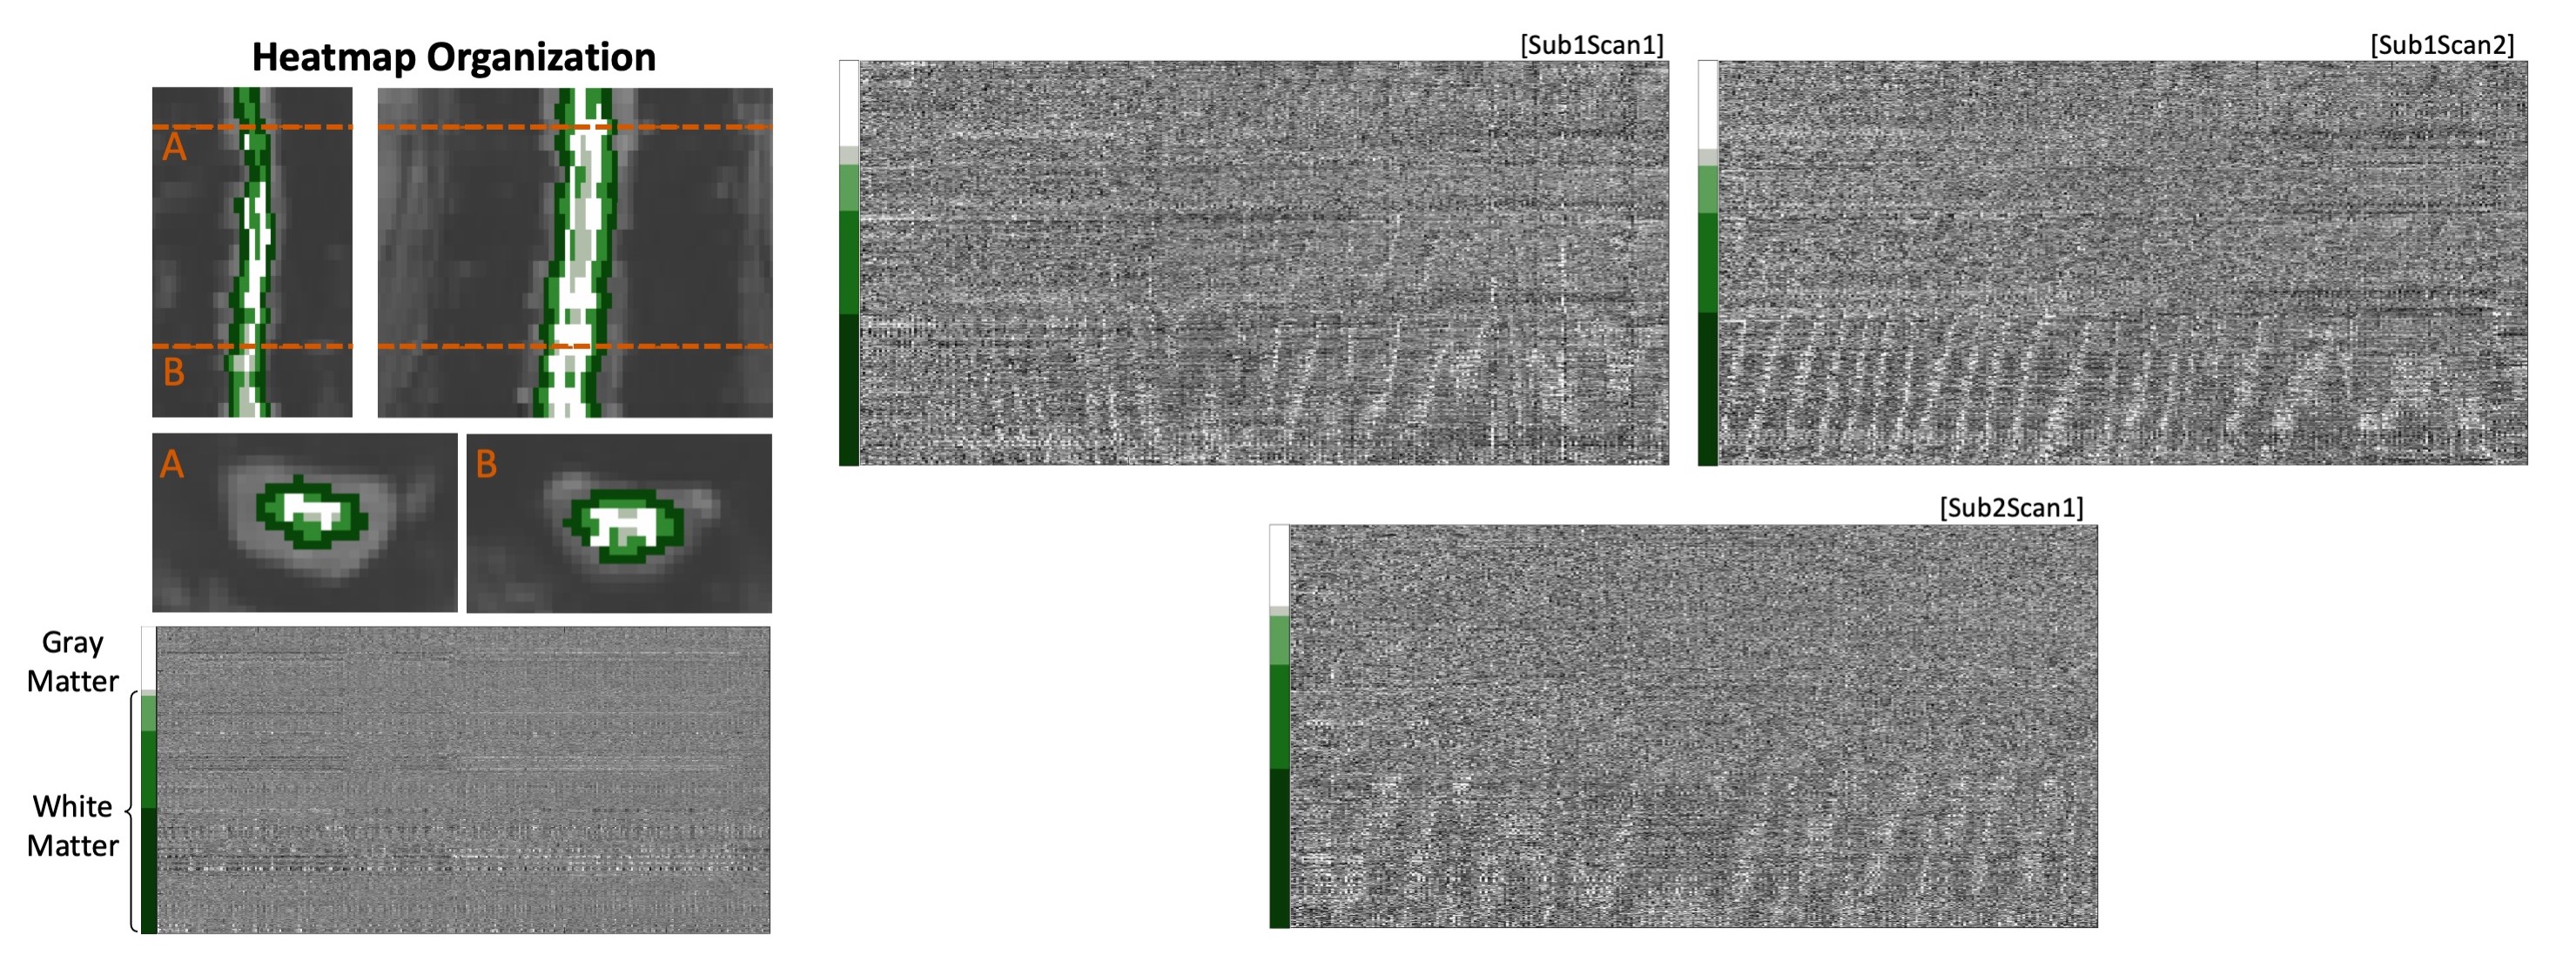
Figure 1. Spinal cord fMRI heatmaps reveal an artifact in the white matter region. (Left) Organization of heatmaps by concentric tissue type masks. Data within each tissue mask are sorted by slice. (Right) Datasets that were identified as showing the artifact. These three datasets are referred to in the following analyses. All scans are 10 minutes.
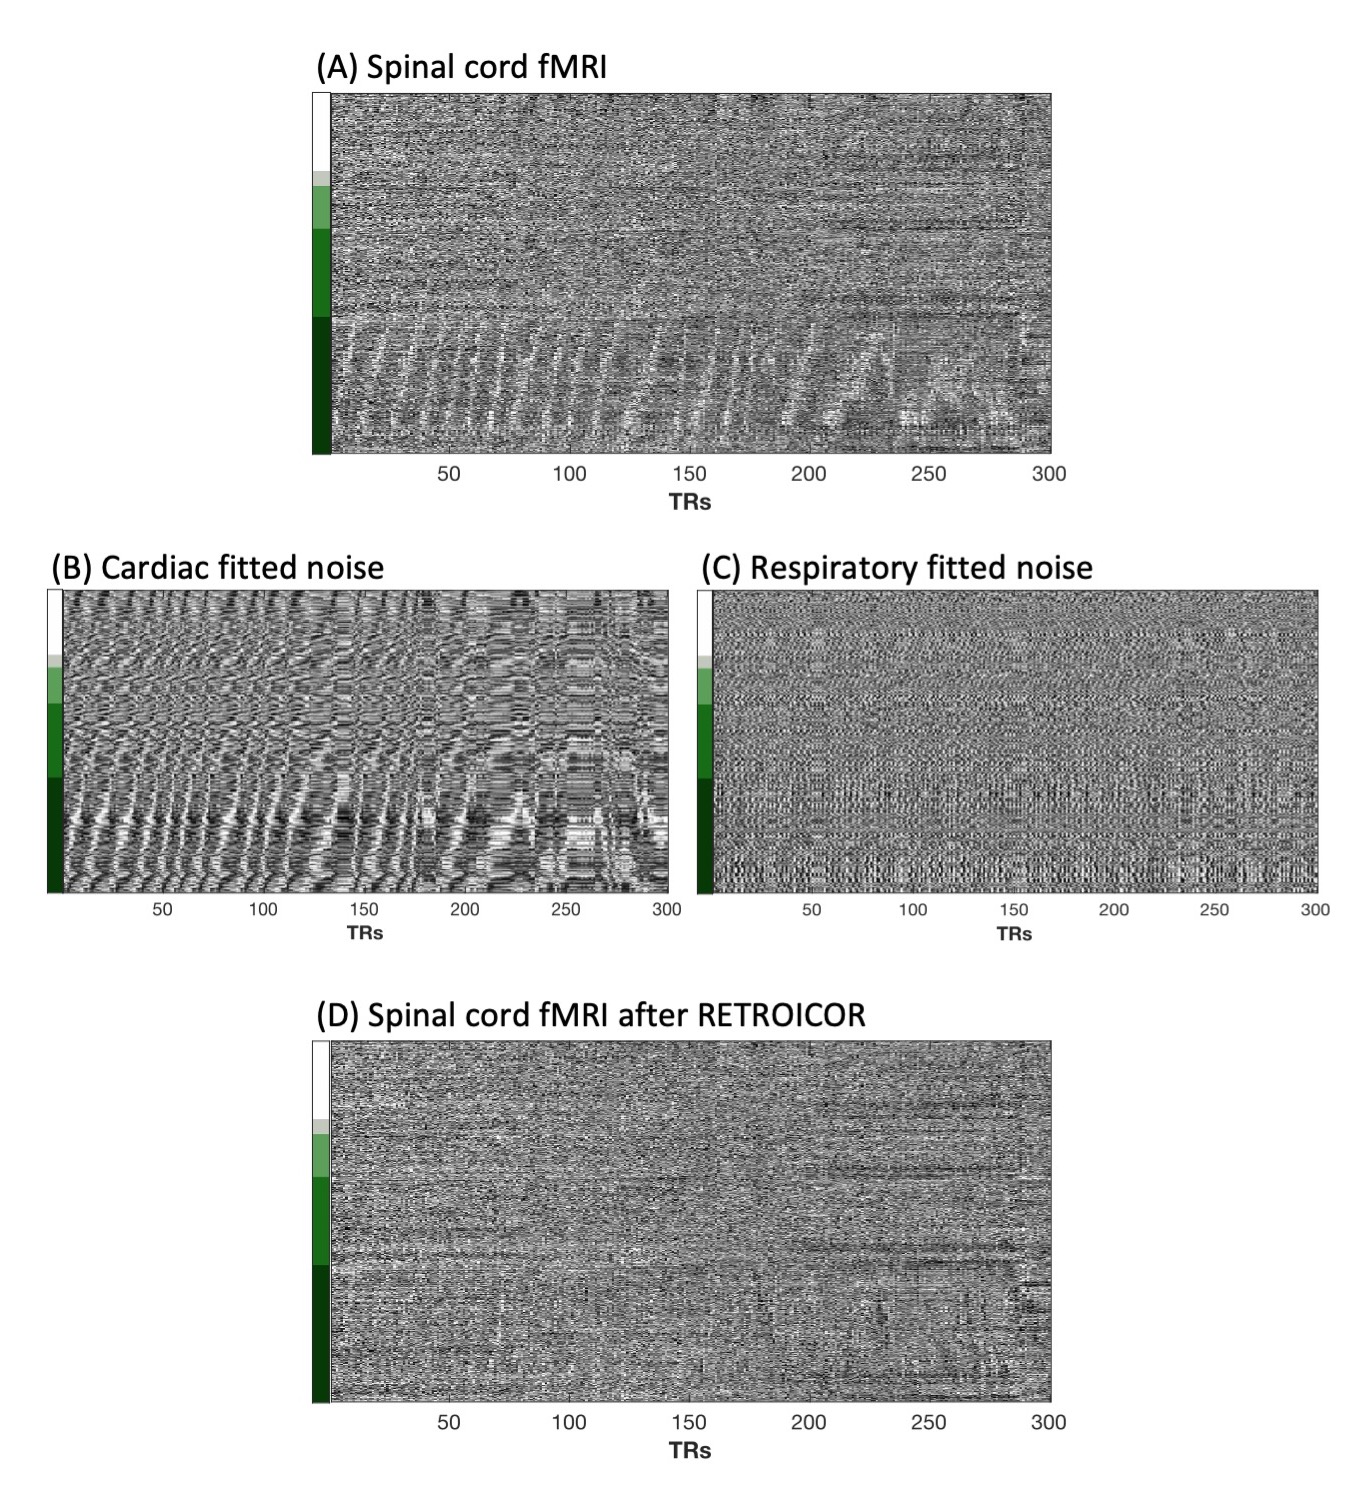
Figure 2. Noise removal by RETROICOR. (A) In a motion corrected fMRI dataset, a sloped artifact is localized to the outermost white matter region of the heatmap. Noise maps, representing the (B) cardiac and (C) respiratory noise that is removed by RETROICOR, are created by multiplying the RETROICOR regressors by their beta weights of the model fit. (D) The fMRI data after noise removal show minimal remnants of the artifact.
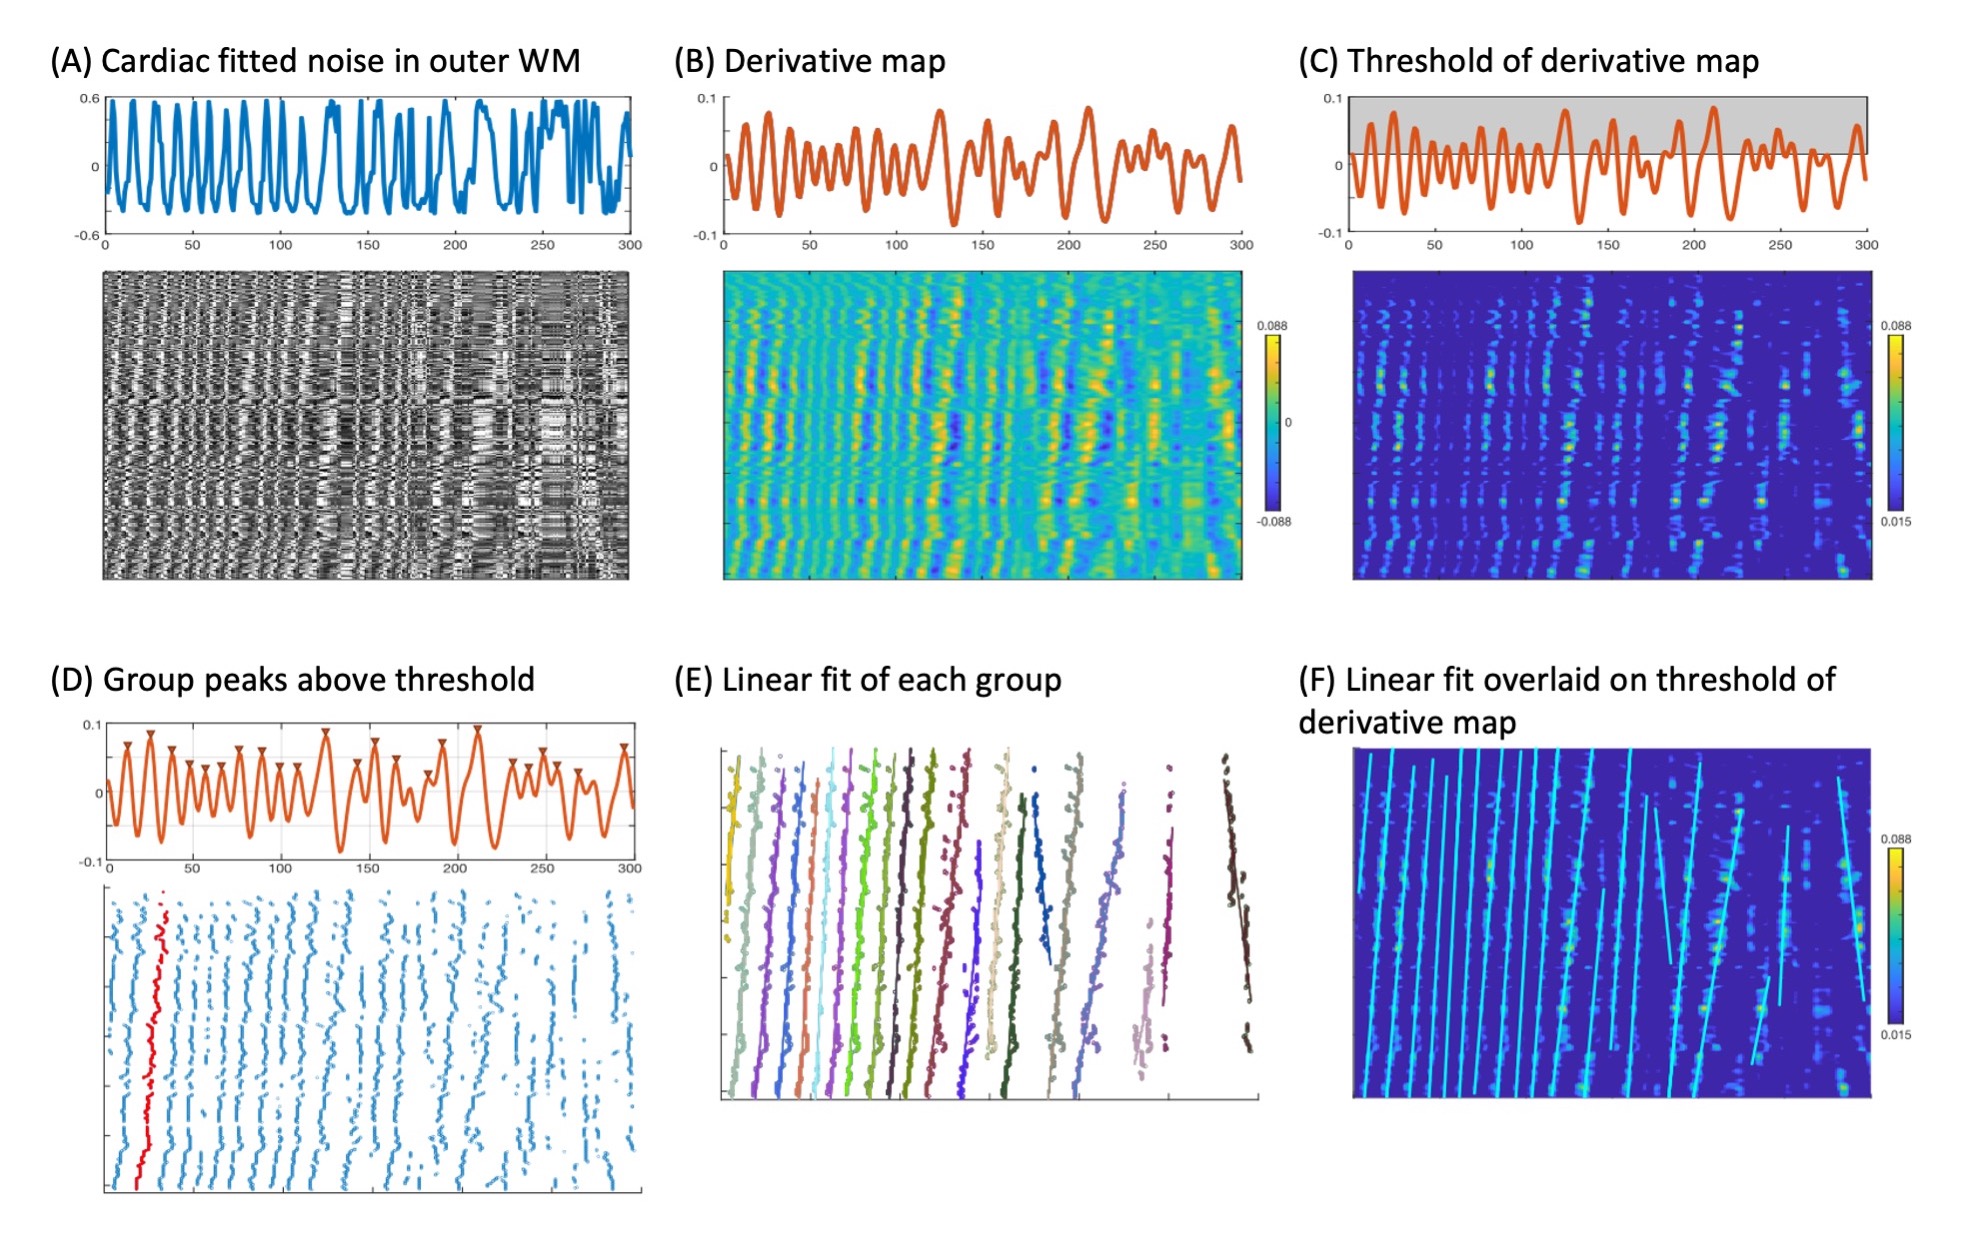
Figure 3. Methods to characterize the sloped artifact. (A) Cardiac noise map of outermost whiter matter. (B) Temporal derivative of each voxel’s cardiac noise timeseries. (C) Threshold of derivative (at 0.015). (D) Scatter plot of points above the threshold are grouped manually (indicated by red points). (E) Least squares regression fits of each group of points. (F) The fit overlaid on the temporal derivative plot. The artifact velocity is calculated based on these fits, slice thickness, and TR.
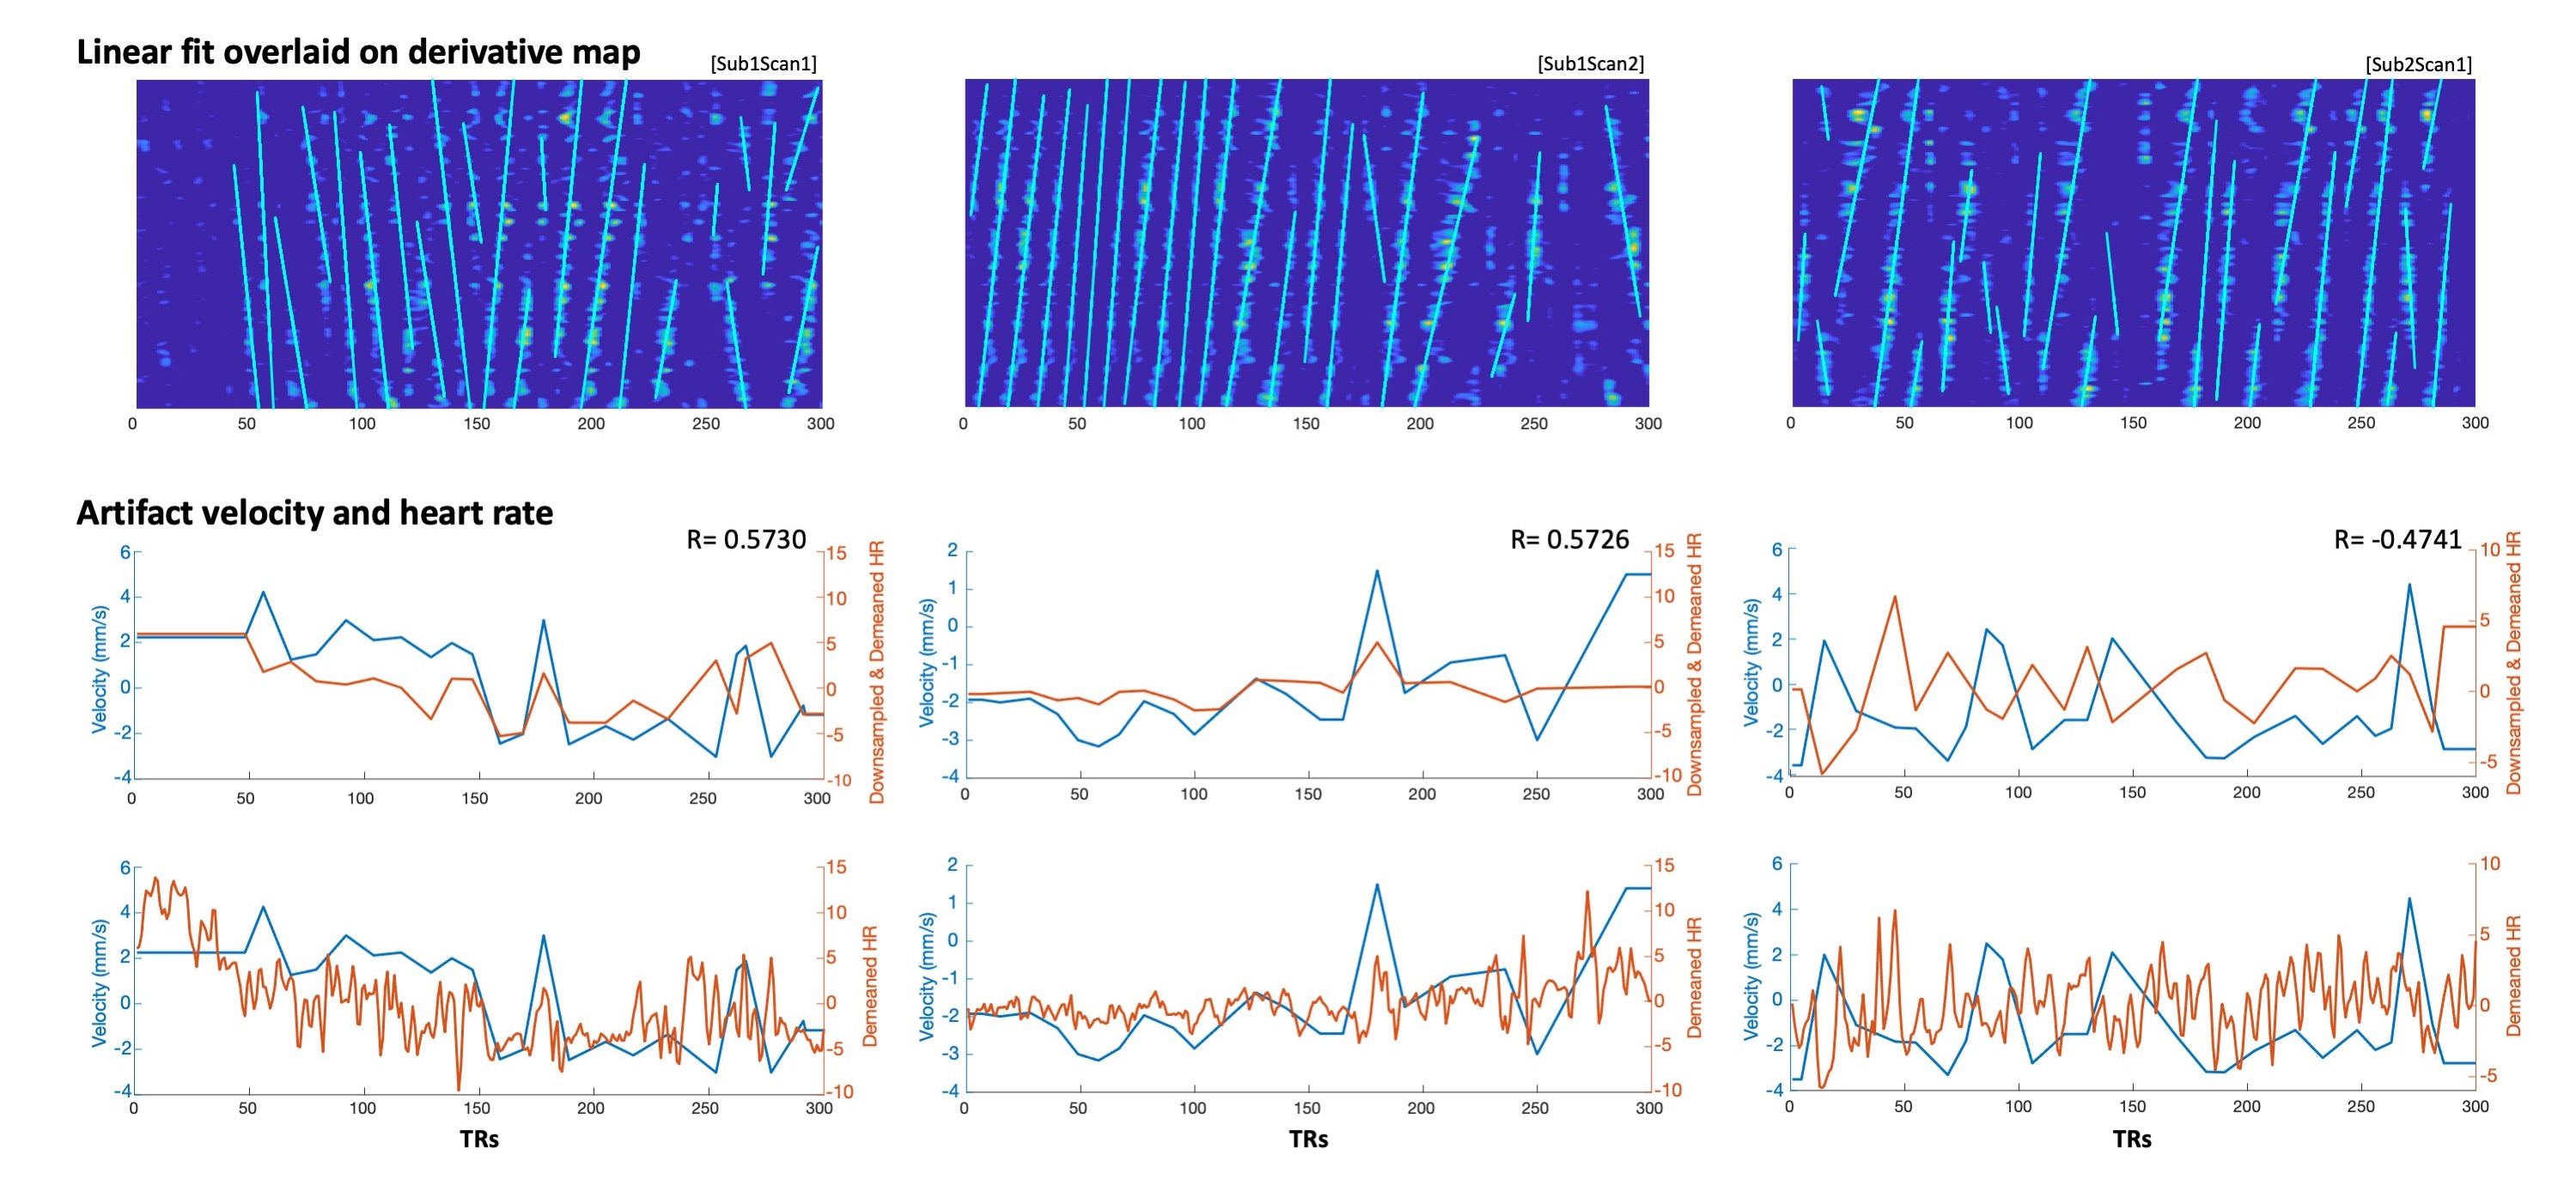
Figure 4. Comparison of velocities calculated from the least squares regression lines with heart rate. The top row shows regression lines overlaid on the temporal derivative map. In the middle row, the velocities calculated based on these fits are plotted with the heart rate, downsampled to match the sampling points of the artifact velocity trace, for which correlation coefficient (R) was calculated. The bottom row shows the velocities plotted with the non-downsampled heart rate.
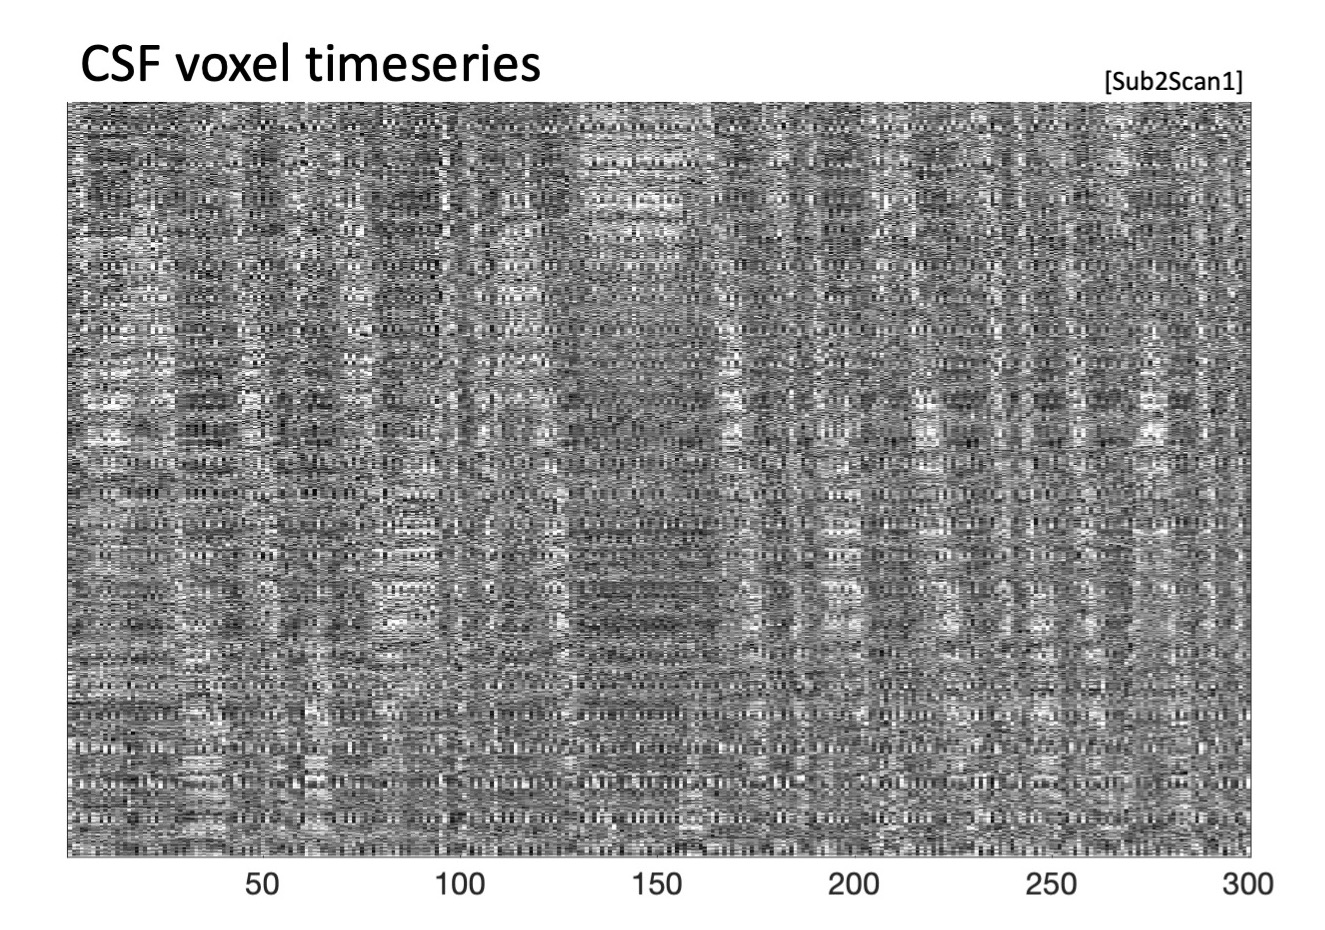
Figure 5. Heatmap of CSF voxels. The sloped artifact that was seen in the outermost white matter voxels is also visible in the CSF voxels adjacent to the spinal cord. See Fig. 1 for the corresponding spinal cord heatmap (Sub2Scan1).
DOI: https://doi.org/10.58530/2022/1461