1460
Cord compression from stenosis reduces resting-state functional connectivity in the cervical spinal cord1Vanderbilt University Institute of Imaging Science, Vanderbilt University Medical Center, Nashville, TN, United States, 2Radiology and Radiological Sciences, Vanderbilt University Medical Center, Nashville, TN, United States, 3Neurological Surgery, Vanderbilt University Medical Center, Nashville, TN, United States, 4Anesthesiology, Vanderbilt University Medical Center, Nashville, TN, United States, 5Orthopaedic Surgery, Vanderbilt University Medical Center, Nashville, TN, United States, 6Biomedical Engineering, Vanderbilt University, Nashville, TN, United States
Synopsis
Spinal cord stenosis presents with highly variable clinical manifestations and prognoses. Resting-state functional MRI of the cord could provide complementary information in addition to structural measures. We sought to determine whether functional connectivity (FC) measures were altered in patients with compression of the lower cervical spinal cord, and whether those were related to morphometric measures at and above the level of pathology. Compression in the lower segments was significantly associated with lower FC of the ventral and dorsal networks in patients. This finding is a first step in exploring the FC features of the cord in compressive pathology.
Introduction
Age-related degeneration of the vertebrae and spinal disks can cause stenosis (narrowing of the spinal canal), which can lead to cord compression, sensorimotor symptoms and pain, with a highly variable clinical course. Exploring functional alterations caused by cord compression could illuminate how cord activity may be disrupted in pathology, and advanced MRI could aid in identifying prognostic markers. Functional MRI (fMRI) studies have shown brain reorganization following cord compression, and decreased amplitudes of low-frequency fluctuations (ALFF) in the cord in myelopathy1. We evaluated resting-state functional connectivity (FC) in the cervical spinal cord in patients with clinically-identified compression. We hypothesized that FC is altered in areas of compression, and may be related with structural and clinical indices of neurological impairment.Methods
Sixteen patients with degenerative diseases of the cervical spine presenting with radiologically confirmed cord compression at C5 and below, and 16 healthy controls, were included. The clinician-administered Nurick myelopathy scale, mJOA (functional impairment), and the patient-reported Neck Disability Scale and PROMIS pain questionnaire were used to document disability in patients.Participants were scanned on a 3T Elition scanner (Philips Healthcare Inc.) using a 32-channel neurovascular coil for reception and a 2-channel body coil for signal transmission. Acquisition was centered at the C4/C5 disk.
Sagittal T2-weighted TSE: TR/TE=2500/100ms, α=90°, slices=18, voxel size 0.8x1x2mm3.
PD/T2*-weighted axial multi-echo gradient-echo FFE (mFFE): TR/TE1/ΔTE=752/7.1/8.8ms, α=28°, slices=14, voxel size 0.65x0.65x5mm3 (3 echoes averaged).
Resting-state fMRI: 3D axial multishot GRE, volume acquisition time=2.46s, TE=20ms, α=8°, slices=14, voxel size 1x1x10mm3, 250 dynamics (~10 minutes), EPI factor=9.
Processing was performed using FSL v6.0.42, SCT v4.0.23 , and in-house Matlab code. Vertebral levels were identified on sagittal T2 images and registered to axial acquisitions. Angle-corrected cross-sectional area (CSA), anterior-posterior (AP) diameter, and compression ratio (CR) were calculated slicewise from the mFFE.
fMRI processing included motion correction, nuisance regression (physiological traces using AFNI-RETROICOR4, CSF/global signal, motion parameters), band-pass filtering (0.01-0.10 Hz), and calculation of Pearson’s correlation coefficients between the left-right ventral and dorsal horns, followed by Fisher’s r-to-z transform. Mean z-scores were calculated subject-wise across all slices between C3-C6 (excluding top/bottom two slices). Temporal SNR (TSNR) was calculated after nuisance regression.
CSA, AP diameter, CR, and ventral and dorsal networks z-scores were compared between groups across vertebral levels using t-tests. Data were separated into higher (slices at C3-C4) and lower segments (C5-C6), and linear regression models were used to evaluate the effect of AP diameter on ventral and dorsal z-scores in each group (8 models in total), controlling for age, sex, and TSNR. Differences in MRI indices between sub-groups categorized by Nurick/mJOA scales were assessed with Kruskal-Wallis tests, and correlations with Neck Disability/PROMIS scores with Spearman’s rank correlation coefficient.
Results
Evaluation of the acquired scans (examples in Figure 1) revealed that 3 healthy controls had visible, subclinical compression, and were excluded from further analyses. Patients and the remaining controls did not differ on age (controls: 51.5±9.4, patients: 57.2+11.2, p>.05) or sex (controls: 8F/5M, patients: 9F/7M, chi-square p>.05). TSNR was similar between groups (controls: 19.6±5.2, patients: 16.8±5.0, p>.05).Structural measures, ventral and dorsal z-scores did not significantly differ between groups; distribution across vertebral levels are shown in Figures 2&3.
The effect of TSNR was highly significant for both groups, levels and networks (all p<.001), with higher TSNR linked with lower connectivity. In controls, there were significant effects of age and sex on ventral, but not dorsal z-scores, with higher connectivity found in younger participants and women. In patients, at C3-C4, sex had a significant effect on ventral connectivity (p=.038). At C5-C6, smaller AP diameter was significantly associated with lower connectivity after accounting for demographic factors and TSNR, for both ventral (p=.006) and dorsal (p=.046) z-scores (Figure 4).
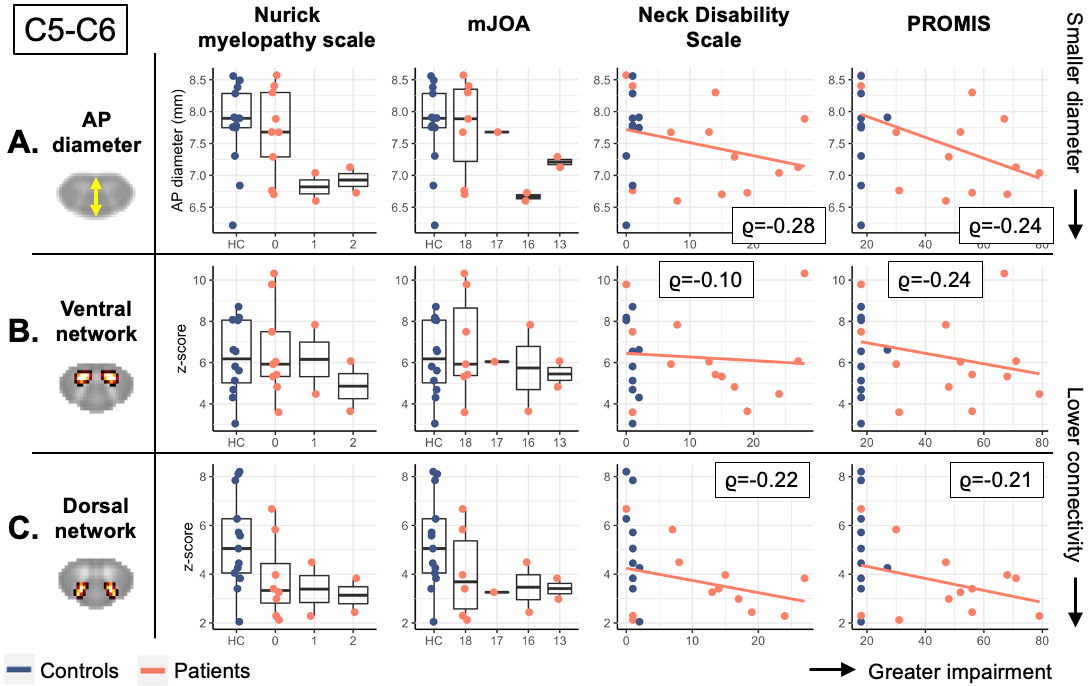
Figure 5 shows the distribution of structural and functional measures at C5-C6, stratified by clinical scores for disease severity, functional impairment, and pain. There were no significant sub-group differences or clinical-radiological correlations. Reduced AP diameter and lower connectivity scores were seen in the patients with abnormal Nurick and mJOA scores. As expected given the associations between AP diameter and z-scores, patients with highest Neck Disability and PROMIS scores had lower connectivity than controls.
Discussion
In both groups, connectivity was significantly associated with TSNR, with higher TSNR corresponding to lower z-scores. In lower spinal levels, there was a significant association between connectivity strength and cord diameter in patients, suggesting decreases in connectivity occurred only at the level of pathology. Finally, demographic effects were seen in controls. Few studies have investigated variations in cord FC in the general population, although sex effects have been observed before5. Although correlations were not significant, patients with higher functional impairment showed lower AP diameter and connectivity z-scores. Possible associations between neurological disability and connectivity may be observed in a larger sample with greater variance in clinical scores. The three controls and additional similar subjects with subclinical compression may also present an opportunity to examinate symptomatic vs. asymptomatic compression. This work provides preliminary evidence that fMRI-derived measures of spinal cord connectivity can show associations with structural pathology. Future work will include details on the location and lateralization of compression, and will incorporate DTI and QMT measures to further characterize tissue pathology in relation to functional connectivity.Acknowledgements
The authors thank all study participants and the VUIIS MRI technologists. Dr O’Grady is supported by NIH awards KL2TR002245 and K01EB030039. Dr Smith is supported by the Conrad Hilton Foundation, National MS Society, and NIH award R01NS104149-02. This work was supported by NIH award R01NS109114-01.
References
1. Liu, Xiaojia, et al. "Amplitude of low frequency fluctuation (ALFF) in the cervical spinal cord with stenosis: a resting state fMRI study." PLoS One 11.12 (2016): e0167279.2. Smith, Stephen M., et al. "Advances in functional and structural MR image analysis and implementation as FSL." Neuroimage 23 (2004): S208-S219.
3. De Leener, Benjamin, et al. "SCT: Spinal Cord Toolbox, an open-source software for processing spinal cord MRI data." Neuroimage 145 (2017): 24-43.
4. Glover, Gary H., Tie‐Qiang Li, and David Ress. "Image‐based method for retrospective correction of physiological motion effects in fMRI: RETROICOR." Magnetic Resonance in Medicine: An Official Journal of the International Society for Magnetic Resonance in Medicine 44.1 (2000): 162-167.
5. Conrad, Benjamin N., et al. "Multiple sclerosis lesions affect intrinsic functional connectivity of the spinal cord." Brain 141.6 (2018): 1650-1664.
Figures
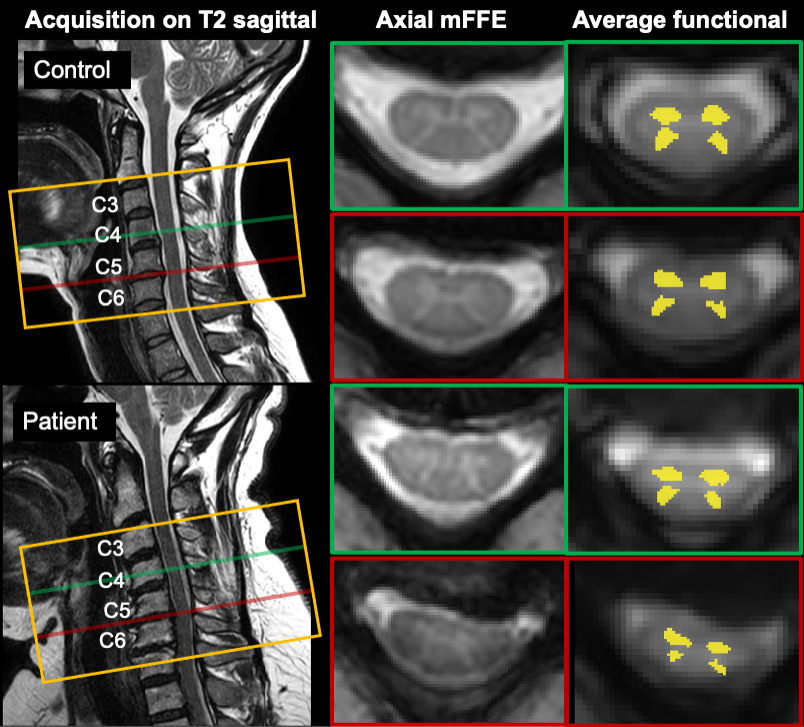
Figure 1. Example acquisition in a control (48F, top) and a patient (49F, bottom). Orange box shows the acquisition field of view (14 slices total); green and red lines show the location of example acquired slices in the sagittal plane and corresponding axial mFFE anatomical images. Slices shown were chosen to illustrate areas at and above compression level in the patient, and corresponding slices in the control.
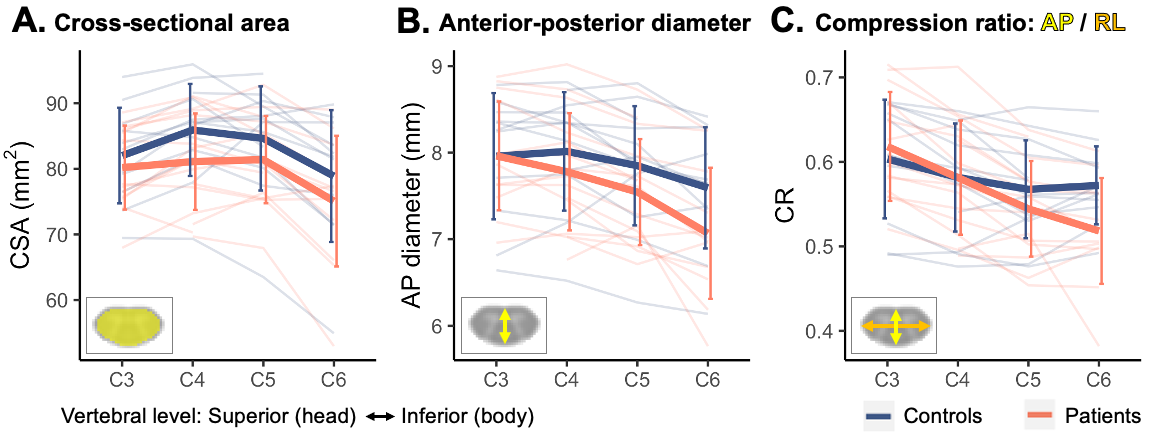
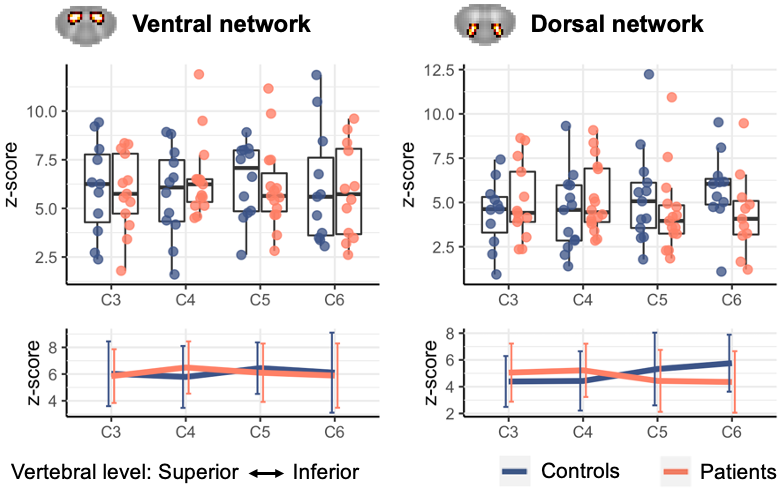
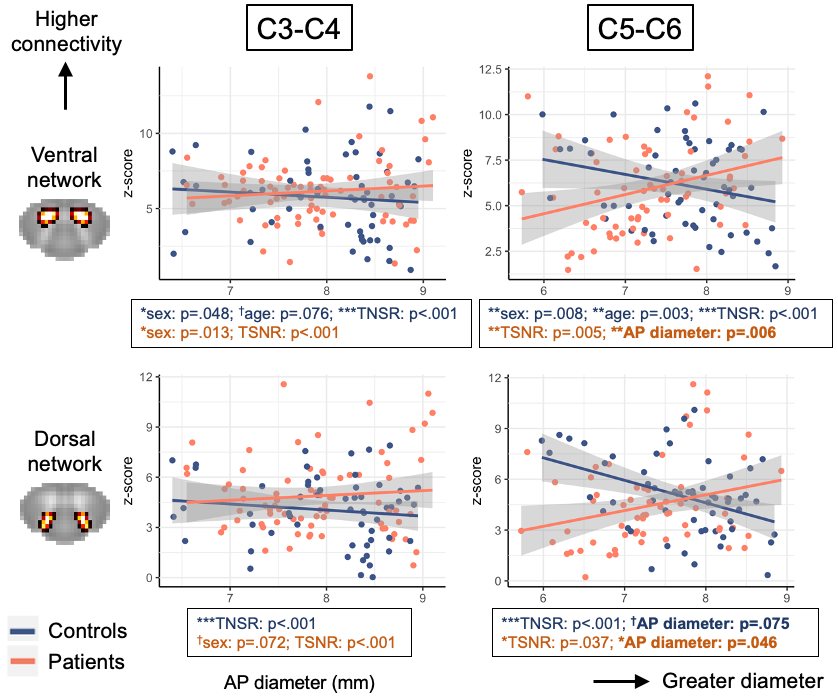
Figure 4. Associations between AP diameter and ventral (top) and dorsal (bottom) z-scores, for the C3-C4 and C5-C6 levels separately. One data point = one slice. Left: In the upper segments, no correlations in either group. Right: In lower segments, controls and patients show inverse relationships between AP diameter and connectivity. In patients, correlation between smaller diameter (= compression) and lower connectivity is significant when controlling for demographic factors (age, sex) and TSNR.