1458
Detection of resting-state functional connectivity networks in the human lumbar spinal cord at 3T1Vanderbilt University Institute of Imaging Science, Vanderbilt University Medical Center, Nashville, TN, United States, 2Radiology and Radiological Sciences, Vanderbilt University Medical Center, Nashville, TN, United States, 3Neurology, Vanderbilt University Medical Center, Nashville, TN, United States, 4Biomedical Engineering, Vanderbilt University, Nashville, TN, United States
Synopsis
3D multishot GRE resting-state BOLD-sensitive images of the lumbar spinal cord were acquired in 10 healthy participants as part of a functional MRI (fMRI) protocol. Temporal SNR in the gray matter (GM) was 18.2±4.3 after post-processing. Average correlations at rest were 0.49±0.17 between ventral horns, and 0.55±0.13 between dorsal horns, and could be detected at the single-subject level using seed-based analysis. Independent Component Analysis in 6 subjects, each scanned on two different occasions, identified network nodes within GM that were consistent across sessions. FMRI of the lumbar spine is feasible and may reflect functional integrity of the lumbar cord.
Introduction
Functional MRI of the spinal cord has been used to detect areas of activation in response to sensory or tactile stimuli, to delineate resting-state networks within and between segments, and to investigate changes that occur in diseases such as fibromyalgia, multiple sclerosis, and spinal cord injury1. The development of acquisition and analysis methods has focused to date on the cervical cord. The functional organization of the lumbar cord is also of interest, and the lumbar presents some imaging advantages relative to the cervical cord (lesser motion, greater proportion of gray matter), but is also challenged by other issues including greater B0 inhomogeneity (due to position within large bones), temporally varying B0 inhomogeneity (due to proximity to the lungs), and the effects of arterial pulsations and CSF flow2. Previous studies have relied on a variety of block-design paradigms including thermal3,4 or vibration5,6 stimulation of the lower dermatomes, lower limb motor task7, sexual stimulation8, an interoceptive awareness task9, and viewing of 'visceral' negative stimuli10. Building on previous work at 3T and 7T that devised robust acquisition and analysis methods for the cervical spine, we developed and applied a resting-state fMRI protocol at 3T in healthy volunteers, with the aim of detecting and quantifying resting-state functional connectivity in the lumbar cord.Methods
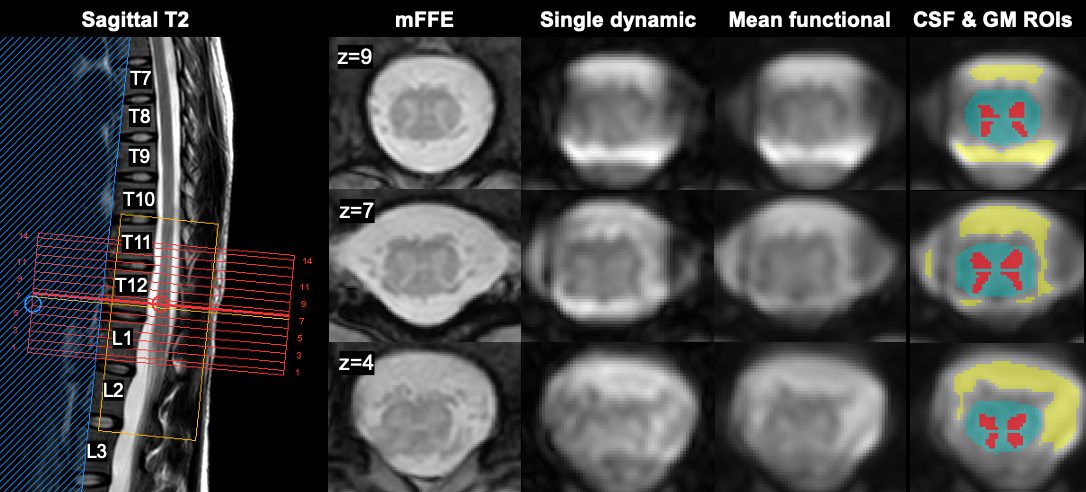
Ten healthy controls were included (mean age 41y±11, 6F/4M). Six returned for a second visit. Scans were performed on a 3T Philips dStream Ingenia MR scanner with 2-channel transmit and a dStream total spine coil combined with an integrated 12-channel posterior coil for reception. Acquisitions were centered at the lumbar enlargement of the spinal cord (corresponding to vertebral levels T11-L1, depending on subject). Each functional run used a 3D axial multi-shot gradient echo sequence with volume acquisition time=2.6s, TE=20ms, α=8°, FOV=110x101mm2, 14 slices, voxel size 1.1x1.1x10mm3 (reconstructed to 0.43x0.43x5mm3), 200 dynamics (~9 minutes), EPI factor=9, and a saturation pulse ('ProSet 1331') for fat suppression.Processing was performed using FSL v6.0.411, SCT v4.0.212, and in-house code for fMRI analysis, including motion correction, nuisance regression (physiological traces using AFNI-RETROICOR13, CSF and global signal, and motion correction parameters14), and band-pass filtering between 0.01-0.10Hz. A gray matter (GM) mask was partitioned into quadrants to define regions of interest in the four horns. Temporal SNR (= mean of each time-series over its standard deviation) was calculated voxel wise after different processing steps. Pearson’s r correlation coefficients were calculated between each ROI pair within each slice. The average correlation per subject was calculated as the mean across the central 8 slices. AFNI-InstaCorr was used to explore seed-based correlations in one subject.
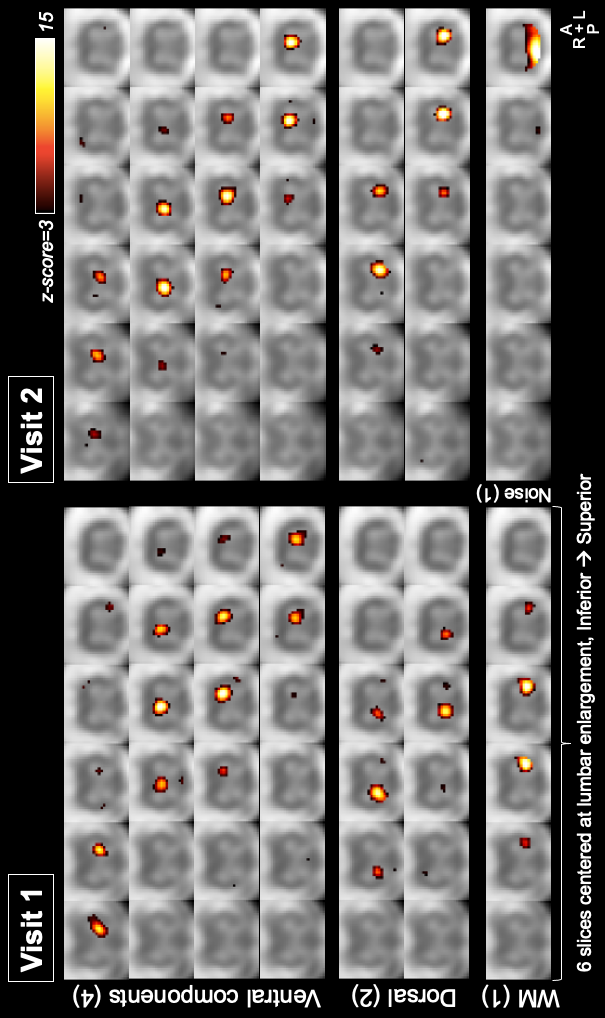
Six subjects with repeat visits were also used for ICA; both sessions were analyzed separately. Data after nuisance regression were cropped to 6 slices centered at the lumbar enlargement (slices 4:9). A subject with (visually assessed) good quality data was chosen as a target, to which all 5 subjects within each session were registered using in-plane nonlinear deformations. ICA was performed in Matlab R2018b using the GIFT toolbox v3.0b15, using the ‘Infomax’ algorithm, a preset of 50 components, and a cord mask. Components were visually inspected and classified into four categories: ventral and dorsal GM, white matter (WM), and noise. GM components were matched between the two visits to determine their between-session consistency.
Results
Representative data for one subject are shown in Figure 1. TSNR in the GM increased from 4.47±1.97 after motion correction to 18.2±4.3 after nuisance regression (Figure 2).Correlation coefficients for each of the six in-slice networks of interest are shown in Figure 3. Average correlations between GM horns, averaged across slices and subjects, were 0.49±0.17 for the ventral horns and 0.55±0.13 for the dorsal horns.
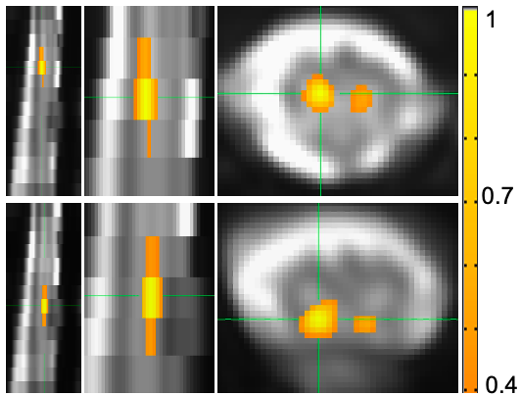
Figure 4 shows an example of within- and between-slice seed-based correlations in one subject using AFNI-InstaCorr.
ICA components were classified as follows. Visit 1: ventral=8, dorsal=7, WM=19, noise=15; Visit 2: ventral=8, dorsal=6, WM=20, noise=16. GM components were visually matched between the two visits; example components (not an exhaustive representation of all obtained components) showing good inter-session consistency are shown in Figure 5.
Discussion
Acquired image quality was sufficient to allow implementation of standard data processing methods and semi-automated tools developed for analysis of cervical spine data. TSNR in the GM was on par with previously reported values16,17 for cervical spine fMRI (~15-20). The typical pattern of higher connectivity in the ventral compared to dorsal network was not observed here, although values for both of those were higher than other networks. This could be due to different characteristics of functional connectivity in the lumbar cord, or the greater amount of dorsal GM in this region facilitating detection of strong correlations. While the majority of components revealed with ICA were in the WM, components consistent with GM activity in both ventral and dorsal regions were also found, extending across 1-4 slices. Qualitative consistency between components was observed for several networks. Inclusion of more participants will enable a more quantitative evaluation of the stability of networks across subjects and sessions. Resting-state fMRI of the lumbar cord may offer opportunities for investigations into clinical populations with urological dysfunction, spinal cord injury, or neurodegenerative diseases like multiple sclerosis.Acknowledgements
The authors thank all study participants and the VUIIS MRI technologists. This work was supported by the National Institutes of Health under award numbers KL2TR002245 (K.P.O.), K01EB030039 (K.P.O.), and 5R01NS109114 (S.A.S.).References
1. Powers, Jocelyn M., Gabriela Ioachim, and Patrick W. Stroman. "Ten key insights into the use of spinal cord fMRI." Brain sciences 8.9 (2018): 173.
2. Dehghani, Hamed, et al. "Effect of Physiological Noise on Thoracolumbar Spinal Cord Functional Magnetic Resonance Imaging in 3T Magnetic Field." Basic and Clinical Neuroscience 11.6 (2020): 737.
3. Stroman, Patrick W., et al. "Mapping of neuronal function in the healthy and injured human spinal cord with spinal fMRI." Neuroimage 17.4 (2002): 1854-1860.
4. Stroman, P. W., et al. "Noninvasive assessment of the injured human spinal cord by means of functional magnetic resonance imaging." Spinal Cord 42.2 (2004): 59-66.
5. Lawrence, Jane M., Patrick W. Stroman, and Spyros S. Kollias. "Functional magnetic resonance imaging of the human spinal cord during vibration stimulation of different dermatomes." Neuroradiology 50.3 (2008): 273-280.
6. Kornelsen, Jennifer, et al. "Functional MRI of the thoracic spinal cord during vibration sensation." Journal of Magnetic Resonance Imaging 37.4 (2013): 981-985.
7. Kornelsen, J., and P. W. Stroman. "fMRI of the lumbar spinal cord during a lower limb motor task." Magnetic Resonance in Medicine: An Official Journal of the International Society for Magnetic Resonance in Medicine52.2 (2004): 411-414.
8. Alexander, Marcalee, et al. "Altered spinal cord activity during sexual stimulation in women with SCI: a pilot fMRI study." Spinal cord series and cases 3.1 (2017): 1-4.
9. Kashkouli Nejad, Keyvan, et al. "Spinal fMRI of interoceptive attention/awareness in experts and novices." Neural plasticity 2014 (2014).
10. Kornelsen, Jennifer, Stephen D. Smith, and Theresa A. McIver. "A neural correlate of visceral emotional responses: evidence from fMRI of the thoracic spinal cord." Social cognitive and affective neuroscience 10.4 (2015): 584-588.
11. Smith, Stephen M., et al. "Advances in functional and structural MR image analysis and implementation as FSL." Neuroimage 23 (2004): S208-S219.
12. De Leener, Benjamin, et al. "SCT: Spinal Cord Toolbox, an open-source software for processing spinal cord MRI data." Neuroimage 145 (2017): 24-43.
13. Glover, Gary H., Tie‐Qiang Li, and David Ress. "Image‐based method for retrospective correction of physiological motion effects in fMRI: RETROICOR." Magnetic Resonance in Medicine: An Official Journal of the International Society for Magnetic Resonance in Medicine 44.1 (2000): 162-167.
14. GIFT: Calhoun, Vince D., et al. "A method for making group inferences from functional MRI data using independent component analysis." Human brain mapping 14.3 (2001): 140-151.
15. Barry, Robert L., et al. "Reproducibility of resting state spinal cord networks in healthy volunteers at 7 Tesla." Neuroimage133 (2016): 31-40.
16. Eippert, Falk, et al. "Investigating resting-state functional connectivity in the cervical spinal cord at 3 T." Neuroimage147 (2017): 589-601.
17. Barry, Robert L., et al. "A practical protocol for measurements of spinal cord functional connectivity." Scientific reports 8.1 (2018): 1-10.
Figures