1457
Dynamic Contrast Enhanced MR perfusion of the Spinal Cord with radial streaking artefacts reduction at 3T: Preliminary results and applications1Aix-Marseille University, CNRS, CRMBM, Marseille, France, 2iLab-Spine International Associated Laboratory, Marseille-Montréal, France, 3AP-HM, Hôpital de la Timone, CEMEREM, Marseille, France, 4AP-HM, Hôpital Timone, Neurosurgery Dept., Marseille, France, 5Siemens Healthcare SAS, Saint-Denis, France
Synopsis
3T T1-GRASP acquisition combined with an optimized dynamic radial streaking artefacts reduction have been set up to analyze Dynamic Contrast Enhanced MRI (DCE) over time and spinal cord levels. Acquisition with Gd-injection using the best temporal resolution parameters have been applied on two healthy volunteers and one patient showing perfusion dysfunction with compression. Semi-quantitative parameters (SQP) have been calculated in different regions of interest along the cervical levels and voxel-wise to provide SQP axial mapping of the spinal cord.
Introduction
Blood perfusion is frequently involved in spinal cord (SC) injuries1,2 or nontraumatic disorders involving disk degeneration or cord compression. Indeed, cord compression may result in a local reduction of tissue perfusion and progressive ischemia, leading to metabolism alteration and potentially irreversible tissue damage3,4. In such cases, perfusion recovery is conditional for clinical improvement. Although dynamic susceptibility contrast (DSC) MRI and global curve cord analysis have shown promising result at 3T in cervical spondylotic myelopathy patients, unfortunately, at this time there is a critical lack of technique to confidently assess local SC perfusion status. IVIM (intra voxel incoherent motion) and DSC MRI have been investigated at 7T showing the possibility of perfusion mapping in SC 5,6 but these methods relied on the EPI technique and hence suffered from distortion and dynamic B0 variations. In line with recent advances and in the perspectives of further clinical explorations, this study provides proof of feasibility and preliminary applications of T1-DCE perfusion MRI in the spinal cord.Methods
Data were acquired on a Siemens Magnetom Vida 3T MRI scanner with a 20-channel head and neck coils (Siemens Healthineers, Erlangen, Germany). Two healthy volunteers (V1, V2) and one patient with myelopathy (24, 21, 30 years old, 1M/2F) participated in the study. The protocol was approved by the local Ethics Committee and written consents were obtained from all participants prior to MR examinations.The MR protocol focused on anatomical, structural and perfusion explorations of the cervical SC from C1 to C7 and included:
- a sagittal 2D T2-weighted turbo spin echo (TSE) sequence
- an axial 2D T2*-weighted multi-echo gradient echo (MGE) sequence (20 slices)
- an axial 3D T1-GRASP (acq1) without gadolinium (Gd) injection (20 slices)
- an axial 3D T1-GRASP (acq2) with Gd injection (20 slices)
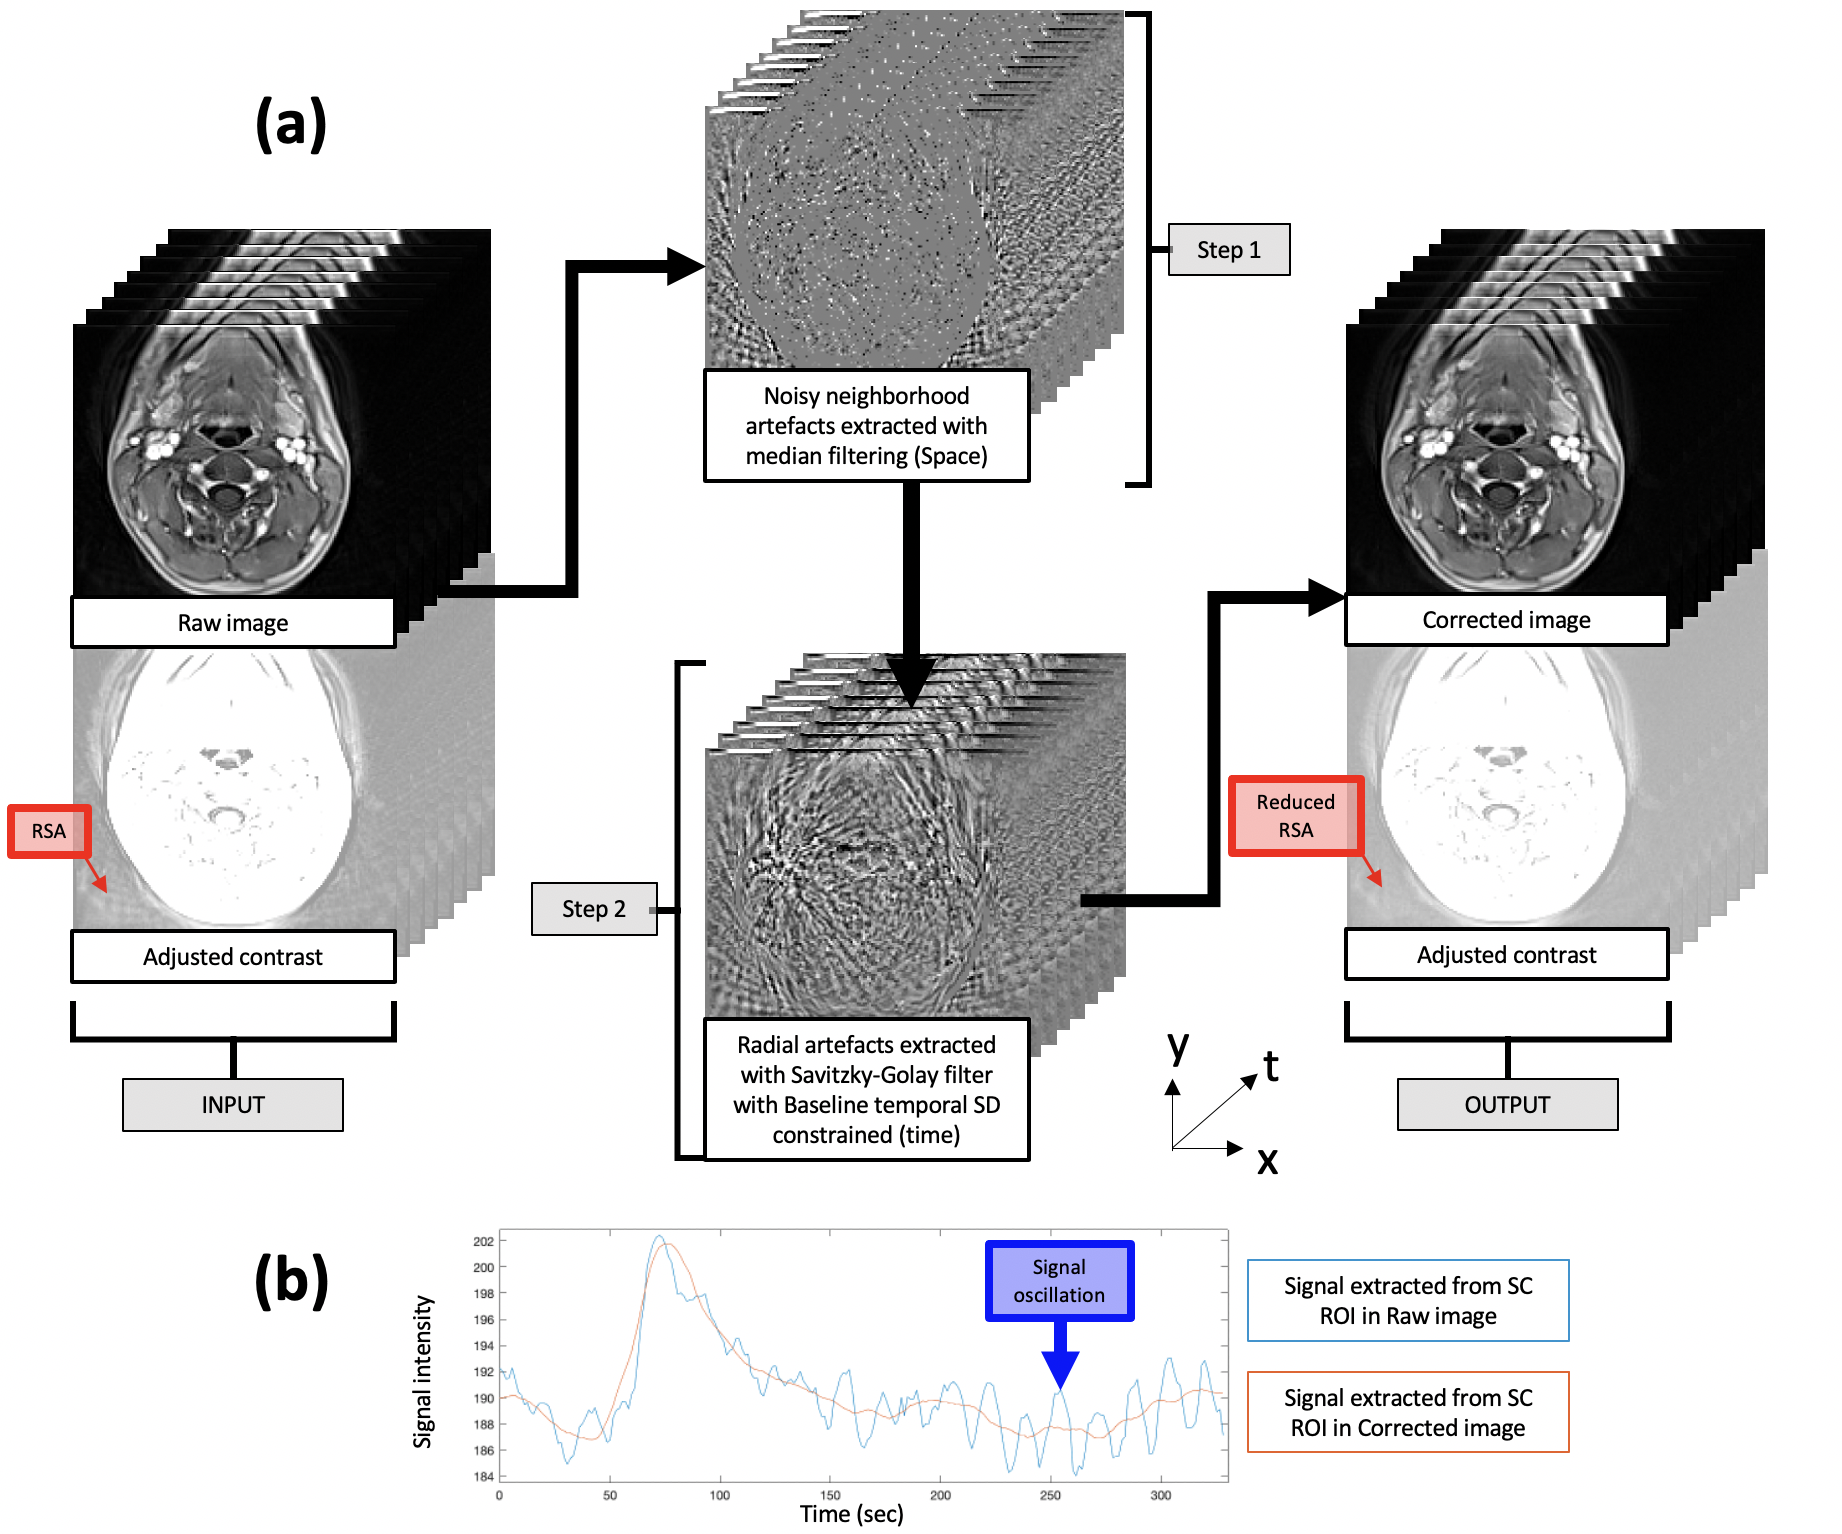
The T1-GRASP parameters were initially optimized on phantom and healthy controls without injection. As raw data acquired with dynamic T1-GRASP sequence for DCE MRI usually show dynamic radial streaking artefact (RSA) (Fig.1a, red arrow), inducing signal oscillation through time (Fig.1b, blue curve), a post-processing strategy was implemented (Fig.1). MR parameters for V1 and V2/P were finally varied to identify the best compromise between spatial resolution, temporal resolution and artefacts reduction strategy. The optimized parameters were: in-plane resolution of 0.77 mm2 (slice thickness: 5mm), temporal resolution of 11.4s (P1: 150s) / 2.7s (P2: 10s) / 1.7s (P3: 50s) / 7s (P4: 110s) (total scan time: 5min20s ), TR/TE/: 6 msec/1.85msec/11. DOTAREM® 0,5 mM/mL was injected at a flow rate of 5.0 ml/s followed by a 20-mL saline flush (same flow rate).P1-to-P4 phases correspond to baseline, arterial phase, bolus passage and wash-out.
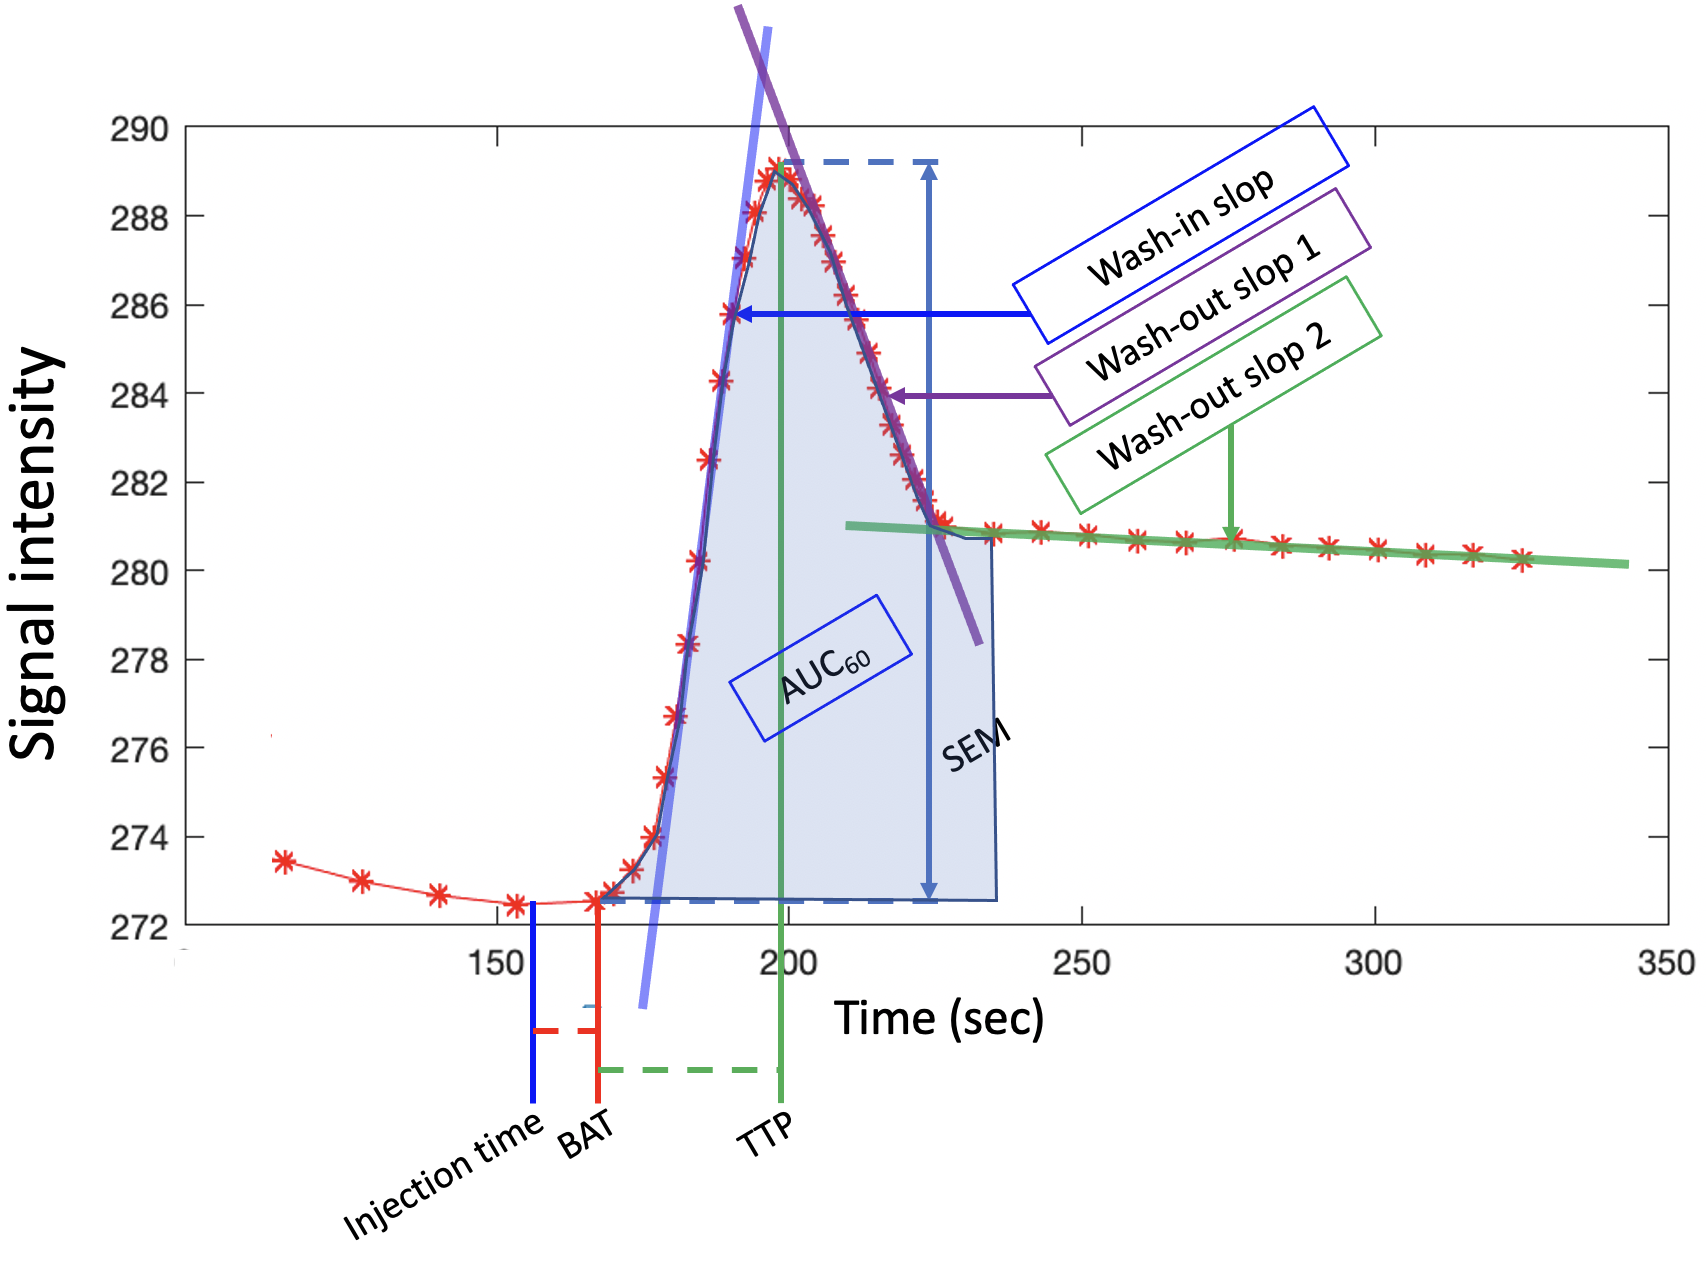
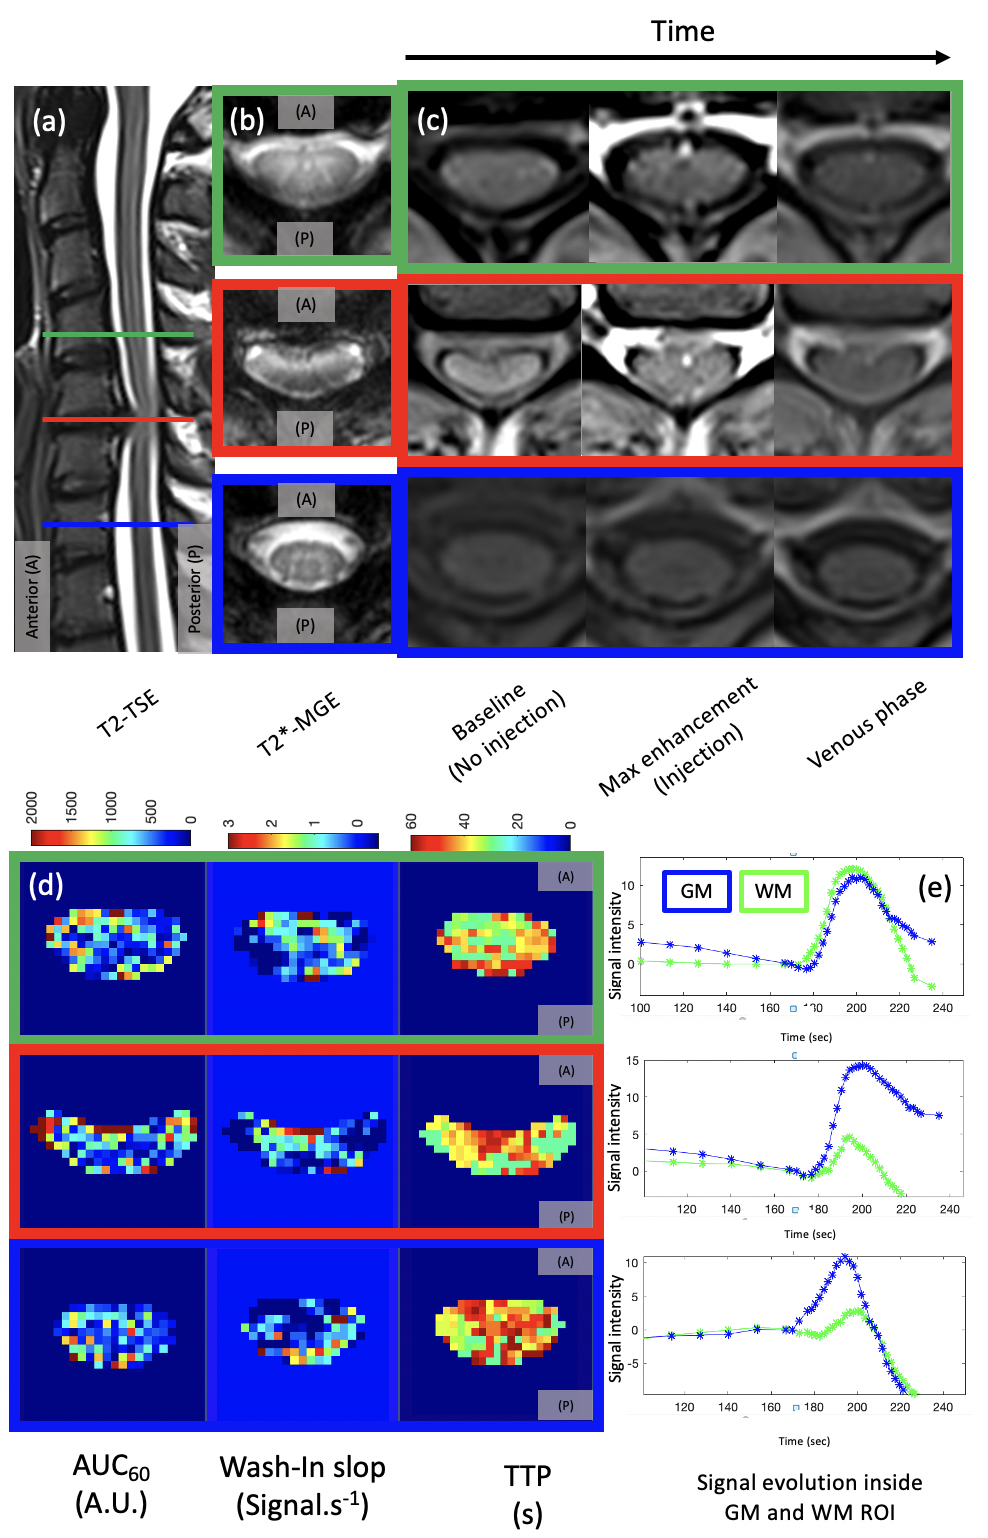
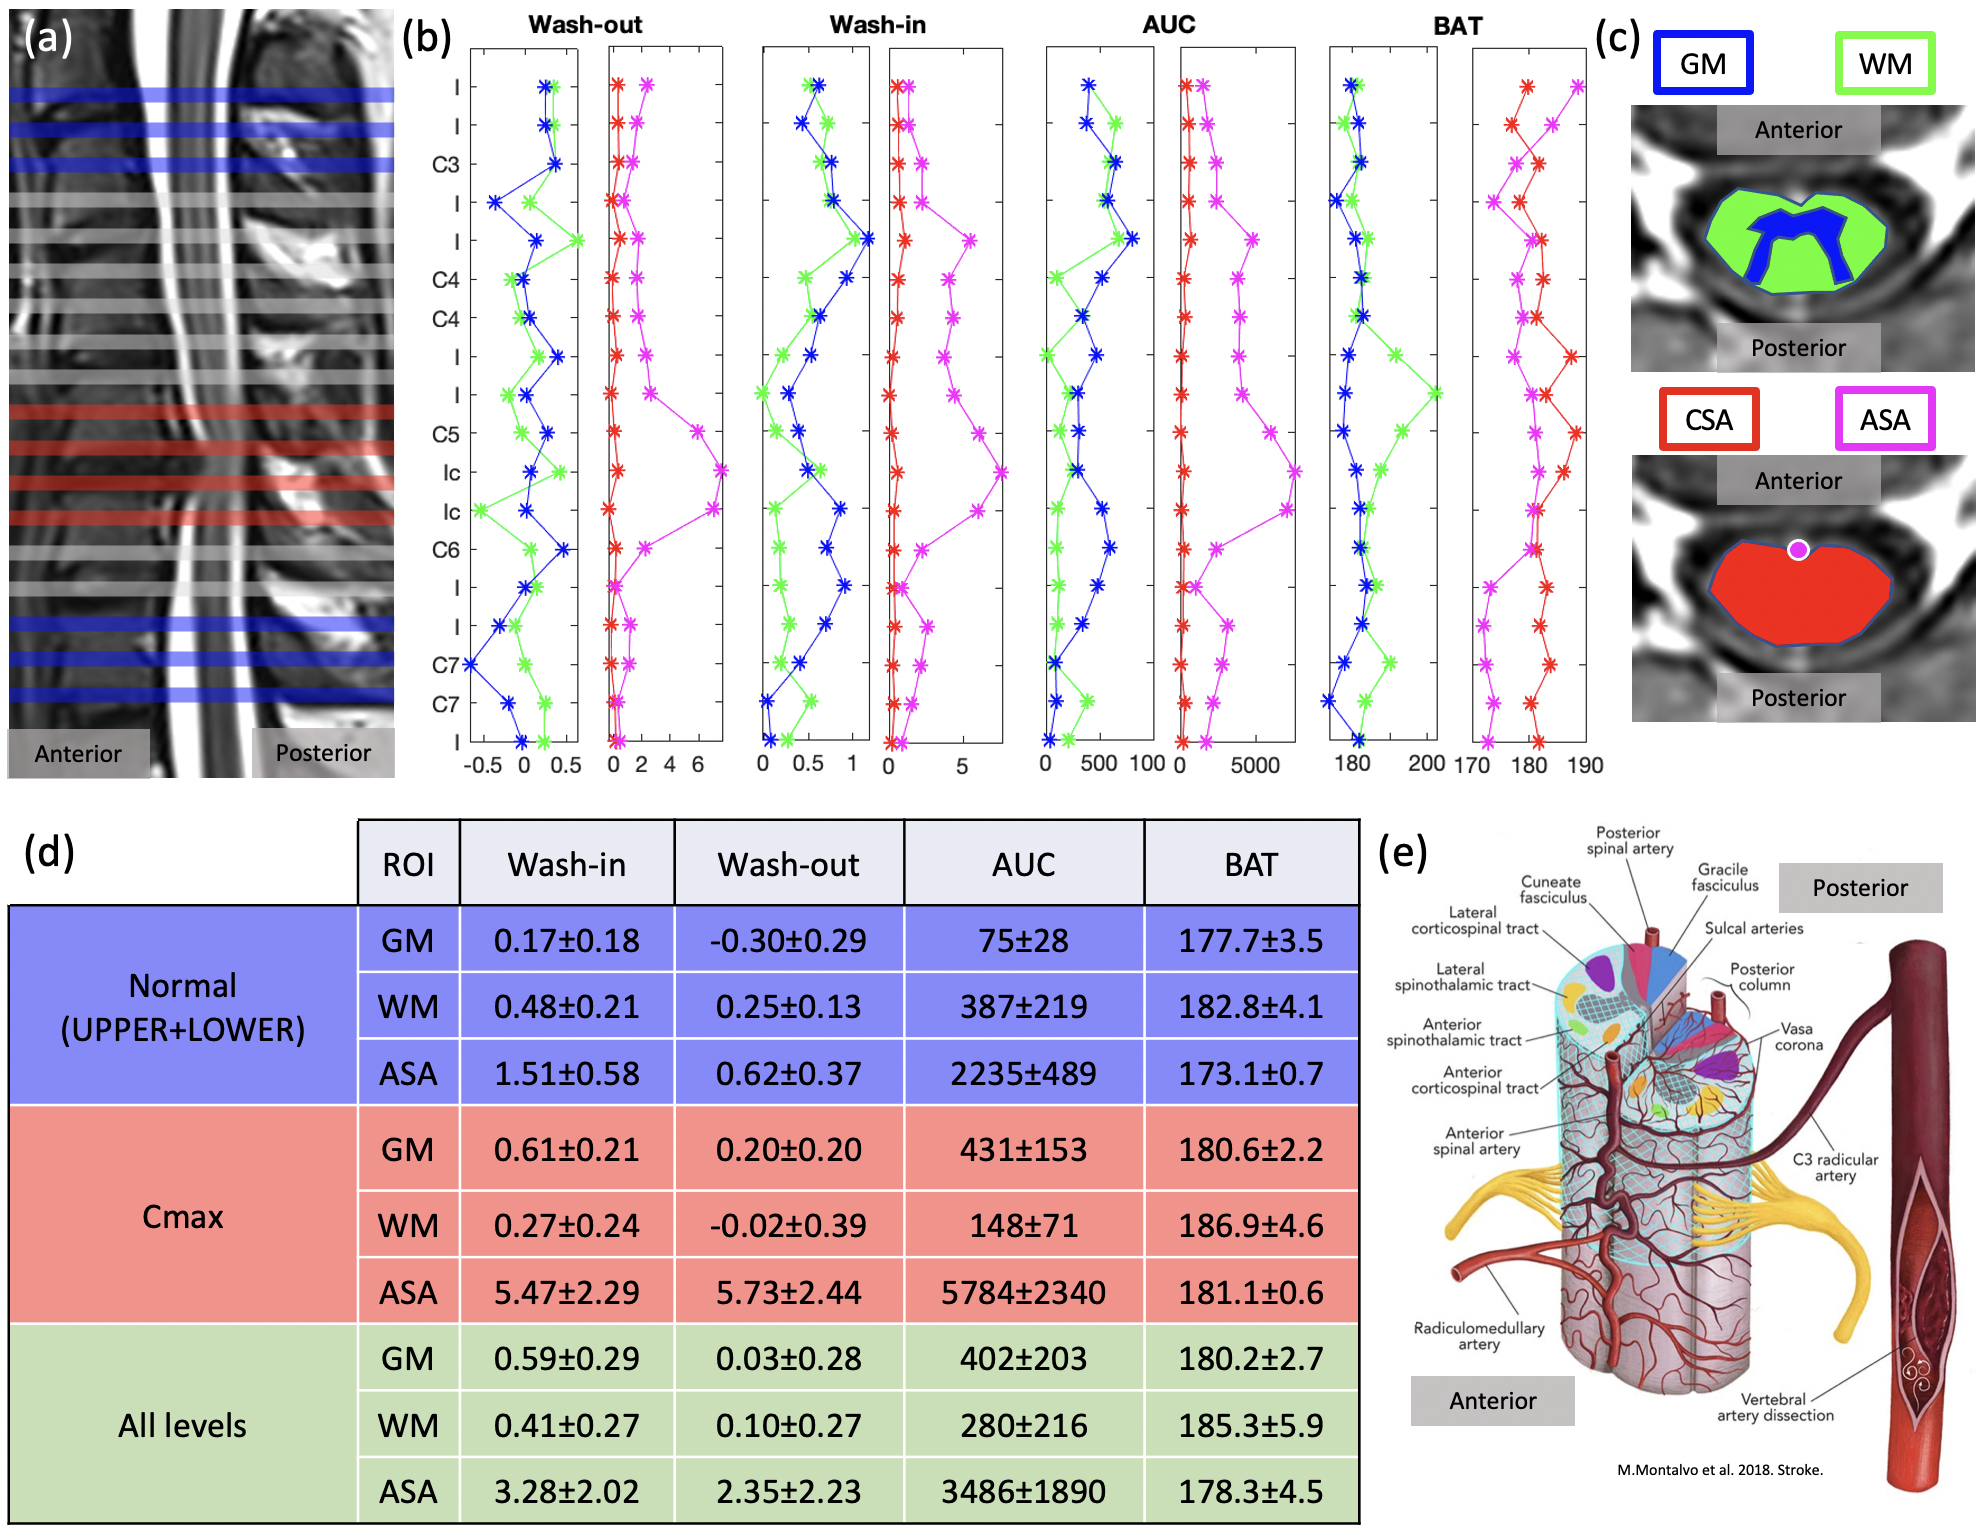
Semi-quantitative parameters (SQP) (Fig.2) from mean signal grey matter (GM) and white matter (WM) region of interest (ROI) and voxel-wise (see maps on Fig.3) were computed using a “custom” MATLAB code. SQP were also analyzed along the cervical levels, in 4 ROI (SC, WM, GM and small ROI containing Anterior Spinal Artery (pASA)), excluding the first and last slices (Fig.4).
Results & Discussion
From the optimization of the parameters, it was found that the signal stability was substantially improved with longer baseline, moving sliding time window and a high TR which enables a better sensitivity. Voxel-wise mapping was possible in addition to GM/WM in slice-wise analysis (Fig.3). However, it is yet too early to conclude on robustness and variation observed across slices due to the low SNR and the complex vascular network of the SC (Fig.4.e).Semi-quantitative analysis of ROIs provided promising results in the patient with myelopathy (Fig.4). Indeed, GM wash-in and AUC seems to have higher average values compared to WM at compressed levels (Cmax), but this requires further investigations and inclusions. The effect of the compressed levels between C5 and C6 can be seen on the SQP of the pASA showing higher Wash-in, AUC corresponding to a higher concentration of Gd, higher Wash-out corresponding to more accumulation in this level. BAT in pASA is below BAT off GM and WM as expected (all levels).
Conclusion
With the current set-up (coil design, MR methodology), the proposed DCE 3T MRI protocol and post-processing proposed enables slice-wise SQP mapping. High-resolution maps of relative perfusion indices were possible to compute but they did not always offer a clear distinction between GM and WM perfusion.DCE MRI at 3T showed great potential for perfusion evaluation along the cord and perfusion mapping within a clinical context, despite some challenges. Further investigation at higher field (7T) should provide higher spatial resolution, SNR (increased sensitivity), and potentially higher reproducibility as proven from 1.5T to 3T8,9 and from 3T to 7T10 in other organs.
Acknowledgements
This work has received funding from A*Midex.References
1. Schubert, M. Natural Course of Disease of Spinal Cord Injury. in Neurological Aspects of Spinal Cord Injury (eds. Weidner, N., Rupp, R. & Tansey, K. E.) 77–105 (Springer International Publishing, 2017). doi:10.1007/978-3-319-46293-6_4.
2. Neurological Aspects of Spinal Cord Injury. (Springer International Publishing, 2017). doi:10.1007/978-3-319-46293-6.
3. Beattie, M. S., Farooqui, A. A. & Bresnahan, J. C. Review of Current Evidence for Apoptosis After Spinal Cord Injury. Journal of Neurotrauma 17, 915–925 (2000).
4. Kalsi-Ryan, S., Karadimas, S. K. & Fehlings, M. G. Cervical Spondylotic Myelopathy: The Clinical Phenomenon and the Current Pathobiology of an Increasingly Prevalent and Devastating Disorder. Neuroscientist 19, 409–421 (2013).
5. Lévy, S., Roche, P., Guye, M. & Callot, V. Feasibility of human spinal cord perfusion mapping using dynamic susceptibility contrast imaging at 7T: Preliminary results and identified guidelines. Magn. Reson. Med. 85, 1183–1194 (2021).
6. Lévy, S. et al. Intravoxel Incoherent Motion at 7 Tesla to quantify human spinal cord perfusion: limitations and promises. Magn Reson Med 84, 1198–1217 (2020).
7. Petralia, G. et al. Dynamic contrast-enhanced MRI in oncology: how we do it. Radiol med 125, 1288–1300 (2020).
8. Pineda, F. D. et al. Comparison of dynamic contrast-enhanced MRI parameters of breast lesions at 1.5 and 3.0 T: a pilot study. BJR 88, 20150021 (2015).
9. Theisen, D. et al. Myocardial Perfusion Imaging With Gadobutrol: A Comparison Between 3 and 1.5 Tesla With an Identical Sequence Design: Investigative Radiology 42, 499–506 (2007).
10. Gruber, S. et al. Dynamic Contrast-Enhanced Magnetic Resonance Imaging of Breast Tumors at 3 and 7 T: A Comparison. Investigative Radiology 49, 354–362 (2014).
Figures