1456
Traumatic spinal cord injury – transition from a focal lesion to widespread neurodegeneration: Lessons from 60-month observational data1Spinal Cord Injury Center, Balgrist University Hospital Zurich, University of Zurich, Zurich, Switzerland, 2Queen Square Multiple Sclerosis Centre, Institute of Neurology, University College London, London, United Kingdom, 3Institute of Cognitive Neurology and Dementia Research, Otto-von-Guericke-University Magdeburg, Magdeburg, Germany, 4German Center for Neurodegenerative Diseases (DZNE), Bonn, Germany, 5Wellcome Centre for Human Neuroimaging, Queen Square Institute of Neurology, University College London, London, United Kingdom, 6Department of Neurophysics, Max Planck Institute for Human Cognitive and Brain Sciences, Leipzig, Germany, 7Department of Brain Repair and Rehabilitation,, Queen Square Institute of Neurology, University College London, London, United Kingdom
Synopsis
Traumatic spinal cord injury (SCI) triggers a cascade of neurodegenerative events across the neuroaxis. The trajectories of lesion characteristics and brain and spinal cord macro-and microstructural changes were analysed over five years in 23 SCI patients and 21 healthy controls. Initially, SCI patients showed higher volume and iron content in the spinal cord which decreased over time. They showed lower myelin-sensitive MTsat values in the dorsal column and cortex which also decreased over time and were associated with acute lesion characteristics. These observations illustrate the widespread and progressive neuroplastic processes after SCI, its magnitude being predicted by acute lesion characteristics.
INTRODUCTION
Traumatic spinal cord injury (SCI) is characterized by a sudden loss of sensorimotor and autonomous functions, mostly followed by incomplete recovery. The recovery process depends on the lesion extent at the focal injury site1–7 and on remote neurodegenerative changes8–12. However, the interplay between acute lesion characteristics and remote neurodegenerative changes is understudied. The current study identifies progressive macro-and microstructural changes in the brain and spinal cord (SC) detected by multimodal MRI over five years following SCI and investigates their relationship with the spatiotemporal evolution of the lesion.METHODS
We assessed quantitative MRI data from 23 SCI patients (table 1) and 21 controls at baseline (mean+/-standard deviation: 1·6+/-0·69 months), 3, 6, 12, 24, and 60 months post-SCI, acquired on 3T Magnetom Verio/Skyrafit (Siemens Healthineers, Erlangen, Germany) using a body transmit and a 16-channel receive head and neck coil. The scanning protocol included a 3D whole brain and cervical cord T1-weighted (T1w) MP-RAGE sequence for assessing macrostructural (i.e., volumetric) changes and a multiparametric mapping protocol (MPM)13–15 based on multi-echo 3D FLASH (fast low-angle shot) sequences, assessing microstructural alterations16–18 as described previously19. Lesion characteristics (width of midsagittal spared tissue bridges, lesion area, and cranio-caudal lesion length1,3–7,20) (figure 3A), were analysed on acute (3.3 +/- 5.9 days post-SCI) sagittal T2-weighted (T2w) turbo spin-echo sequence images (20 sagittal slices of 2.5mm thickness (+10% gap), in-plane resolution 0.57×0.57mm2, field of view 192×192mm2, repetition time 3.76s, echo time 87ms, flip angle 160°, acquisition time 1 minute). Lesion characteristics were manually segmented on the T2w midsagittal slice using Jim (version 7.0, Xinapse Systems)3.Linear mixed-effect models within R-studio21 were created to model the evolution of lesion characteristics. For tissue bridges, time was modelled on a natural logarithmic scale to incorporate non-linear properties while for lesion area and lesion length, a reciprocal (1/time) model was used to optimise fast-initial decline.
The hMRI toolbox15 was used to derive quantitative maps of magnetization transfer saturation (MTsat) and effective transverse relaxation rate (R2*). To account for radio-frequency transmit field inhomogeneities, UNICORT correction was applied22–24. Tensor-based morphometry in combination with the SPM-BSC method19 and the Sandwich Estimator Toolbox25 was used to analyse macro-and microstructural changes over time, corrected for sex and age. SPM12’s multiple linear regression models were used to assess relationships between lesion characteristics and micro-and macrostructural changes, adjusted for age, sex, neurological level of injury, and time between scans. Therefore, maps of Δchange were generated subtracting the Jacobians, MTsat, or R2* of the first scan from the last scan.
RESULTS
Initially, the SC volume was increased anterolaterally in SCI patients (figure 1A&B) in comparison to controls, accompanied by a ventral R2* increase (figure 1A&C) and a dorsal MTsat decrease (figure 1A&D). The corticospinal tract showed higher local white matter (WM) volume below the sensorimotor cortices in SCI patients (figure 1A&E). MTsat and grey matter (GM) volume were decreased in the primary sensory cortex (S1) of SCI patients (figure 1 A&F). A decreased baseline GM volume was found in the primary motor cortex (M1) and limbic system in SCI patients (figure 1A-H).Over 5 years, a linear decline in SC volume of SCI patients was found, accompanied by a greater MTsat decrease (figure 2A&B). These rates of change showed a greater levelling-off over 5 years in SCI patients compared to controls (figure 2A&B). Within the intracranial corticospinal tract, WM volume decreased more rapidly in SCI patients in comparison to controls (figure 2A.1&A.3). Further, in SCI patients, WM volume decreased in the cerebellar peduncles and the left pontine area, as also GM volume changes were found in the basal ganglia, cerebellum, and limbic system (figure 2A.1,4&5). MTsat decreased in the basal ganglia and several limbic areas in SCI patients (figure 2B.1-5).
Greater width of acute tissue bridges was associated with a smaller R2* increase in the corticospinal tract, cerebellum, basal ganglia, and M1&S1 (figure 3B). Faster demarcation of tissue bridges was associated with lower atrophy rates of the cervical SC and the superior and inferior cerebellar tracts, a lower MTsat decline in the left putamen, and a lower increase of R2* in the cerebellum (figure 3C). A faster reduction in lesion length was associated with a lower increase of R2* in M1 (figure 3C). For p-values and cluster sizes, see table 2.
DISCUSSION
This study characterizes the spatiotemporal evolution of the spinal cord lesion and progressive macro-and microstructural neurodegenerative changes in the remote SC and brain following SCI. Brain regions directly connected to the SC were atrophied in SCI patients when compared to controls. Crucially, these remote neurodegenerative changes could be predicted using acute lesion characteristics and their temporal evolution. Brain regions without direct connections to the SC, such as the hippocampus26,27, also showed signs of atrophy which, however, had no associations with acute lesion characteristics and might be caused by secondary pathomechanisms like inflammation28–31.CONCLUSION
In conclusion, these findings underline that neurodegenerative changes following SCI are progressive up to five years, are not restricted to the focal lesion site, and encompass both the remote SC and brain in a similar fashion. These changes and their associations with lesion characteristics provide valuable insights, which might open up new avenues to improve patient’s recovery prediction.Acknowledgements
The authors thank all participants who gave their time for this study, Dr. Katharina Wolf for recruiting patients, and the staff of the radiology department at University Hospital Balgrist, Switzerland.References
1 Vallotton K, Huber E, Sutter R, Curt A, Hupp M, Freund P. Width and neurophysiologic properties of tissue bridges predict recovery after cervical injury. Neurology 2019; 92. DOI:10.1212/WNL.0000000000007642.
2 Huber E, David G, Thompson AJ, Weiskopf N, Mohammadi S, Freund P. Dorsal and ventral horn atrophy is associated with clinical outcome after spinal cord injury. Neurology 2018; 90: e1510–22.
3 Pfyffer D, Huber E, Sutter R, Curt A, Freund P. Tissue bridges predict recovery after traumatic and ischemic thoracic spinal cord injury. Neurology 2019; 93. DOI:10.1212/WNL.0000000000008318.
4 Pfyffer D, Vallotton K, Curt A, Freund P. Tissue bridges predict neuropathic pain emergence after spinal cord injury. J Neurol Neurosurg Psychiatry 2020; 91: 1111–7.
5 Pfyffer D, Vallotton K, Curt A, Freund P. Predictive Value of Midsagittal Tissue Bridges on Functional Recovery After Spinal Cord Injury. Neurorehabil Neural Repair 2021; 35: 33–43.
6 Berliner JC, O’Dell DR, Albin SR, et al. The influence of conventional T 2 MRI indices in predicting who will walk outside one year after spinal cord injury. J Spinal Cord Med 2021; 0: 1–7.
7 O’Dell DR, Weber KA, Berliner JC, et al. Midsagittal tissue bridges are associated with walking ability in incomplete spinal cord injury: A magnetic resonance imaging case series. J Spinal Cord Med 2020; 43: 268–71.
8 Seif M, Ziegler G, Freund P. Progressive Ventricles Enlargement and Cerebrospinal Fluid Volume Increases as a Marker of Neurodegeneration in Patients with Spinal Cord Injury: A Longitudinal Magnetic Resonance Imaging Study. J Neurotrauma 2018; 35: 2941–6.
9 Freund P, Weiskopf N, Ashburner J, et al. MRI investigation of the sensorimotor cortex and the corticospinal tract after acute spinal cord injury: a prospective longitudinal study. Lancet Neurol 2013; 12: 873–81.
10 Grabher P, Callaghan MF, Ashburner J, et al. Tracking sensory system atrophy and outcome prediction in spinal cord injury. Ann Neurol 2015; 78: 751–61.
11 Ziegler G, Grabher P, Thompson A, et al. Progressive neurodegeneration following spinal cord injury. Neurology2018; 90: e1257–66.
12 Seif M, Curt A, Thompson AJ, Grabher P, Weiskopf N, Freund P. Quantitative MRI of rostral spinal cord and brain regions is predictive of functional recovery in acute spinal cord injury. NeuroImage Clin 2018; 20: 556–63.
13 Leutritz T, Seif M, Helms G, et al. Multiparameter mapping of relaxation (R1, R2*), proton density and magnetization transfer saturation at 3 T: A multicenter dual-vendor reproducibility and repeatability study. Hum Brain Mapp 2020; 41: 4232–47.
14 Callaghan MF, Lutti A, Ashburner J, et al. Example dataset for the hMRI toolbox. Data Br 2019; 25: 104132.
15 Tabelow K, Balteau E, Ashburner J, et al. hMRI – A toolbox for quantitative MRI in neuroscience and clinical research. Neuroimage 2019; 194: 191–210.
16 Georgiadis M, Schroeter A, Gao Z, et al. Nanostructure-specific X-ray tomography reveals myelin levels, integrity and axon orientations in mouse and human nervous tissue. Nat Commun 2021; 12: 2941.
17 Schmierer K, Scaravilli F, Altmann DR, Barker GJ, Miller DH. Magnetization transfer ratio and myelin in postmortem multiple sclerosis brain. Ann Neurol 2004; 56: 407–15.
18 Langkammer C, Krebs N, Goessler W, et al. Quantitative MR Imaging of Brain Iron: A Postmortem Validation Study. Radiology 2010; 257: 455–62.
19 Azzarito M, Kyathanahally SP, Balbastre Y, et al. Simultaneous voxel-wise analysis of brain and spinal cord morphometry and microstructure within the SPM framework. Hum Brain Mapp 2020; : 220–32.
20 Huber E, Lachappelle P, Sutter R, Curt A, Freund P. Are midsagittal tissue bridges predictive of outcome after cervical spinal cord injury? Ann Neurol 2017; 81: 740–8.
21 RStudio Team. RStudio: Integrated Development Environment for R. 2018. http://www.rstudio.com/.
22 Emmenegger TM, David G, Ashtarayeh M, et al. The Influence of Radio-Frequency Transmit Field Inhomogeneities on the Accuracy of G-ratio Weighted Imaging. Front Neurosci 2021; 15: 1–17.
23 Weiskopf N, Lutti A, Helms G, Novak M, Ashburner J, Hutton C. Unified segmentation based correction of R1 brain maps for RF transmit fi eld inhomogeneities (UNICORT). Neuroimage 2011; 54: 2116–24.
24 Helms, G, Weiskopf, N, Lutti A. Correction of FLASH-based MT saturation in human brain for residual bias of B1-inhomogeneity at 3T. In: ISMRM. Toronto, 2015: 1–14.
25 Guillaume B, Hua X, Thompson PM, Waldorp L, Nichols TE, Alzheimer’s Disease Neuroimaging Initiative. Fast and accurate modelling of longitudinal and repeated measures neuroimaging data. Neuroimage 2014; 94: 287–302.
26 Çavdar S, Onat FY, Çakmak YÖ, Yananli HR, Gülçebi M, Aker R. The pathways connecting the hippocampal formation, the thalamic reuniens nucleus and the thalamic reticular nucleus in the rat. J Anat 2008; 212: 249–56.
27 Aggleton JP, O’Mara SM, Vann SD, Wright NF, Tsanov M, Erichsen JT. Hippocampal-anterior thalamic pathways for memory: uncovering a network of direct and indirect actions. Eur J Neurosci 2010; 31: 2292–307.
28 Wu J, Zhao Z, Sabirzhanov B, et al. Spinal Cord Injury Causes Brain Inflammation Associated with Cognitive and Affective Changes: Role of Cell Cycle Pathways. J Neurosci 2014; 34: 10989–1006.
29 Felix M-S, Popa N, Djelloul M, et al. Alteration of Forebrain Neurogenesis after Cervical Spinal Cord Injury in the Adult Rat. Front Neurosci 2012; 6: 848–61.
30 Das S, Basu A. Inflammation: A new candidate in modulating adult neurogenesis. J Neurosci Res 2008; 86: 1199–208.
31 Whitney NP, Eidem TM, Peng H, Huang Y, Zheng JC. Inflammation mediates varying effects in neurogenesis: relevance to the pathogenesis of brain injury and neurodegenerative disorders. J Neurochem 2009; 108: 1343–59.
Figures
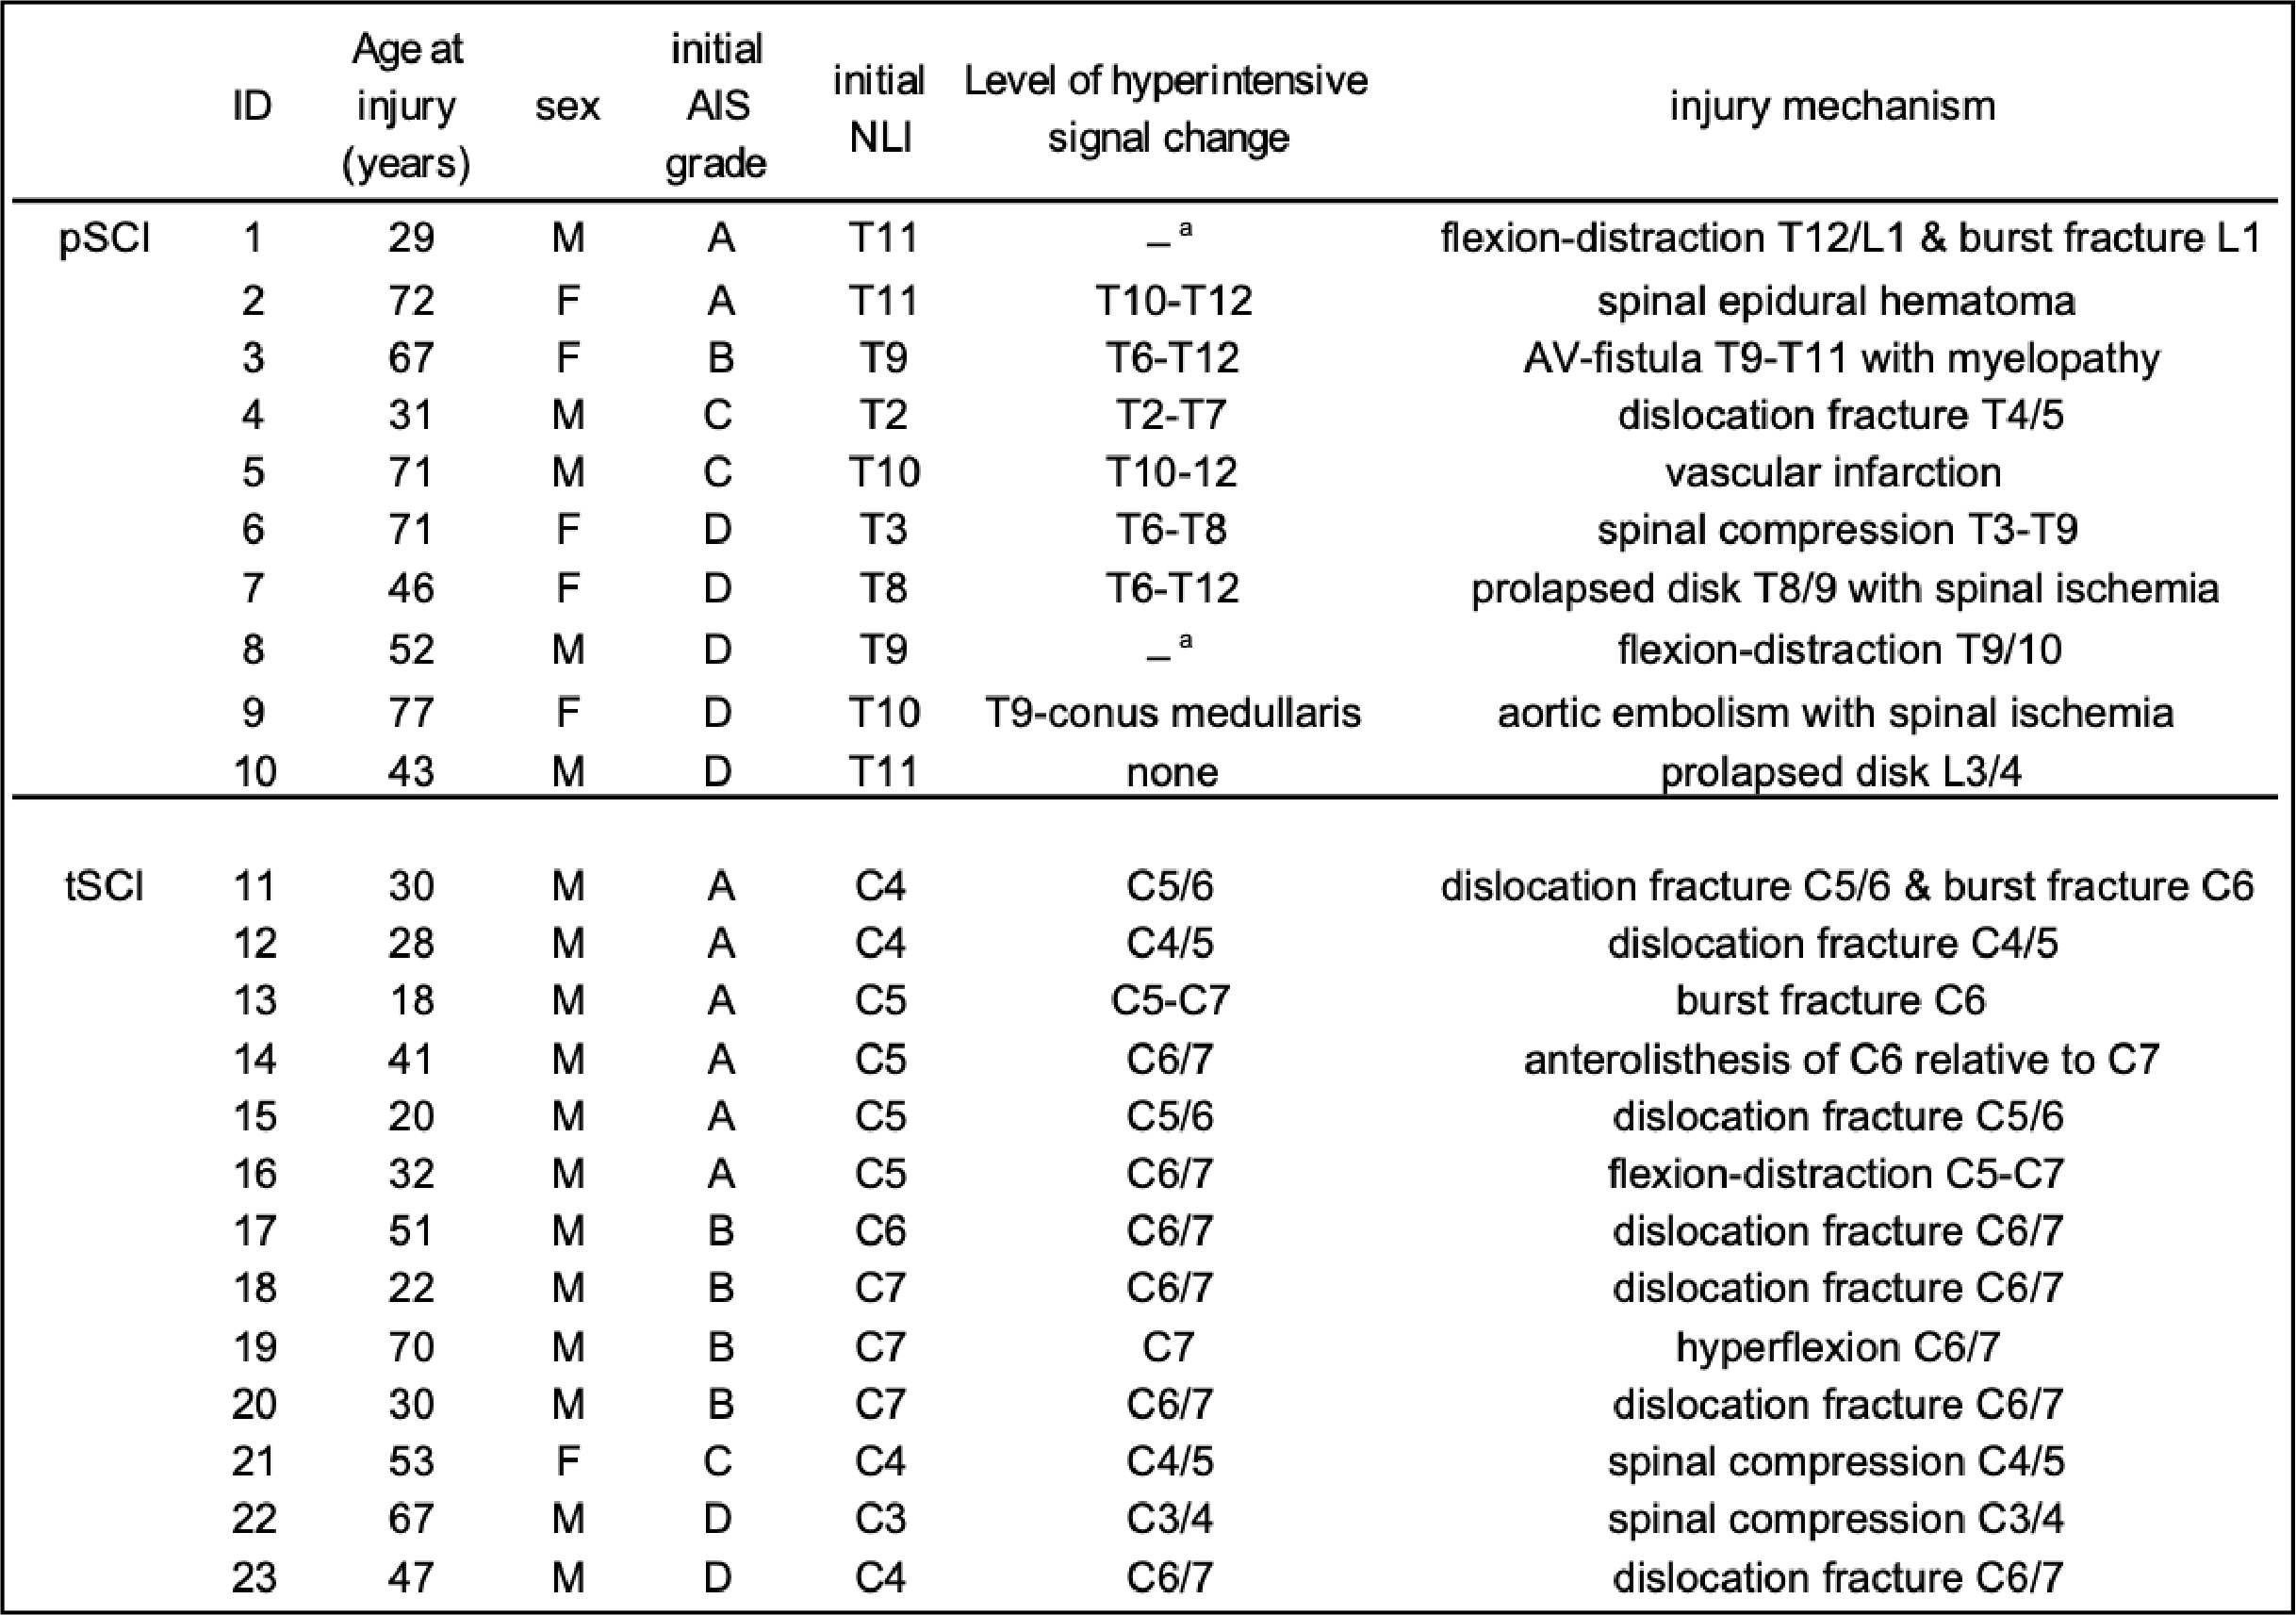
Table 1: Patient demographics
a: spinal cord cannot be assessed at the level of injury due to artefacts caused by metal implant AIS=ASIA Impairment Scale, NLI=neurological level of injury, pSCI= paraplegic spinal cord injury patients, tSCI=tetraplegic spinal cord injury patients, C=cervical level, T=thoracic level, L= lumbar level, M=male, F=female
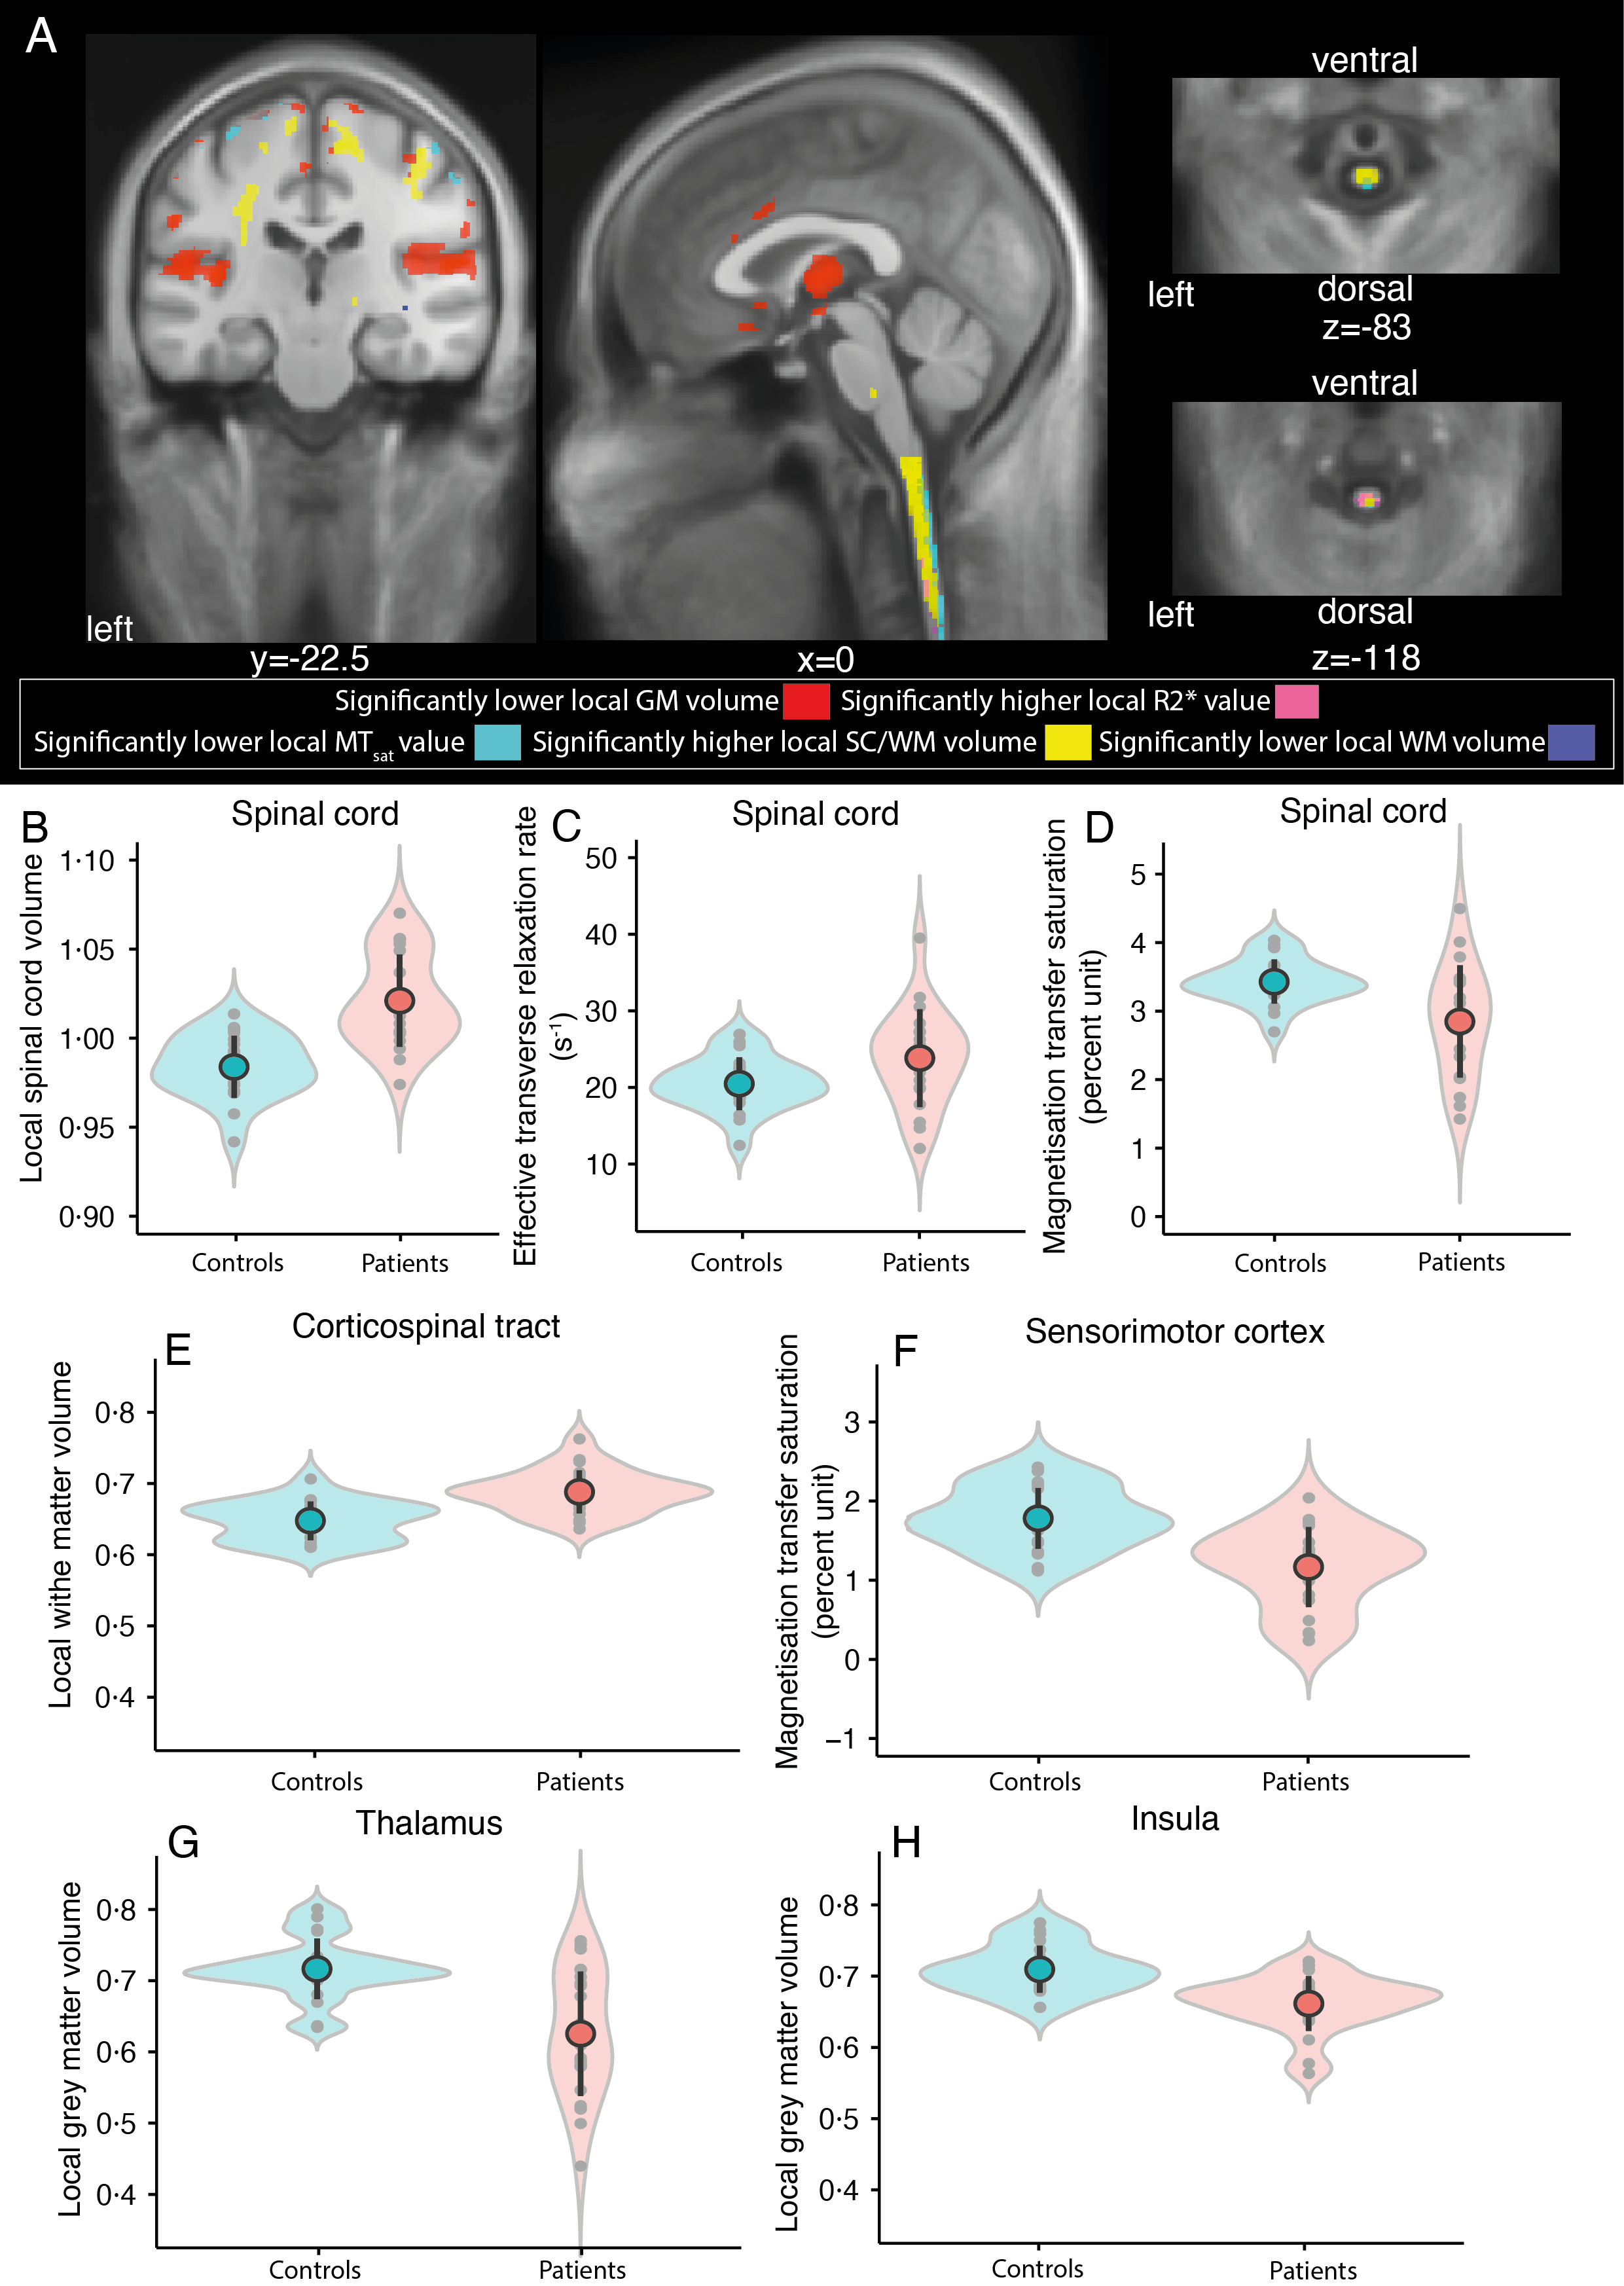
Figure1: Baseline brain and spinal cord differences
(A) Overlay of statistical parametric maps (uncorrected p < 0·005), showing macro-and microstructural changes in SCI patients compared to controls at baseline. Significant lower GM volume in red, significant higher R2* in magenta, significant lower MTsat values in cyan, significant higher SC or WM volume in yellow, and its decrease in blue. For illustrative purposes the peek voxel at baseline is shown for (B-D) SC, (E) corticospinal tract, (F) sensorimotor cortex (G) thalamus, and (H) insula. Controls in blue, SCI patients in red.
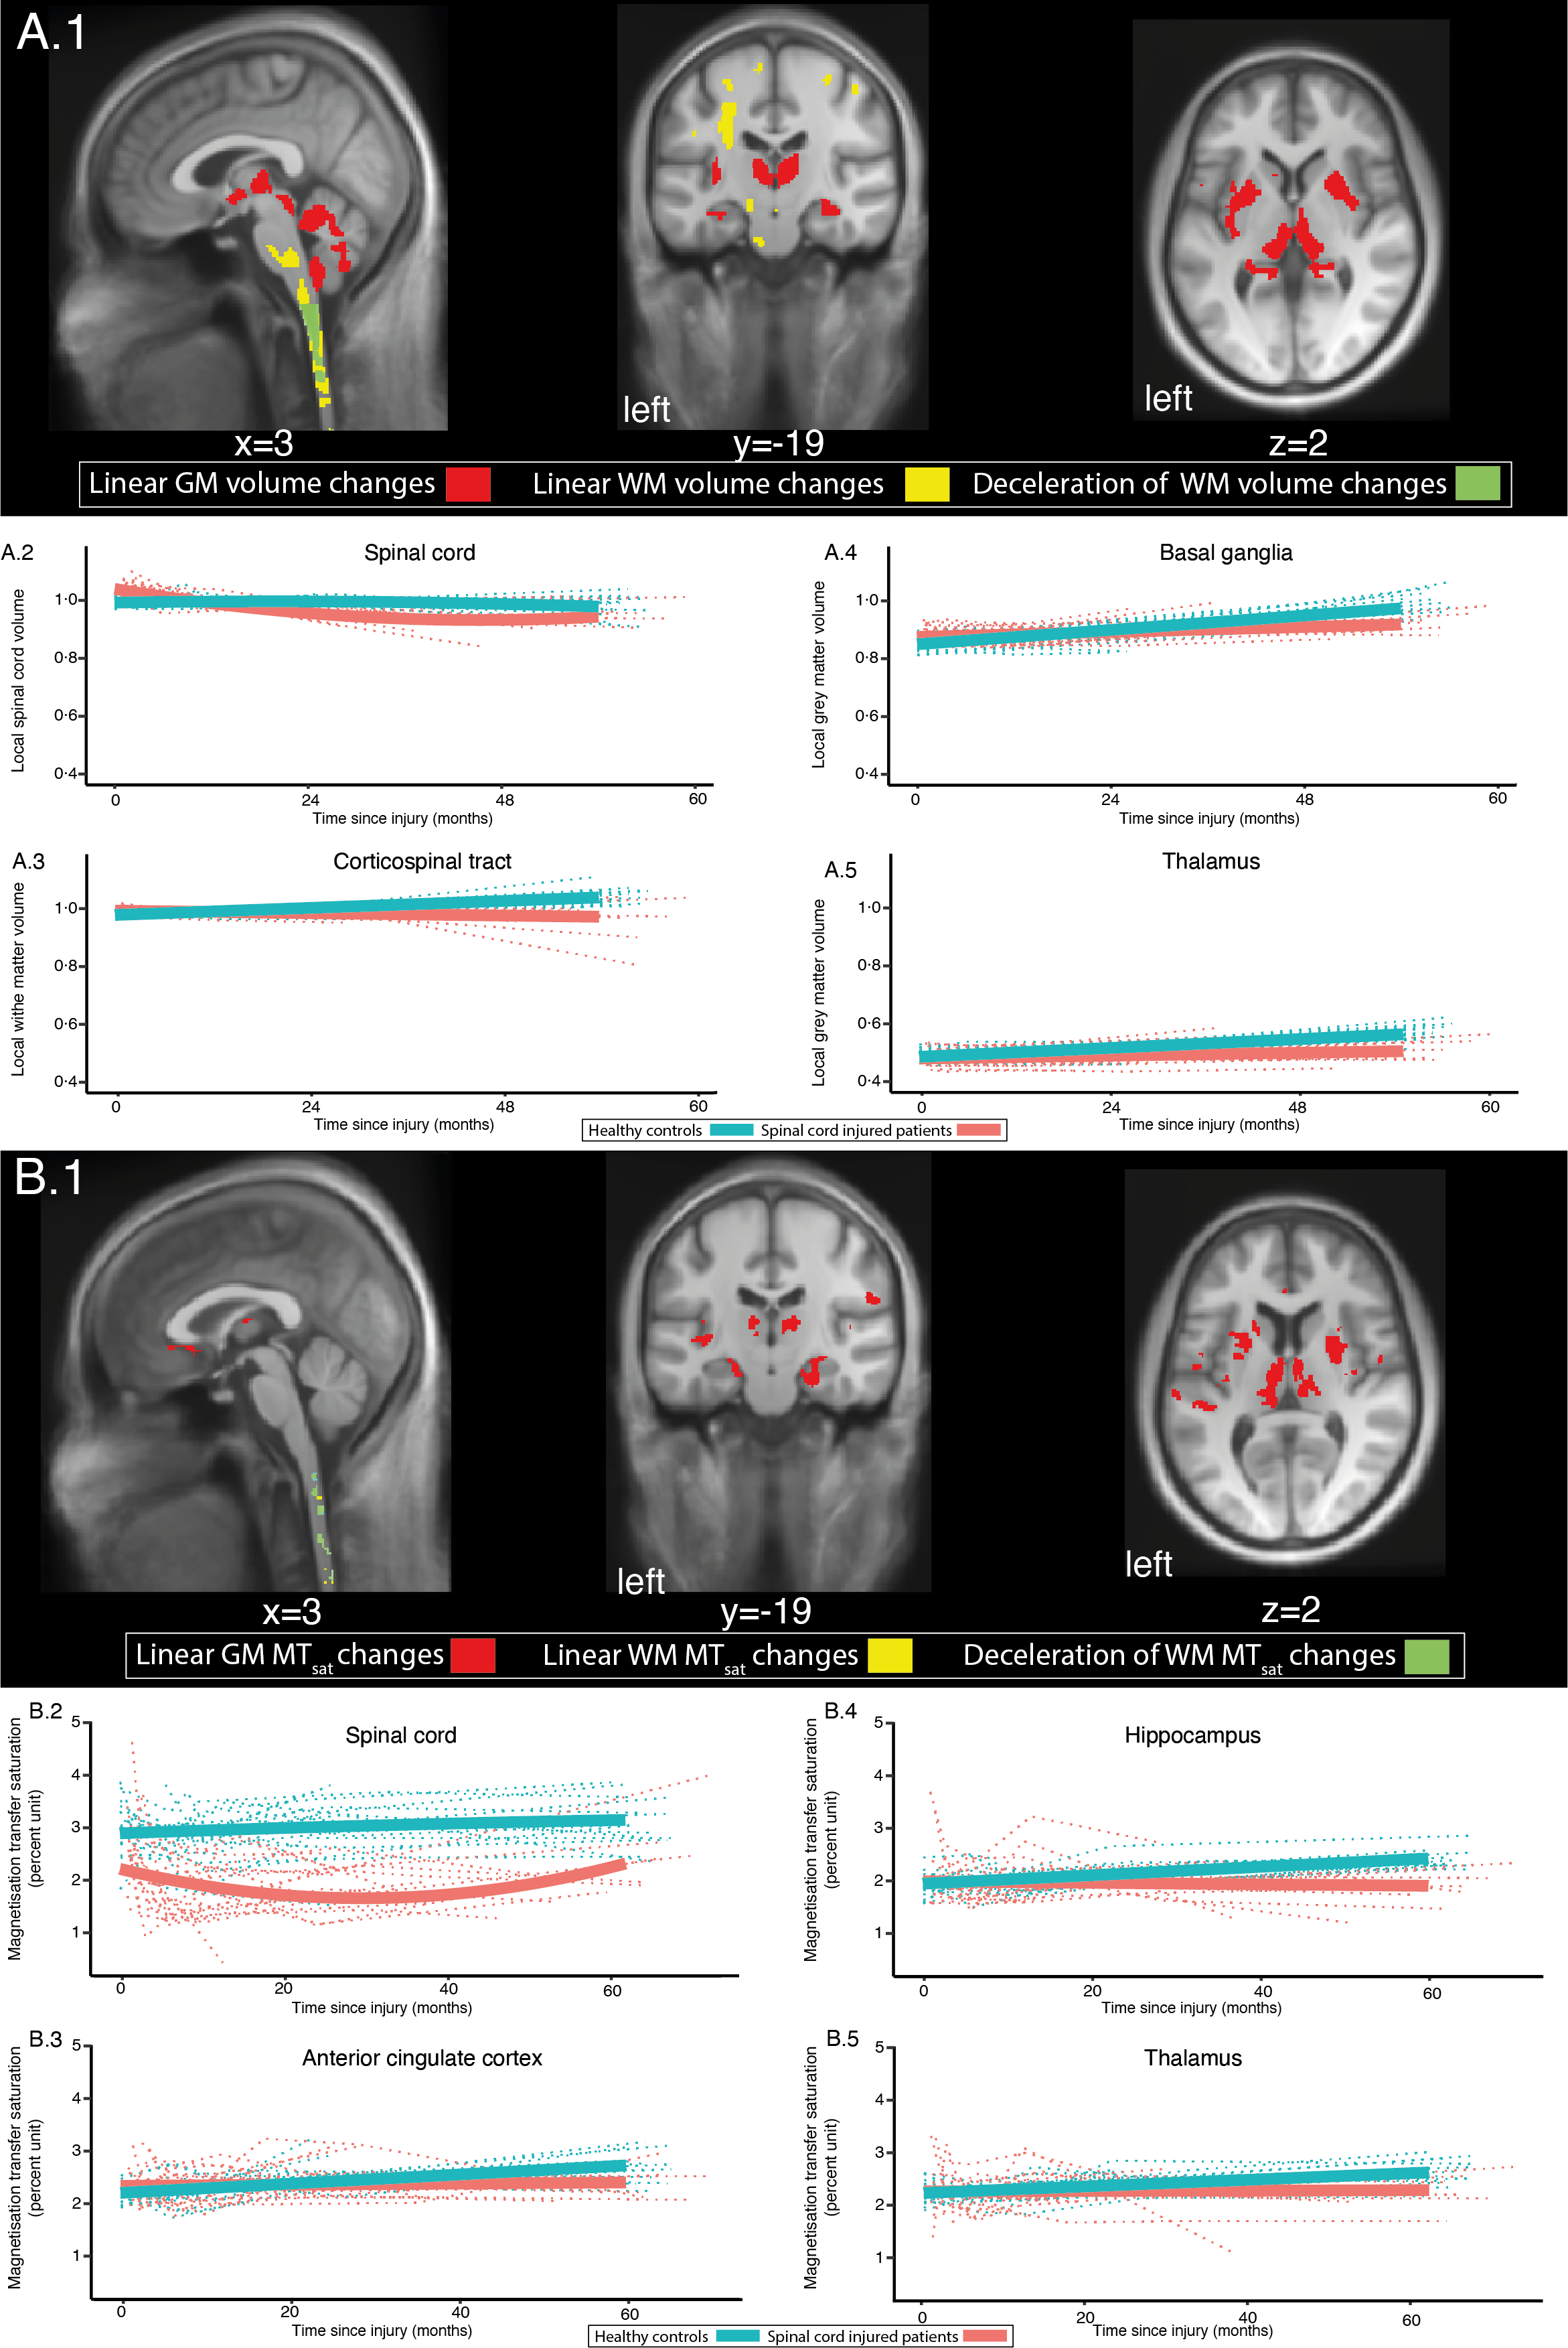
Figure 2: Longitudinal brain and spinal cord changes
Overlay of statistical parametric maps (uncorrected p<0·005), of longitudinal changes (A&B: in WM yellow, in GM red, deceleration in WM changes in green). Macrostructural changes are illustrated for SC, corticospinal tract, basal ganglia, and thalamus (A2-5). Microstructural changes are illustrated for SC, anterior cingulate cortex, hippocampus, thalamus (B.2-5). In red changes for patients and in blue for controls. The bold solid line depicts the fitted model. The dotted lines represent the raw individual trajectories.
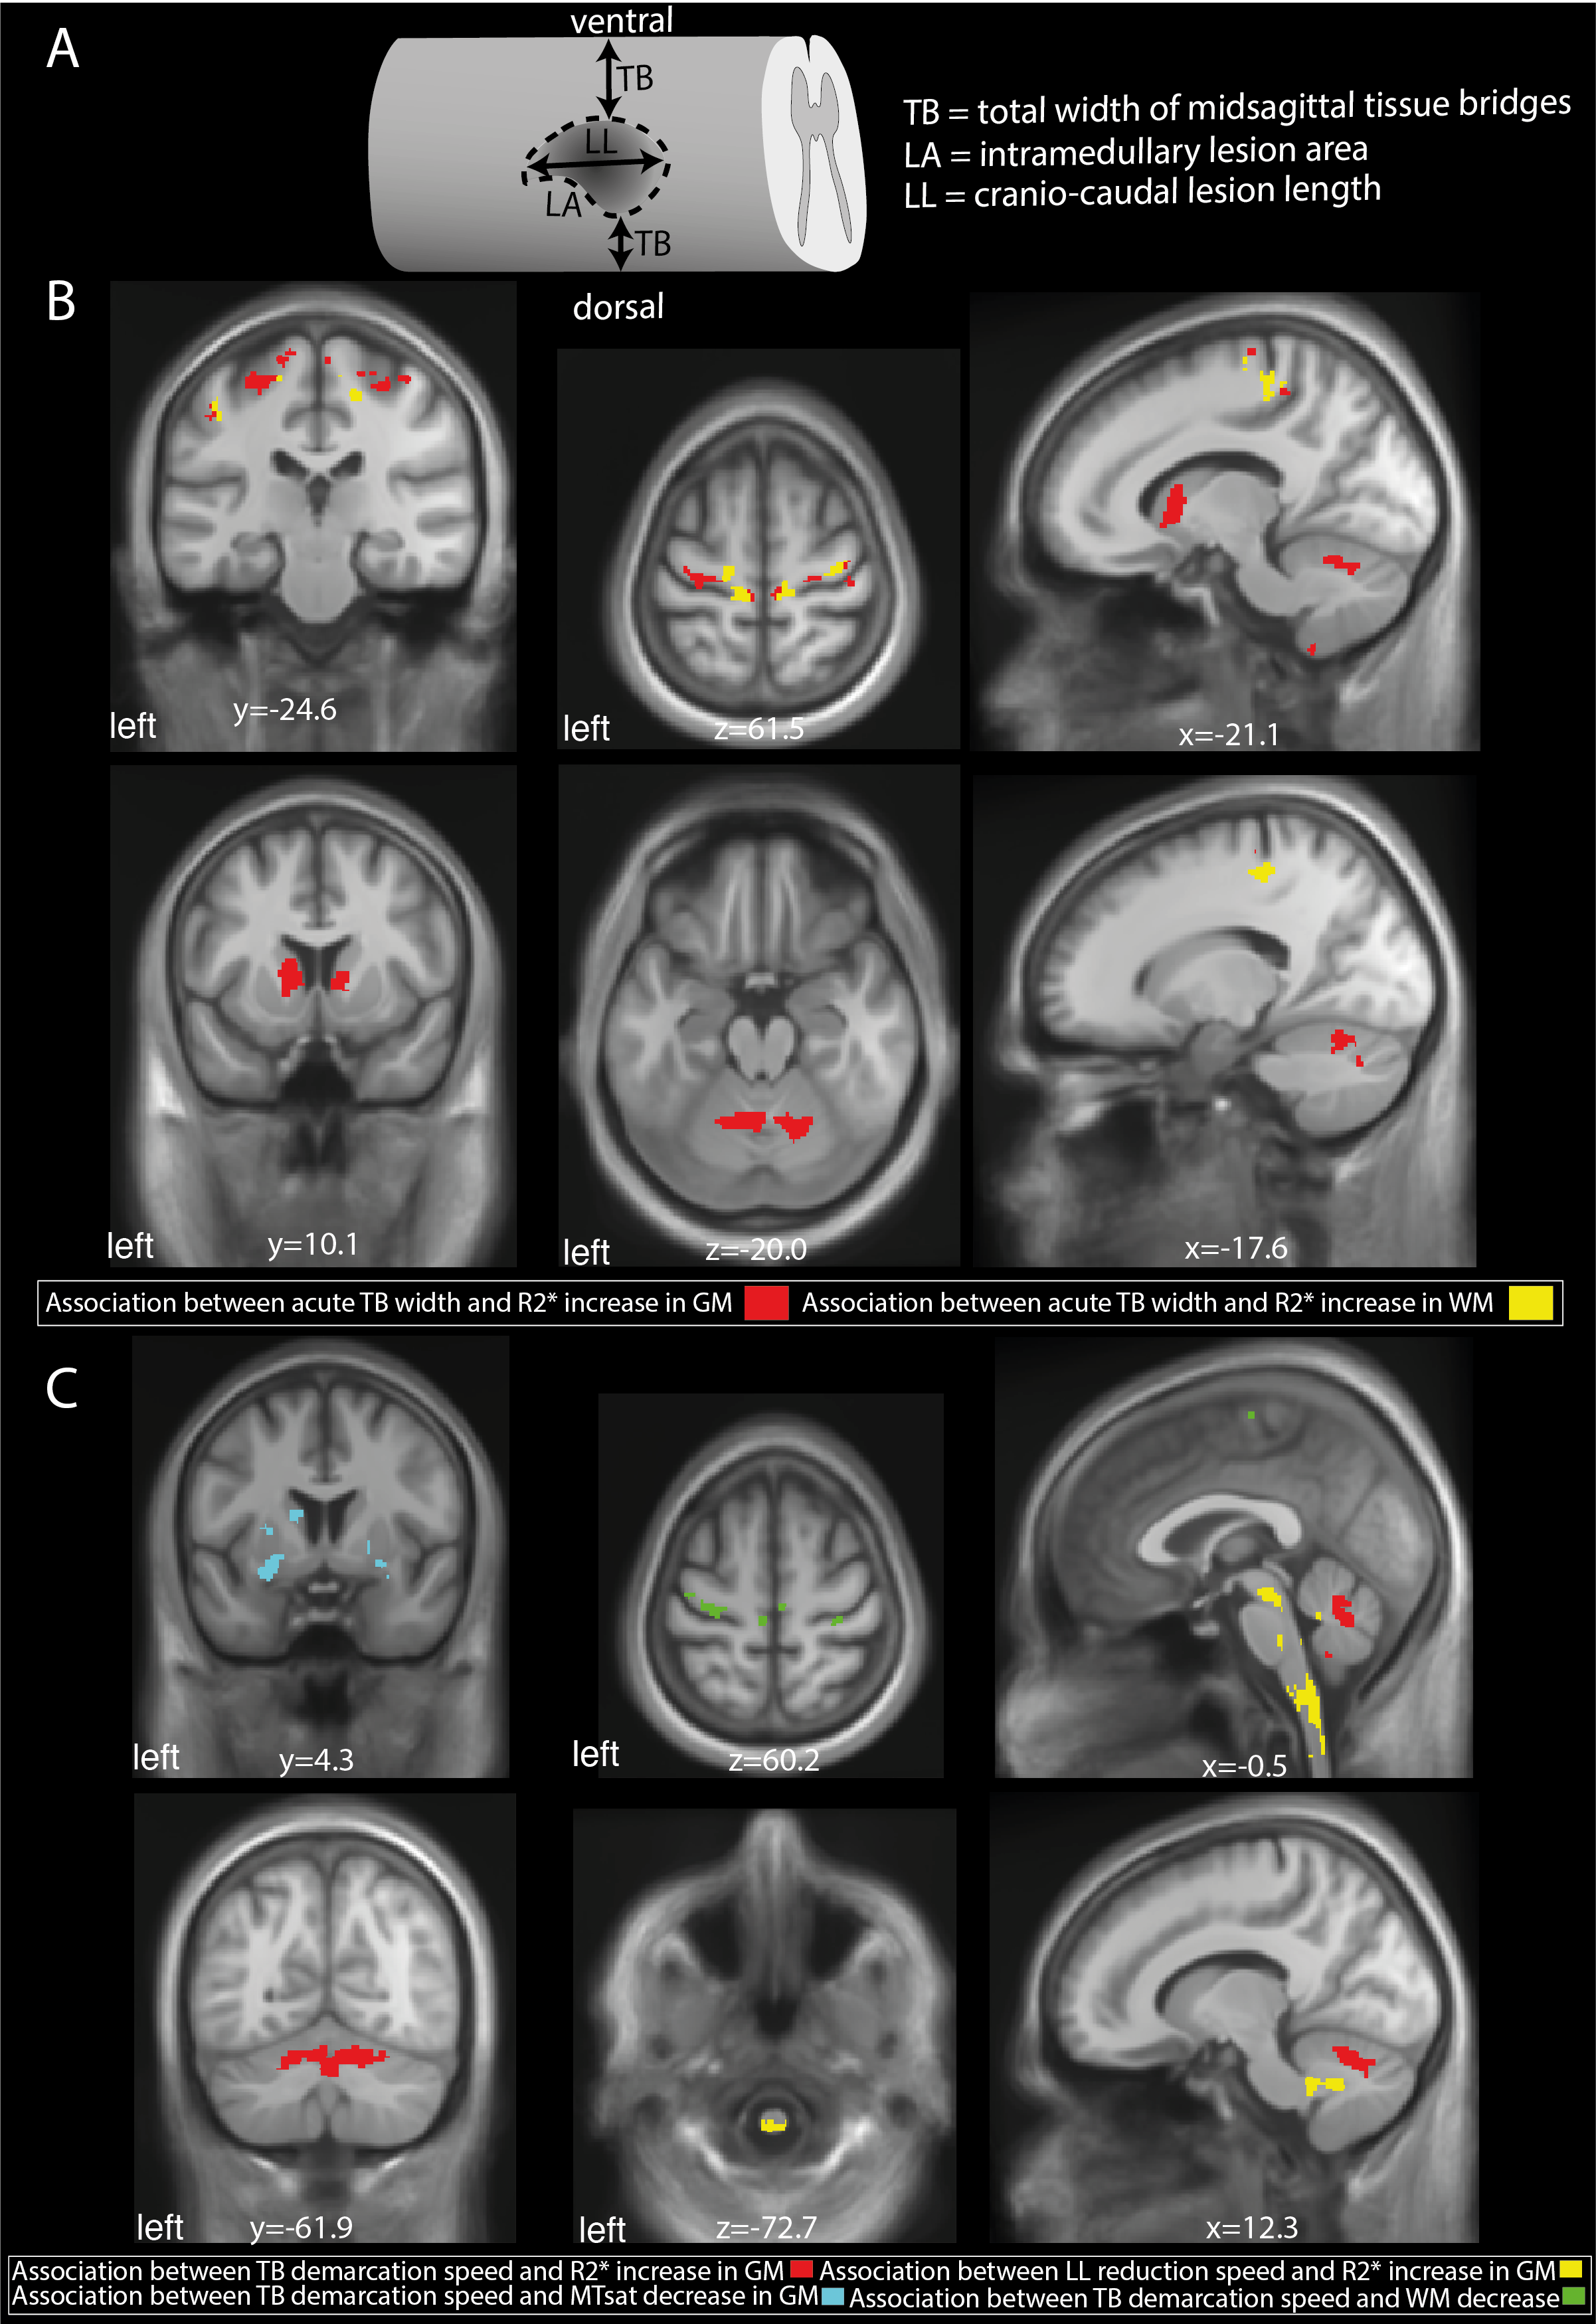
Figure 3: The association between lesion evolution and neurodegeneration
(A) Schematic lesion segmentation representing the lesion characteristics included width of midsagittal spared tissue bridges (TB), lesion area (LA), and cranio-caudal lesion length (LL) Overlay of statistical parametric maps (uncorrected p<0·005), assassinations between macro-and microstructural changes and acute lesion characteristics (B) and their temporal evolution (C).
Table 2: Significant clusters of voxel-wise analysis
FDR corrected = false discovery rate on cluster level, FWE corrected = Family-wise error corrected on cluster level. TB = width of midsagittal spared tissue bridges, LL= cranio-caudal lesion length