1455
Lumbosacral spinal cord changes after acute spinal cord injury: preliminary results of an MRI study1Department of Neuro-Urology, Balgrist University Hospital, University of Zürich, Zürich, Switzerland, 2Spinal Cord Injury Center, Balgrist University Hospital, University of Zürich, Zürich, Switzerland
Synopsis
Imaging of the lumbosacral enlargement (LSE) has previously demonstrated remote degeneration below a cervical spinal cord injury leading to progressive atrophy of grey and white matter. Here, we investigate, for the first time, neurodegeneration in the conus medullaris (including the LSE) after acute spinal cord injury using an optimized multi-echo gradient-echo sequence. At 1-month after injury, preliminary results show lower grey matter volume in the conus medullaris. This is the first MRI investigation indicating remote tissue-specific volumetric changes in the conus medullaris in spinal cord injury.
Introduction
Damage to the spinal cord (SC) caused by traumatic or non-traumatic injury, often leads to loss of motor and sensory function as well as impairment of bladder, sexual and bowel function1,2. Besides the focal damage at the injury site, SC injury (SCI) also triggers a cascade of secondary pathological processes which have been shown to result in tissue loss (i.e. atrophy) above and below the injury3. Atrophy of the SC can be quantified in vivo by measuring cross-sectional area (CSA) of the SC, grey matter (GM) and white matter (WM) in axial images of the SC acquired by magnetic resonance imaging (MRI)4.The lumbosacral cord is relevant for the functioning of the lower limbs and lower urinary tract5. The feasibility of grey and white matter segmentation has been demonstrated in the lumbosacral enlargement (LSE) and conus medullaris (CM) in healthy volunteers6. In patient populations, evidence of remote atrophy at the LSE has been shown in degenerative cervical myelopathy patients7 and after traumatic SCI, both in subacute (2 months post-SCI)8 and in the chronic stage (>1 year post-SCI)9. Neuropathological evidence suggests that early tissue loss may also occur below the level of the LSE10, however quantitative MRI studies are lacking.
The aim of this preliminary study was to investigate volumetric differences in the LSE and CM between acute SCI patients (1-month after injury) and healthy controls.
Methods
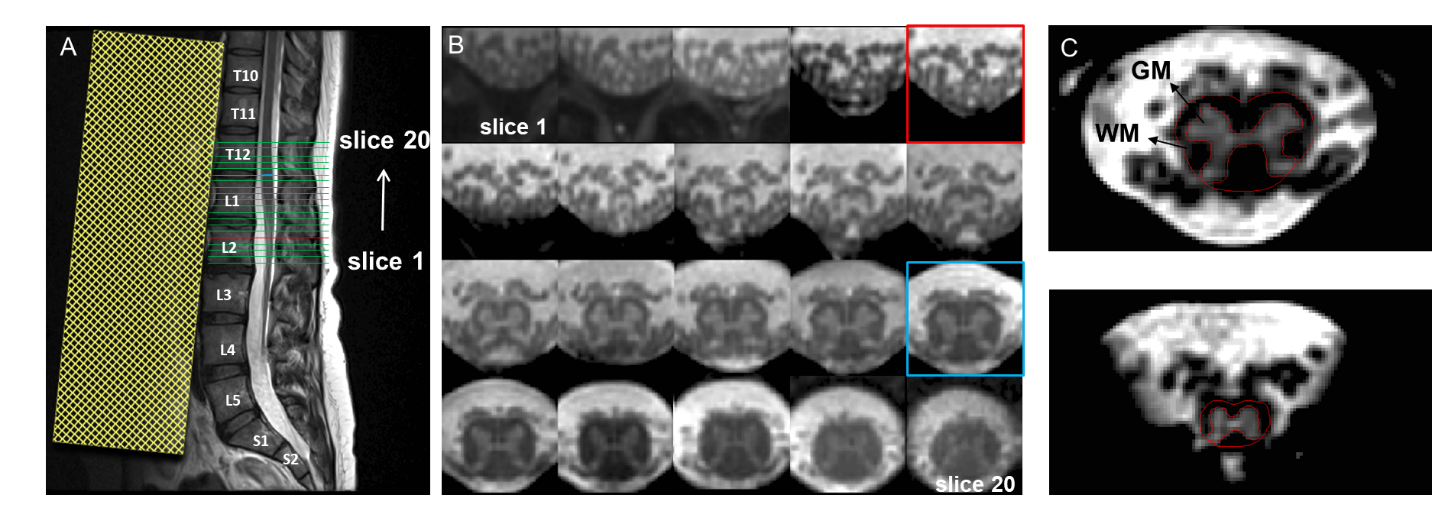
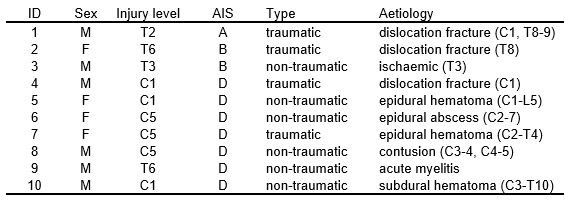
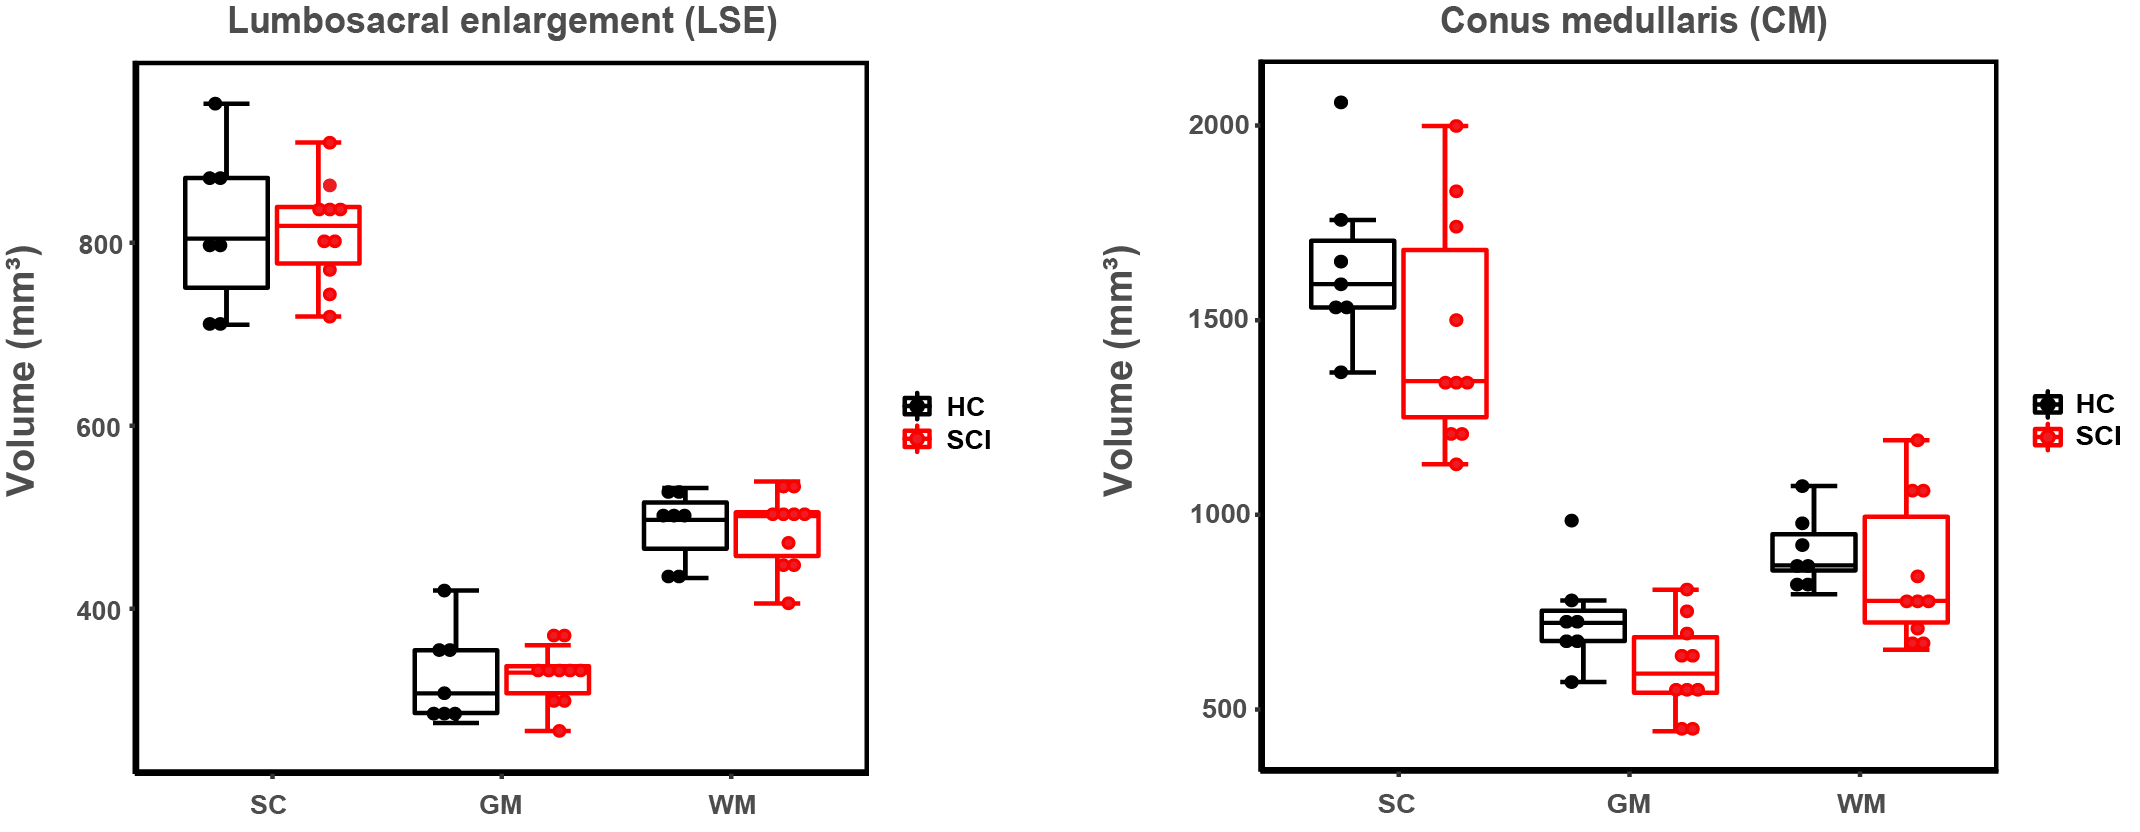
Ten SCI patients (4 females, mean (±SD) age 56.0 ± 18.6 years) and 7 healthy controls (4 females, mean (±SD) age 31.7 ± 12.0 years) underwent MRI of the lumbosacral cord on a 3T Siemens Prisma using a spoiled 3D multi-echo gradient-echo sequence (Siemens FLASH). The mean (±SD) interval to the MRI scan following injury was 34.3 (±4.2) days. Detailed characteristics of SCI patients are listed in Table 1. The 20 axial-oblique slices with 5 mm thickness (no gap) were set individually based on a sagittal T2-weighted image to encompass the LSE and CM (Figure 1A-B). Sequence parameters were: in-plane resolution 0.5x0.5 mm2, field of view 192x192 mm2, repetition time 38 ms, echo train length 5, first echo time 6.85 ms, echo spacing 4 ms, flip angle 8°, 8 repetitions, GRAPPA 2x, no partial Fourier, bandwidth 260 Hz/pixel, acquisition time 17:56 min. For each slice, SC and GM were segmented manually using the sub-voxel segmentation tool in JIM 7.0 (Xinapse systems), providing CSA values of the SC and GM (Figure 1C). Segmentation was performed blinded and in randomized order across healthy controls and patients. White matter CSA was obtained by subtracting GM from SC. The slice with the highest SC CSA was defined as the “LSE slice”. Tissue-specific total volume (TV) measures were calculated at the LSE (LSE-TV, LSE-GM-TV, LSE-WM-TV) for a 15mm long segment of 3 adjacent slices around the "LSE slice". TV measures at the CM (CM-TV, CM-GM-TV, CM-WM-TV) were calculated from a variable number of slices (from the "LSE slice" down to the tip of CM). T12 vertebra posterior height (T12 PH) and cord length (LSE to the CM tip, Length LSE CMtip) were obtained from the T2-weighted image (Fig 1A). Volumetric metrics were compared between SCI patients and healthy controls using a two-sample t-test (unpaired, one tailed, p<0.05).Results
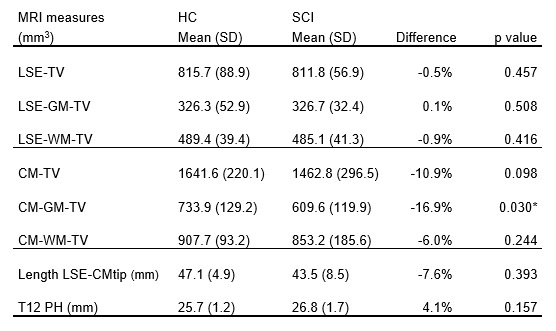
Preliminary results of this study are visualized in Figure 2 and summarized in Table 2. Analysis of the CM showed significant lower values in total grey matter volume (CM-GM-TV) in acute SCI patients compared to healthy controls (-16.9%, p = 0.030). Although not statistically significant, lower total volume (CM-TV, -10.9%) and total white matter volume (CM-WM-TV, -6.0%) were also observed. At the LSE, volumetric MRI measures showed no significant differences between acute SCI patients and healthy controls at 1 month after injury. Exploratory multiple linear regression analyses adjusting for age, sex, Length LSE-CMtip, and T12 PH, revealed significant reductions for the CM-GM-TV (p = .004) and the CM-TV (p=0.012).Discussion
This work revealed lower tissue-specific volumetric MRI measures in the CM in SCI patients 1 months after injury compared to healthy controls. Given the importance of the CM in neurological control of lower limb, lower urinary tract, sexual and bowel function11, quantitative imaging markers of this region would be of clinical relevance in patients with neurological diseases affecting the lower SC. A limitation of this study is the small and heterogeneous groups which were not age matched. However, volumetric CM reductions could be confirmed using linear regression models adjusted for age6. The lack of significant LSE reductions may be due to the small group of healthy controls showing rather low volumetric measures when compared to values reported in previous studies5,6,8,9, emphasizing the need for a larger sample. Further investigations should also focus on the use of normalization strategies to reduce variability of CM volumetric assessments.Conclusion
This optimized lumbosacral SC multi-echo gradient-echo sequence has been shown to be sensitive to detect remote tissue-specific volumetric changes in the CM in SCI patients. Further work is needed to establish whether such changes are related to clinical scores (e.g. lower extremity motor score or impaired bladder function). Furthermore, a larger study is needed to confirm and further explore volumetric changes in the lumbosacral cord after acute SCI.Acknowledgements
The study was supported by the Investigator Initiated Clinical Trials (IICT) programme of the Swiss National Science Foundation (SNSF number: 33IC30_179644).References
1. K. D. Anderson, J. F. Borisoff, R. D. Johnson, S. A. Stiens, and S. L. Elliott, “The impact of spinal cord injury on sexual function: concerns of the general population,” Spinal Cord, vol. 45, no. 5, pp. 328–337, 2007.
2. T. Watanabe, A. R. Vaccaro, H. Kumon, W. C. Welch, D. A. Rivas, and M. B. Chancellor, “High incidence of occult neurogenic bladder dysfunction in neurologically intact patients with thoracolumbar spinal injuries,” J. Urol., vol. 159, no. 3, pp. 965–968, 1998.
3. K. Yokota et al., “Pathological changes of distal motor neurons after complete spinal cord injury,” Mol. Brain, vol. 12, no. 1, 2019.
4. M. Seif, C. A. M. Gandini Wheeler-Kingshott, J. Cohen-Adad, A. E. Flanders, and P. Freund, “Guidelines for the conduct of clinical trials in spinal cord injury: Neuroimaging biomarkers,” Spinal Cord, vol. 57, no. 9, pp. 717–728, 2019.
5. M. C. Yiannakas, P. Kakar, L. R. Hoy, D. H. Miller, and C. A. M. Wheeler-Kingshott, “The use of the lumbosacral enlargement as an intrinsic imaging biomarker: Feasibility of grey matter and white matter cross-sectional area measurements using MRI at 3T,” PLoS One, vol. 9, no. 8, p. 105544, 2014.
6. M. C. Yiannakas et al., “Gray vs. White Matter Segmentation of the Conus Medullaris: Reliability and Variability in Healthy Volunteers,” J. Neuroimaging, vol. 29, no. 3, pp. 410–417, 2019.
7. K. Vallotton et al., “Tracking White and Gray Matter Degeneration along the Spinal Cord Axis in Degenerative Cervical Myelopathy,” J. Neurotrauma, 2021.
8. G. David et al., “Longitudinal changes of spinal cord grey and white matter following spinal cord injury.,” J. Neurol. Neurosurg. Psychiatry, vol. 0, pp. 1–9, 2021.
9. G. David et al., “In vivo evidence of remote neural degeneration in the lumbar enlargement after cervical injury,” Neurology, vol. 92, no. 12, p. e1367 LP-e1377, Mar. 2019.
10. H. Konno, T. Yamamoto, Y. Iwasaki, and H. Iizuka, “Shy-Drager syndrome and amyotrophic lateral sclerosis. Cytoarchitectonic and morphometric studies of sacral autonomic neurons,” J. Neurol. Sci., vol. 73, no. 2, pp. 193–204, Apr. 1986.
11. J. N. Panicker, C. J. Fowler, and T. M. Kessler, “Lower urinary tract dysfunction in the neurological patient: Clinical assessment and management,” The Lancet Neurology, vol. 14, no. 7. Elsevier, pp. 720–732, Jul. 01, 2015.
Figures