1454
Making myelin water imaging “normal”: Robust acquisition for cervical cord with low peripheral nerve stimulation1Physics and Astronomy, University of British Columbia, Vancouver, BC, Canada, 2MRI Research Centre, University of British Columbia, Vancouver, BC, Canada, 3Radiology, University of British Columbia, Vancouver, BC, Canada, 4International Collaboration on Repair Discoveries, Vancouver, BC, Canada, 5Medicine, University of British Columbia, Vancouver, BC, Canada
Synopsis
The standard myelin water imaging (MWI) sequence for cervical spinal cord, 3D gradient and spin echo (GRASE), was modified to allow scanning in “normal mode” (limiting imaging parameters that may cause physiologic stress) for patients who may not tolerate peripheral nerve stimulation or tissue heating due to MR-conditional implants or medical issues. Traditional 32-echo GRASE was replaced with 48-echo GRASE in normal mode. Myelin water fraction maps from the new sequence had better repeatability than the standard sequence. 48-echo GRASE is the recommended sequence for MWI in spinal cord, particularly for subjects who cannot be scanned outside of normal mode.
Introduction
Myelin water imaging (MWI) is a T2 relaxation-based quantitative biomarker for myelin content in the central nervous system1. MWI decomposes the T2 decay into components corresponding to myelin-associated water (<40ms), intra/extra-cellular water (40-200ms) and cerebrospinal fluid (~2s). Myelin water fraction (MWF) is calculated as the ratio of the signal from myelin-associated water to the total signal.A commonly used technique for MWI of cervical spinal cord is an 8.5 minute 32-echo 3D Gradient and Spin Echo (3D GRASE) sequence2 operating in first-level controlled mode, which allows for faster gradient switching. This mode is not suitable for scanning subjects with MR-conditional implants or susceptible physiological conditions (e.g. poor cardiac output, opioid drug use, pregnancy) as it may cause overheating of subjects or implants due to RF pulses.
Normal mode3,4 limits the RF power deposition and gradient switching rate to reduce the chance of overheating. The peripheral nerve stimulation (PNS) threshold is limited to 80%3,4 by restricting the time-varying magnetic field gradients (dB/dt). The specific absorption rate (SAR), a measure of RF power deposition per unit mass, and B1+ rms, the time average of the applied RF field, are also limited. To prevent the core body temperature from rising by more than 0.5C, normal mode requires that whole body SAR<2W/kg3–5. Here, a modified 3D GRASE sequence was implemented and evaluated in normal mode.
Methods
Acquisition: A healthy volunteer underwent scanning on a Philips Elition 3T scanner using a 16-channel head and neck coil, with scans centered at the C2/C3 level of the spinal cord. The scanning protocol consisted of:1. Multi-echo gradient echo (GRE-ME): resolution 0.5x0.5x5mm3, TR/TE1/ΔTE=600/7.1/6.5ms, Compressed Sense (CS) factor=2, 2 signal averages, scan duration=4.5min, average of 3 acquired echoes used for anatomical segmentation and registration
2. Axial 32-echo 3D GRASE in first-level controlled mode: 32 echoes, TE=10ms, TR=1500ms, refocusing flip angle=180°, acquired resolution=0.75x0.75x5mm3, FOV=180x150x40mm3 (AP, RL, FH), reconstructed resolution=0.6x0.6x2.5mm3, SENSE factor 2 (RL), scan duration=8.3min
3. Axial 48-echo 3D GRASE in normal mode: 48 echoes, TE=8ms, TR=2000ms, refocusing flip angle=180°, acquired resolution=1.4x0.9x5mm3, FOV=170x170x40mm3 (AP, RL, FH), reconstructed resolution=0.5x0.5x2.5mm3, SENSE factor 2 (RL), scan duration=10.8min
To assess repeatability, both GRASE sequences were collected twice during the scan session without repeating any scan twice in a row. The volunteer stayed in the scanner for the full duration of the exam, without re-positioning.
Analysis: MWF maps were generated using the Julia-based DECAES software6, including corrections for stimulated echo artifacts and regularized non-negative least squares (NNLS) fitting7. Images were segmented and GRE-ME was registered with the PAM50 template using Spinal Cord Toolbox8. Regions of interest (ROIs) were obtained by registering the GRASE images with the PAM50 template aligned in GRE-ME space, then concatenating the two warp fields to transform data from GRASE space to PAM50 template space using a single interpolation step. Regionwise MWFs were extracted for six ROIs (whole spinal cord, white matter, grey matter, dorsal columns, lateral funiculi, ventral funiculi). MWFs from each scan were compared to assess repeatability.
Results
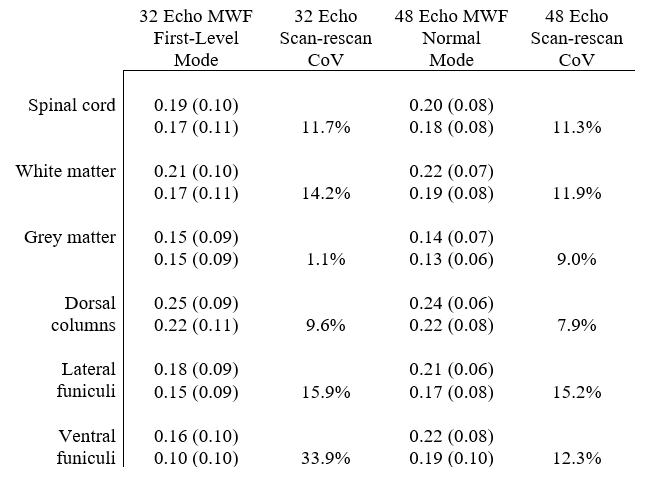
Figure 1 shows the generated MWF maps for the same slice from each scan.Table 1 gives a summary of MWFs separated by region. The average scan-rescan coefficient of variation9 for the 32-echo sequence was 14%, and for the 48-echo sequence was 11%. The average MWF WM/GM contrast for the 32-echo sequence was 1.3 and for the 48-echo sequence was 1.5.
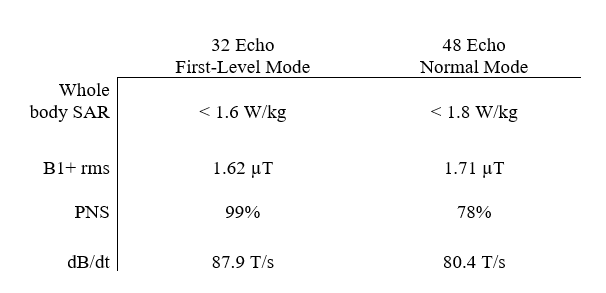
Table 2 compares the whole body SAR, B1+ rms, PNS threshold as a percentage of the maximum, and dB/dt (time varying gradients) from each sequence.
The fit-to-noise ratio (FNR) for the new 48-echo sequence was on average 60% higher than for the 32-echo sequence.
Discussion
The 48-echo sequence has a slightly longer acquisition duration due to the requirement of lower power deposition as well as more RF pulses, which resulted in a longer TR.Scan parameters relating to PNS were reduced in normal mode as expected. Although SAR was well within normal mode operating limits in both sequences, a slight increase for the 48-echo sequence was noted, likely due to more RF pulses. PNS is the limiting factor for scanning subjects who would otherwise be unable to be scanned using GRASE MWI, because the chain of gradient-echo/spin-echo/gradient-echo (for an echo-planar imaging factor of three) must be acquired in a brief timespan to provide the short echo spacing required for MWI, which requires high dB/dt rates.
The 48-echo sequence compared favourably with the traditional 32-echo sequence in scan-rescan repeatability. Higher fit-to-noise ratios were seen with the 48-echo sequence, indicating better fits for the T2 decay curves. This may be due to the ability of the 48-echo sequence to better fit slower decaying signal because of the longer echo train. The shorter echo spacing on the new sequence should be able to better quantify the fast-relaxing myelin water compartment.
Conclusion
Modifications were made to the current standard for cervical spinal cord MWI, the 32-echo 3D GRASE sequence, to operate in normal mode and be compatible for participants who would otherwise be unable to be scanned safely. The new 48-echo sequence features shorter echo spacing, better fits for the T2 decay curves, similar MWF values, and better repeatability than the standard sequence.Acknowledgements
We thank the researchers, volunteers and the MR technical staff at the UBC MRI Research Centre for their support. This research was funded by Michael Smith Health Care BC (SK), NSERC (SB, AD, SK Grant RGPIN-2018-03904).References
1. MacKay A, Whittall K, Adler J, Li D, Paty D, Graeb D. In vivo visualization of myelin water in brain by magnetic resonance. Magnetic resonance in medicine. 1994;31(6):673-677. http://doi.wiley.com/10.1002/mrm.1910310614
2. Ljungberg E, Vavasour I, Tam R, et al. Rapid myelin water imaging in human cervical spinal cord. Magnetic Resonance in Medicine. 2017;78(4). doi:10.1002/mrm.26551
3. Loren A. Zaremba. FDA Guidelines for Magnetic Resonance Equipment Safety. https://www.aapm.org/meetings/02AM/pdf/8356-48054.pdf
4. Medicines and Healthcare Products Regulatory Agency. Safety Guidelines for Magnetic Resonance Imaging Equipment in Clinical Use.; 2021.
5. Allison J, Yanasak N. What MRI Sequences Produce the Highest Specific Absorption Rate (SAR), and Is There Something We Should Be Doing to Reduce the SAR During Standard Examinations? American Journal of Roentgenology. 2015;205(2). doi:10.2214/AJR.14.14173
6. Doucette J, Kames C, Rauscher A. DECAES – DEcomposition and Component Analysis of Exponential Signals. Zeitschrift für Medizinische Physik. 2020;30(4). doi:10.1016/j.zemedi.2020.04.001
7. Prasloski T, Mädler B, Xiang QS, MacKay A, Jones C. Applications of stimulated echo correction to multicomponent T2 analysis. Magnetic resonance in medicine. 2011;67(6):1803-1814. http://doi.wiley.com/10.1002/mrm.23157
8. de Leener B, Lévy S, Dupont SM, et al. SCT: Spinal Cord Toolbox, an open-source software for processing spinal cord MRI data. NeuroImage. 2017;145. doi:10.1016/j.neuroimage.2016.10.009
9. Meyers SM, Vavasour IM, Mädler B, et al. Multicenter measurements of myelin water fraction and geometric mean T 2 : Intra- and intersite reproducibility. Journal of Magnetic Resonance Imaging. 2013;38(6). doi:10.1002/jmri.24106
Figures