1453
Myelin-sensitive MRI metrics correlate with inflammation in human traumatic spinal cord injury1International Collaboration on Repair Discoveries (ICORD), Vancouver, BC, Canada, 2Physics & Astronomy, University of British Columbia, Vancouver, BC, Canada, 3Radiology, University of British Columbia, Vancouver, BC, Canada, 4Faculty of Medicine, UBC MRI Research Centre, Vancouver, BC, Canada, 5Pathology & Laboratory Medicine, University of British Columbia, Vancouver, BC, Canada, 6Vancouver General Hospital, Vancouver, BC, Canada, 7Orthopaedics, University of British Columbia, Vancouver, BC, Canada
Synopsis
We investigated the correlation of inhomogeneous magnetisation transfer ratio (ihMTR), myelin water fraction (MWF) and intra/extra-cellular water geometric mean T2 (I/EW gmT2) with the distribution of inflammatory cells as measured by HLA-DR and CD68 histological staining for macrophages and activated microglia in human traumatic spinal cord injury. We found that ihMTR and MWF decreases were strongly correlated with the presence of HLA/CD68+ immune cells in white matter and both ihMTR and MWF were strongly correlated with LFB, a stain for myelin lipids. Our results demonstrate a strong link between ihMTR and MWF and inflammation.
Introduction
Demyelination occurs after spinal cord injury (SCI) and is exacerbated by ongoing inflammation. Activated microglia are present in the cord from one day after injury and macrophages infiltrate at ~2-5 days.1 These inflammatory cells ingest myelin debris and contribute to secondary injury to the cord.2 Myelin debris may also invoke a greater inflammatory response.3 How inflammation influences MR measures of myelin in human SCI has not been examined.Myelin Water Imaging (MWI) isolates the short T2 signal from water trapped between myelin bilayers. Myelin water fraction (MWF) has been histologically validated as a myelin biomarker4–6 and can also include signal from myelin debris.7 MWI also provides an intra/extra-cellular water geometric mean T2 (I/EW gmT2)8 (the amplitude-weighted mean on a logarithmic scale) which increases with damage.9–12
Inhomogeneous Magnetization Transfer (ihMT) detects non-aqueous protons experiencing dipolar coupling in motion-restricted environments like lipid membranes.13,14 ihMT ratio (ihMTR) has been validated as a myelin biomarker15 and can be filtered to include only signal from tissue with long dipolar order relaxation time (T1D), which increases myelin specificity.16
The objective of our study was to correlate MWF, ihMTR and I/EW gmT2 with histology staining for inflammatory cells and myelin. We hypothesised:
- MWF and ihMTR would increase with myelin staining
- I/EW gmT2 would increase with inflammation staining
- Myelin and inflammation stains would be negatively correlated
Methods
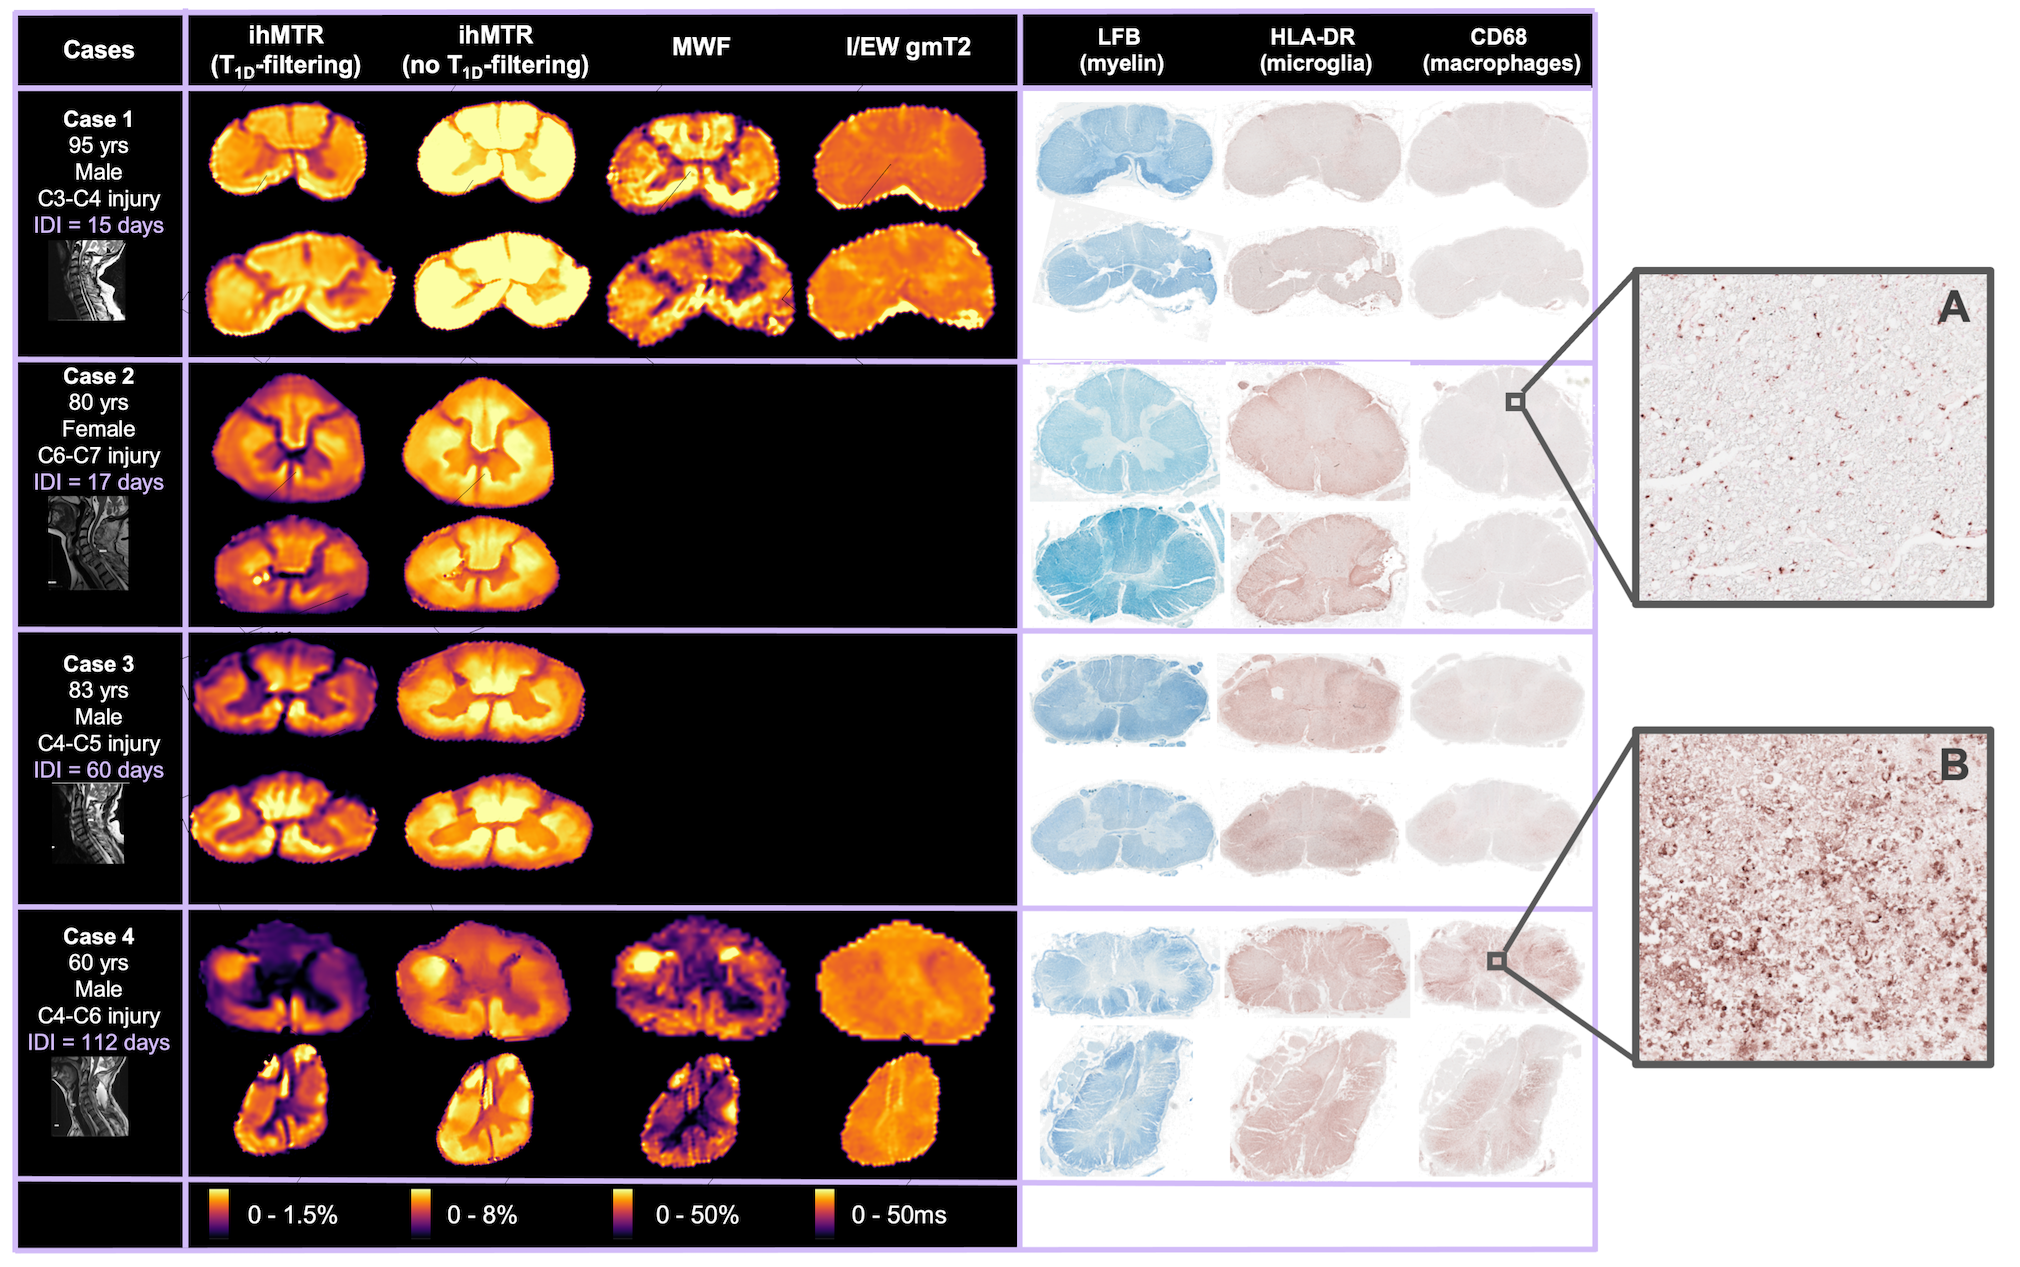
Acquisition: Four spinal cords from the International Spinal Cord Injury Biobank (www.sci-biobank.org), donated by individuals who died after an acute SCI (Fig 1), were scanned ex-vivo at 7T (Bruker Biospec, 4.5cm formalin-fixed spinal cord blocks, 35mm inner-diameter quadrature volume coil, room temperature):- T2-weighted RARE (resolution=0.1x0.1x1mm3)
- ihMT (FLASH, TE=3.95ms, resolution=0.18x0.18mm2, freq.offset=+/-8kHz, no T1D-filtering: 2 cosine-modulated 1ms pulses, TR=50ms; strong T1D-filtering: 12 frequency-alternated 3.3ms repeating pulses, TR=100ms).
- MWI (3D 48-echo SE, TR/TE=1000/6.55ms, resolution=0.3x0.3x1.5mm3) (note: Cases 2 and 3 had acquisition issues and were not included in MWI analysis.)
- ihMTR maps were produced in MatLab.
- MWI used NNLS18,19 to produce myelin water fraction (signal fraction with T2=5-24ms) and I/EW gmT2 (24<T2<200ms).
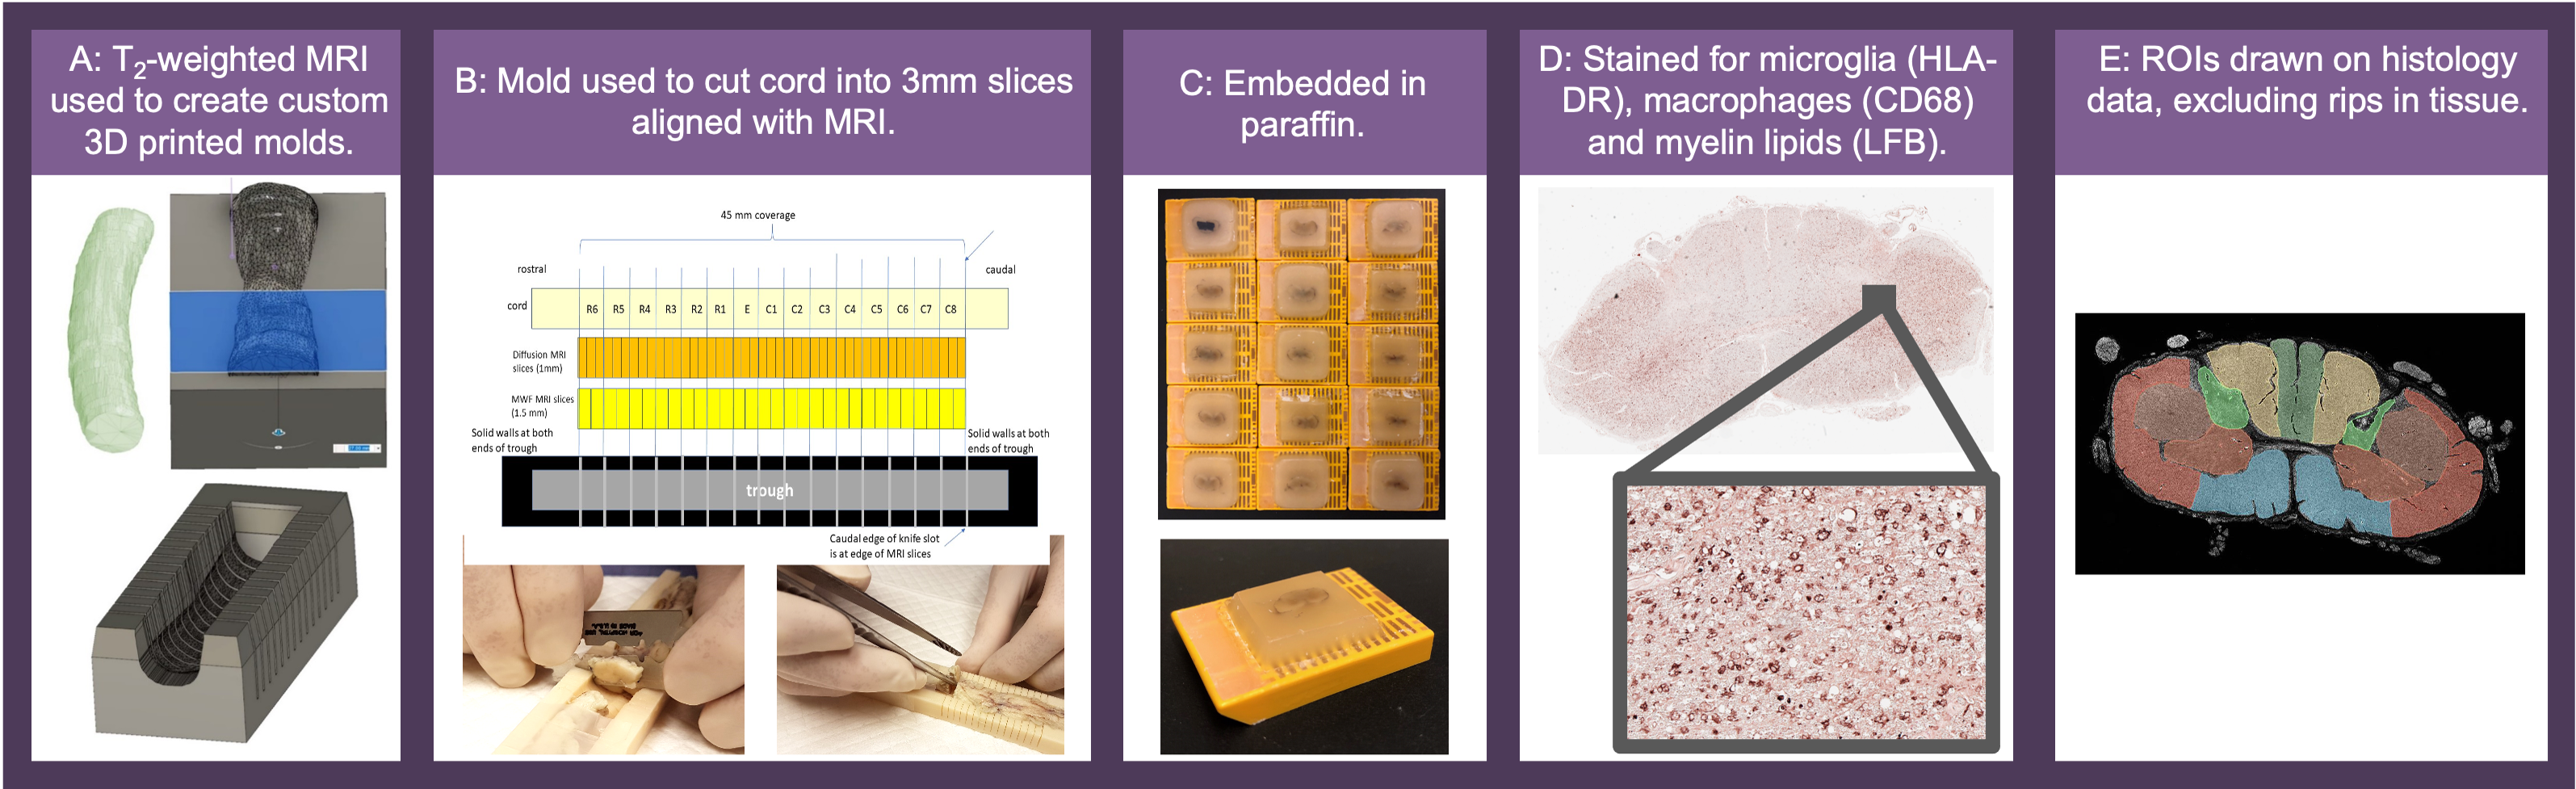
Histology: Custom 3D-printed moulds were created using T2-weighted scans for each cord with knife slots aligned with MRI slice location (Fig 2). Using this mould, cords were cut into 3mm slices and embedded in paraffin. Two 5μm sections (±9mm from epicenter) from each cord were stained with HLA-DR (activated microglia), CD68 (macrophages) and LFB (myelin lipids) and digitised at 40x resolution.
Correlation analysis: Five white matter and two grey matter regions of interest (ROIs) were manually drawn on histology and MRI (3D Slicer20, Fig 2). Saturation images of the raw histology scans were thresholded using an Otsu algorithm to create binary images of positive staining.21 The stained area fraction for each ROI was calculated. Pearson correlation coefficients (𝜌) were calculated between MRI and histology mean ROI values (p<0.001 after Bonferroni correction).
Results
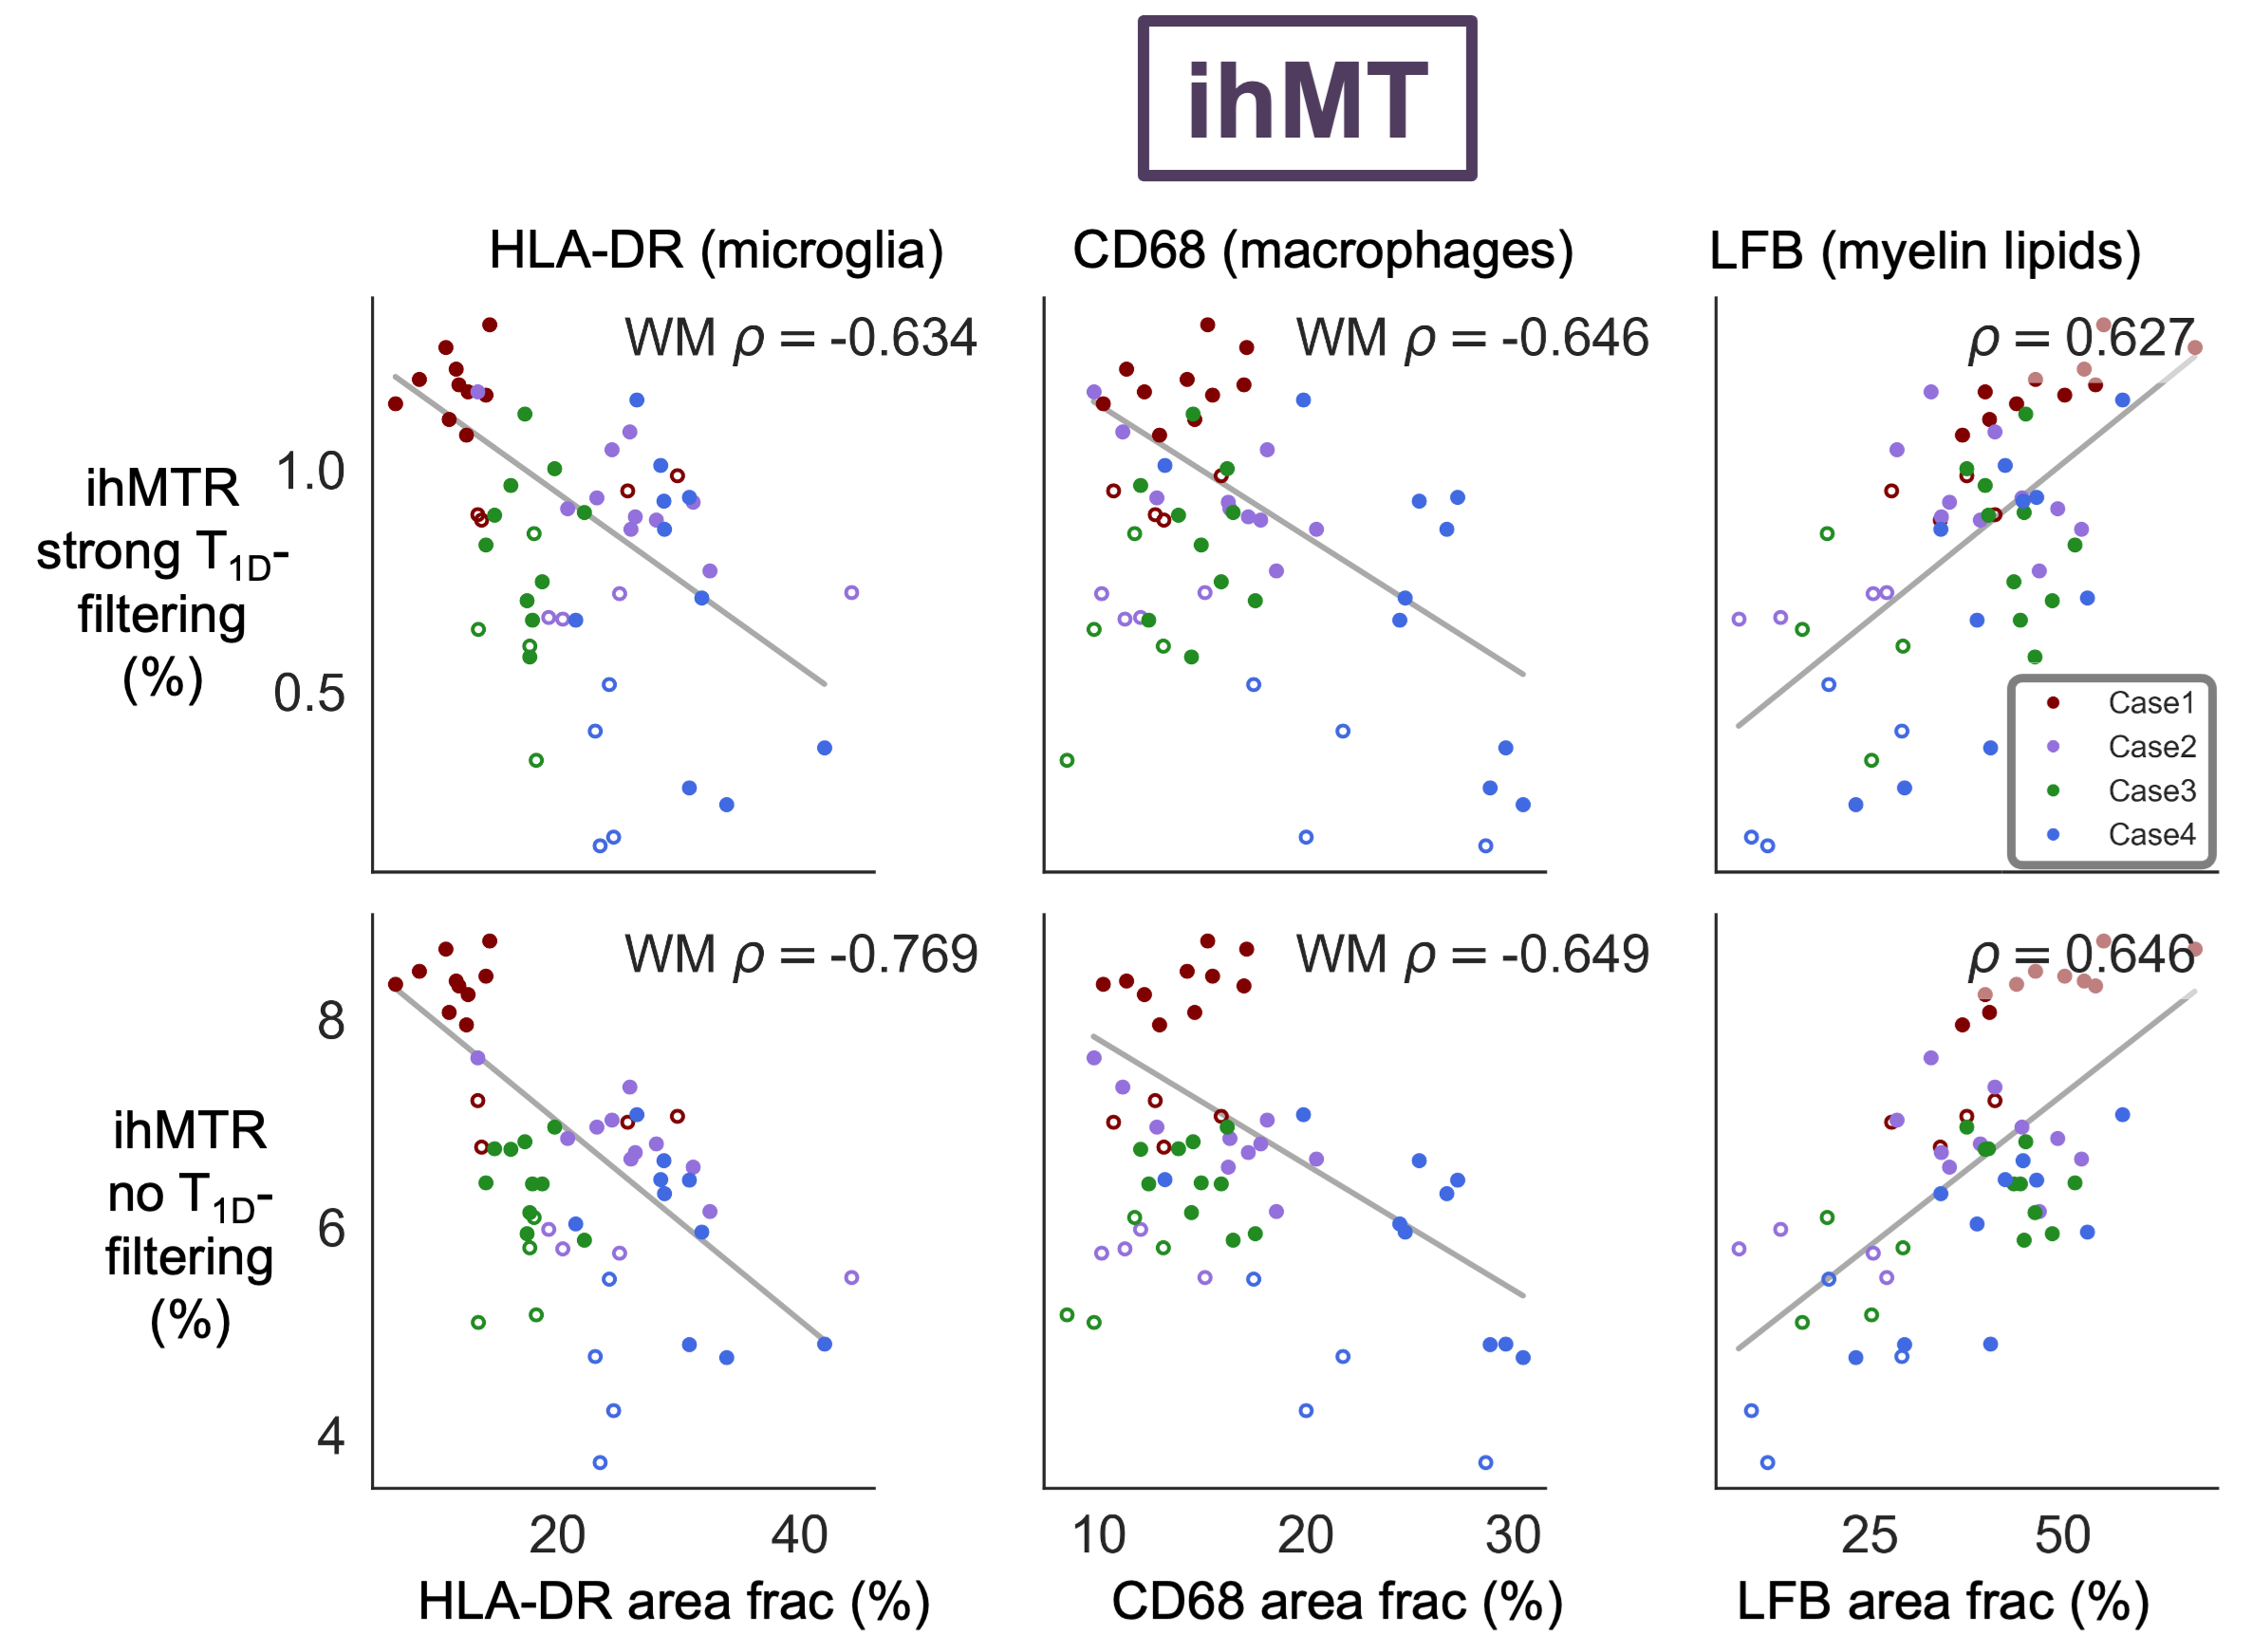
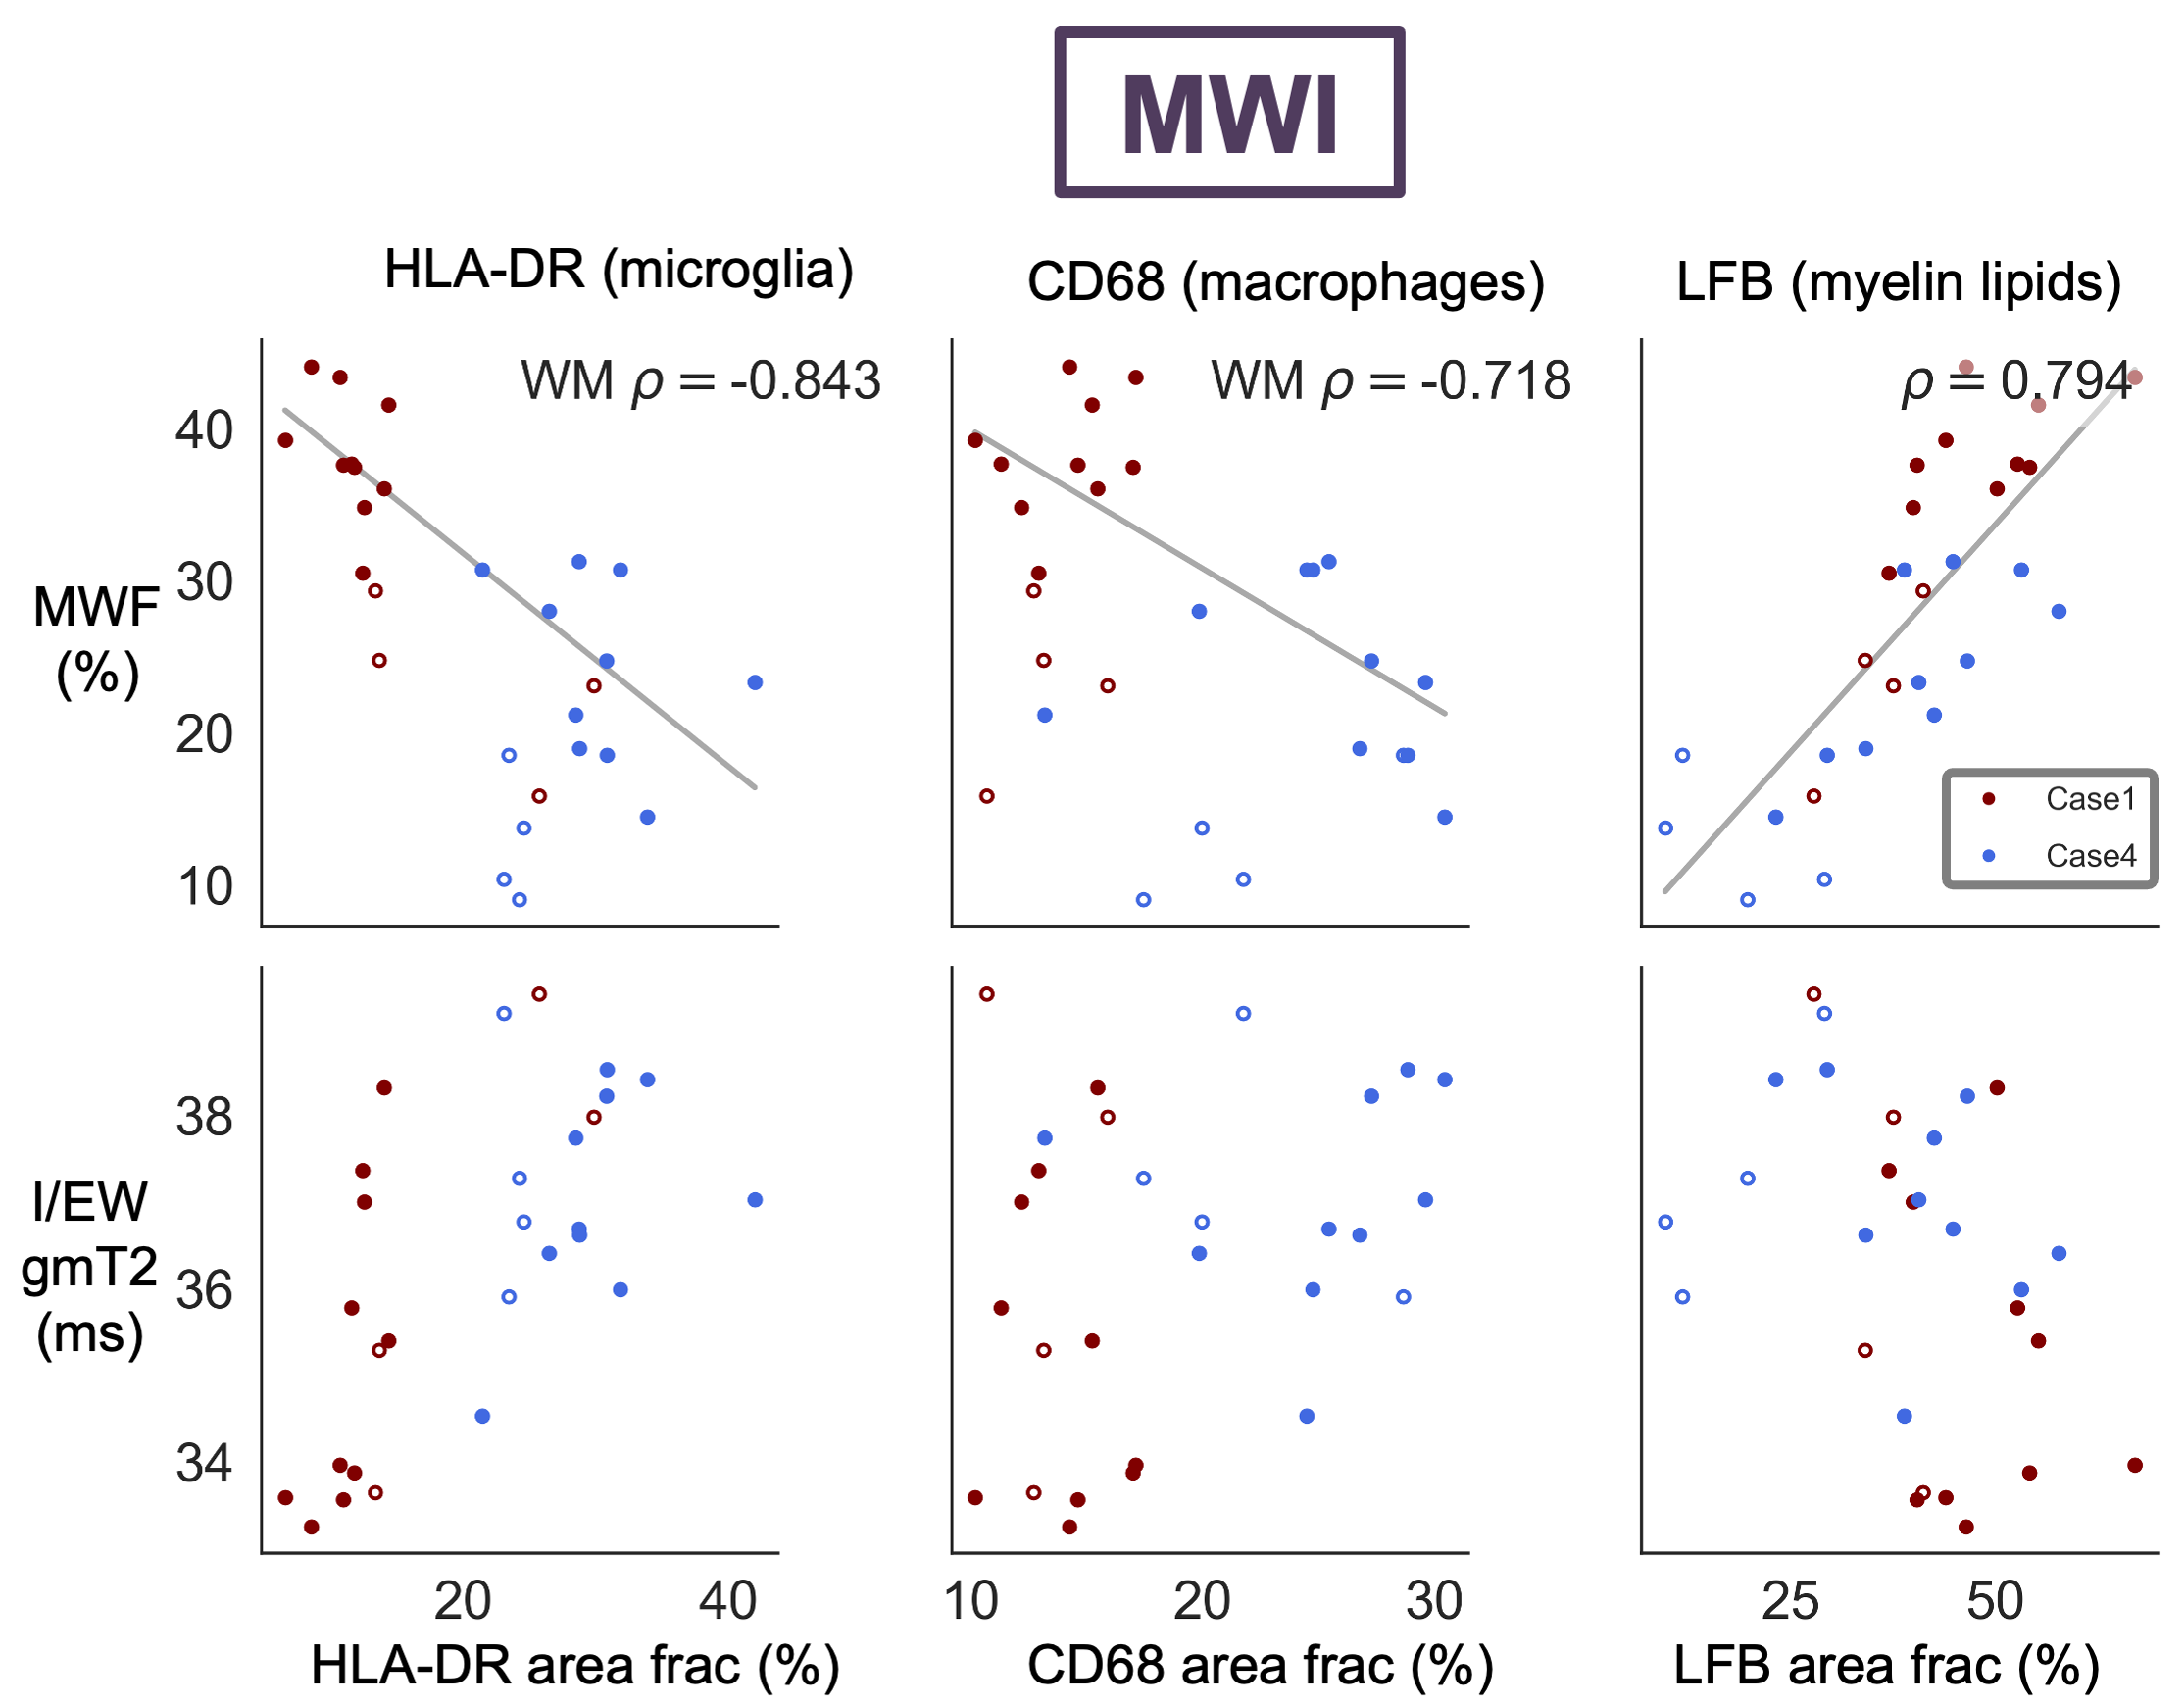
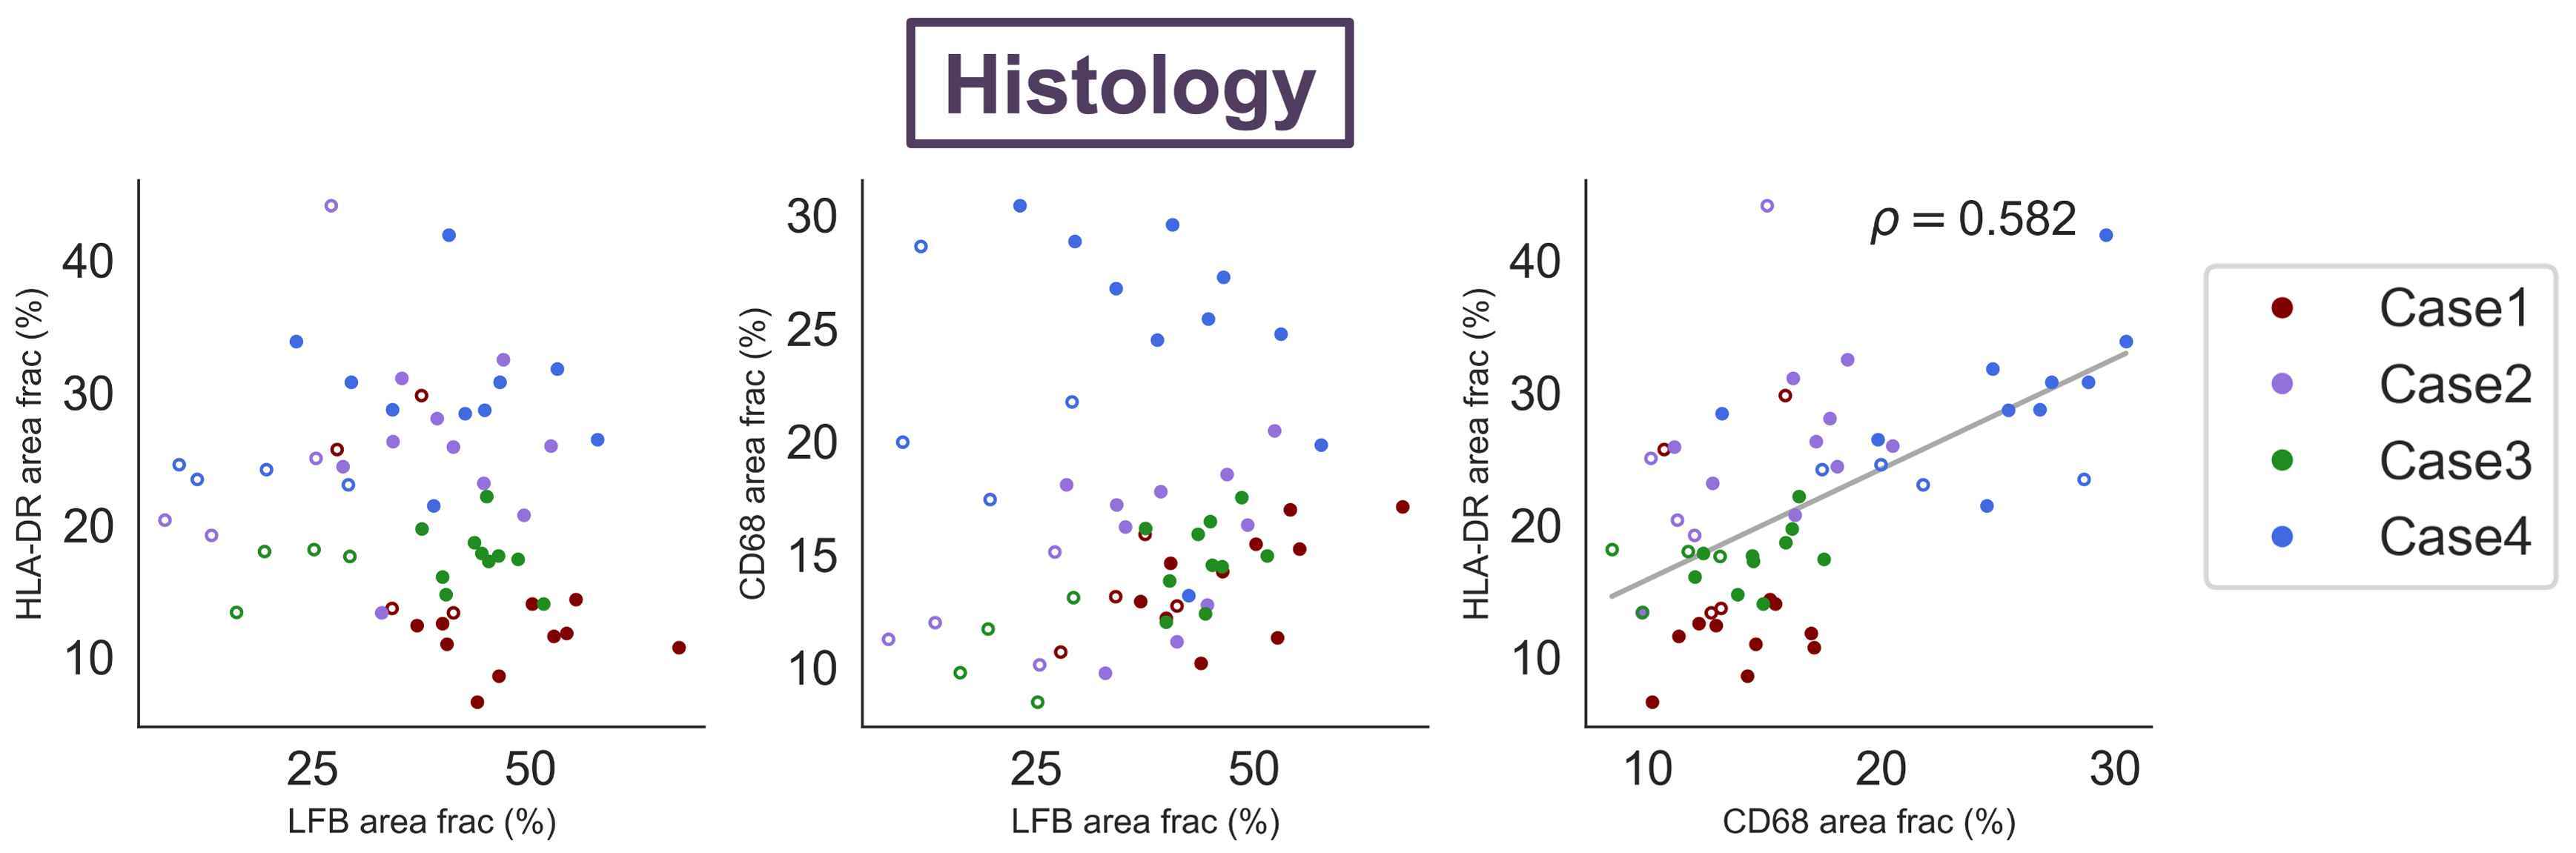
ihMTR with and without T1D-filtering and MWF were negatively correlated with both HLA-DR and CD68 in white matter ROIs (Fig 3,4). ihMTR and MWF were positively correlated with LFB across all ROIs. I/EW gmT2 was not correlated with any stain. HLA-DR and CD68 were correlated with each other, but not with LFB (Fig 5).Discussion
MWF and ihMTR correlated with myelin staining, demonstrating that both techniques are sensitive to myelin in ex-vivo human spinal cord. I/EW gmT2 did not increase as predicted with inflammatory cell staining. Increased I/EW gmT2 in white matter, also observed in multiple sclerosis and stroke,9,11 implies changes in the intra/extra-cellular environment resulting in “freer” relaxation and longer T2. The lack of I/EW gmT2-inflammatory cell correlation suggests other inflammation or water-related processes like edema or vacuoles may be driving I/EW gmT2 increases.The unexpected strong correlation between HLA-DR/CD68 and ihMTR/MWF in white matter suggests that there is a link between inflammation and these metrics in the injured spinal cord. There appeared to be a separate parallel trend of ihMTR/MWF with HLA-DR/CD68 in the grey matter ROIs, but this did not reach significance. Correlations with HLA-DR, CD68 and LFB were slightly stronger for ihMTR without T1D-filtering, perhaps due to the higher SNR acquired using this saturation scheme. Of course, we acknowledge that a strong correlation (more inflammatory cells and lower myelin metrics in more damaged areas) does not necessarily prove causation (that inflammation is causing myelin loss). There was no correlation between LFB and HLA-DR or CD68 which might support an interpretation that inflammation sequelae other than myelin loss are affecting ihMTR and MWF. However, ihMTR and MWF each correlated with LFB, and they are derived from very different contrast mechanisms, making it more unlikely that they would both change in the same way in the presence of inflammation. Perhaps MWF and ihMTR are detecting changes in myelin occurring in areas of inflammation which are not yet seen in a reduction of the LFB staining area.
Conclusion
ihMTR and MWF decreased in areas of inflammation, revealing a strong link between inflammation and these metrics in the injured spinal cord. Correlations with HLA-DR and CD68 were stronger for the ihMTR sequence without T1D-filtering. Our results demonstrate the substantial relationship between inflammation and myelin MRI techniques which warrants further investigation.Acknowledgements
We would like to thank the patients and families for tissue donation to the International Spinal Cord Injury Biobank. Funding for the Biobank and this study was provided by the Blusson Integrated Cures Partnership (BICP), VGH and UBC Hospital Foundation and the Rick Hansen Foundation, an International Collaboration on Repair Discoveries (ICORD) Seed Grant, the Craig H. Neilsen Foundation and NSERC. This work was conducted on the traditional, ancestral, and unceded territories of Coast Salish Peoples, including the territories of the xwməθkwəy̓əm (Musqueam), Skwxwú7mesh (Squamish), Stó:lō and Səl̓ílwətaʔ/Selilwitulh (Tsleil- Waututh) Nations.
References
1. Fleming, J. C. et al. The cellular inflammatory response in human spinal cords after injury. Brain 129, 3249–3269 (2006).
2. Zhou, X., He, X. & Ren, Y. Function of microglia and macrophages in secondary damage after spinal cord injury. Neural Regen Res 9, 1787–1795 (2014).
3. Kopper, T. J. & Gensel, J. C. Myelin as an inflammatory mediator: Myelin interactions with complement, macrophages, and microglia in spinal cord injury. Journal of Neuroscience Research 96, 969–977 (2018).
4. Laule, C. et al. Myelin water imaging in multiple sclerosis: quantitative correlations with histopathology. Mult. Scler. 12, 747–753 (2006).
5. Laule, C. et al. High-resolution myelin water imaging in post-mortem multiple sclerosis spinal cord: A case report. Mult. Scler. 22, 1485–1489 (2016).
6. Laule, C. et al. Myelin water imaging of multiple sclerosis at 7 T: correlations with histopathology. Neuroimage 40, 1575–1580 (2008).
7. Chen, H. S.-M., Holmes, N., Liu, J., Tetzlaff, W. & Kozlowski, P. Validating myelin water imaging with transmission electron microscopy in a rat spinal cord injury model. NeuroImage 153, 122–130 (2017).
8. Whittall, K. P. et al. In vivo measurement of T2 distributions and water contents in normal human brain. Magnetic Resonance in Medicine 37, 34–43 (1997).
9. Whittall, K. P. et al. Normal-appearing white matter in multiple sclerosis has heterogeneous, diffusely prolonged T2. Magnetic Resonance in Medicine 47, 403–408 (2002).
10. Laule, C. et al. Pathological basis of diffusely abnormal white matter: insights from magnetic resonance imaging and histology. Mult Scler 17, 144–150 (2011).
11. Borich, M. R., Mackay, A. L., Vavasour, I. M., Rauscher, A. & Boyd, L. A. Evaluation of white matter myelin water fraction in chronic stroke. Neuroimage Clin 2, 569–580 (2013).
12. Laule, C. et al. Long T2 water in multiple sclerosis: What else can we learn from multi-echo T2 relaxation? J Neurol 254, 1579–1587 (2007).
13. Varma, G., Duhamel, G., de Bazelaire, C. & Alsop, D. C. Magnetization Transfer from Inhomogeneously Broadened Lines: A Potential Marker for Myelin. Magn Reson Med 73, 614–622 (2015).
14. Manning, A. P., Chang, K. L., MacKay, A. L. & Michal, C. A. The physical mechanism of ‘inhomogeneous’ magnetization transfer MRI. J. Magn. Reson. 274, 125–136 (2017).
15. Duhamel, G. et al. Validating the sensitivity of inhomogeneous magnetization transfer (ihMT) MRI to myelin with fluorescence microscopy. NeuroImage 199, 289–303 (2019).
16. Prevost, V. H. et al. Optimization of inhomogeneous magnetization transfer (ihMT) MRI contrast for preclinical studies using dipolar relaxation time (T1D) filtering. NMR in Biomedicine 30, e3706 (2017).
17. Coupe, P. et al. An optimized blockwise nonlocal means denoising filter for 3-D magnetic resonance images. IEEE Trans Med Imaging 27, 425–441 (2008).
18. Prasloski, T., Mädler, B., Xiang, Q.-S., MacKay, A. & Jones, C. Applications of stimulated echo correction to multicomponent T2 analysis. Magn Reson Med 67, 1803–1814 (2012).
19. Whittall, K. P. & MacKay, A. L. Quantitative interpretation of NMR relaxation data. Journal of Magnetic Resonance (1969) 84, 134–152 (1989).
20. Kikinis, R., Pieper, S. D. & Vosburgh, K. G. 3D Slicer: A Platform for Subject-Specific Image Analysis, Visualization, and Clinical Support. in Intraoperative Imaging and Image-Guided Therapy (ed. Jolesz, F. A.) 277–289 (Springer, 2014). doi:10.1007/978-1-4614-7657-3_19.
21. Otsu, N. A Threshold Selection Method from Gray-Level Histograms. IEEE Transactions on systems, man and cybernetics SMC-9, 62–66 (1979).
Figures