1443
Enhancement of the Lymphatic System Following Intravenous Administration of Ferumoxytol1Pediatrics, UT Southwestern, Dallas, TX, United States, 2Pediatrics, Children's Health Medical, Dallas, TX, United States
Synopsis
Lymphatic Imaging is increasingly important in the management of patients with Congenital Heart Disease. It is not known how the intravenous contrast agent ferumoxytol influences this imaging. This retrospective review of 120 patients suggests that intravenously given ferumoxytol rapidly enters the lymphatic system. The resultant shortening of T2 relaxation causes a degradation in T-2 weighted lymphangiography. Conversely, T1-weighted angiography shows clear depiction of the thoracic lymphatic duct immediately after ferumoxytol infusion. This enhancement depends on fasting status of the patient. The classic mechanism of macrophage uptake of iron oxide for MR lymphangiography does not explain the timing of these findings.
Background
In recent years, the need to identify and classify lymphatic abnormalities in congenital heart disease has been highlighted1. Because lymphatic intervention is becoming more common in these patients, MR imaging of lymphatics2 has become an important routine part of congenital heart disease evaluation,3 particularly in patients with single ventricle physiology. In addition, ferumoxytol is becoming more widely used for anatomical evaluation of CHD for prolonged T1 enhancement of the blood pool. In several patients who received ferumoxytol prior to T2W MR lymphangiography, the unexpected degradation of T2W lymphatic signal was observed, suggesting T2 shortening following the lymphatic uptake of ferumoxytol.Ferumoxytol contains superparamagnetic iron oxide nanoparticles, which have been shown to be taken up by macrophages and have been applied for T2W lymph node imaging4. However, the intravascular half-life of ferumoxytol is 14 hrs, while the subsequent lymph node enhancement through macrophage uptake occurs on the order of 24-36 hours5,6. If a different, more rapid mechanism of lymphatic uptake of ferumoxytol is the cause of T2W lymphatic imaging degradation, the simultaneous T1-enhacement of the thoracic duct would be expected. The purpose of this study was to review 3D-IR T1W imaging in patients who received ferumoxytol to confirm its rapid uptake into the lymphatic system.
Methods
This was an IRB-approved retrospective study (STU 032016-009) with waiver of consent for use of anonymized data. 119 patients who received ferumoxytol-enhanced 3D angiography for congenital heart disease evaluation were included in this study. When clinically indicated, T2-weighted imaging for lymphatic evaluation was also performed in a subset of the included patients.Ferumoxytol was given at a dose of 3mg/kg infused over 15 minutes. Contrast-enhanced angiography was performed using ECG-triggered 3D inversion recovery (IR) balanced-SSFP with respiratory navigator gating. The inversion time was chosen to null myocardium using a Look-Locker sequence. Image parameters included FOV = 250-400mm; Isotropic acquisition = 1.8 mm3, non-selective excitation and compressed SENSE factor of 3.5. (TE/TR = 1/2 ms; TFE factor = 35-75).
T2W lymphangiography was performed using coronal segmented 3D turbo spin echo (TSE) acquisition with respiratory triggering performed using respiratory bellows at end expiration, FOV of 280–400 mm, TE/TR = 700/2500 ms, echo train length = 145, shot duration = 712 ms, refocusing flip angle = 140°, and resolution of 1 × 1 × 1.8 mm. The scan time was 2–5 min, depending on the respiratory rate and patient size.
Images were analyzed for visibility of the thoracic lymphatic duct. The thoracic duct was identified by its characteristic tortuosity, paucity of tributaries, drainage to innominate vein and position anterior to the vertebral body and anteromedial to the aorta. T2W lymphatic images were used to help identify the duct, when available.
Results
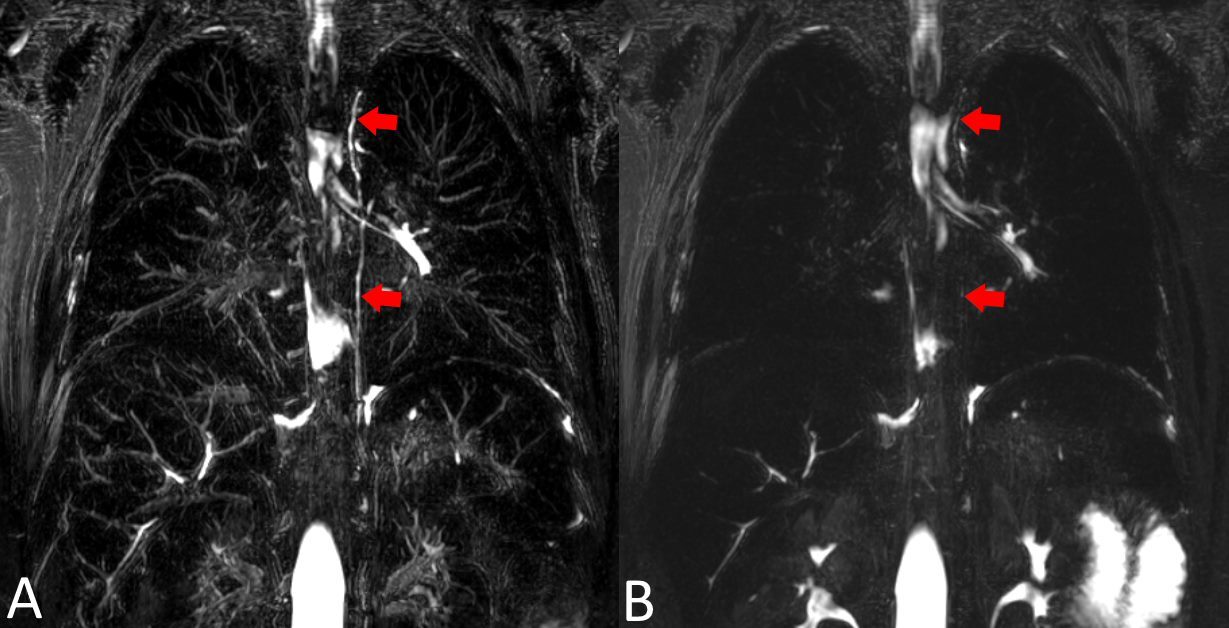
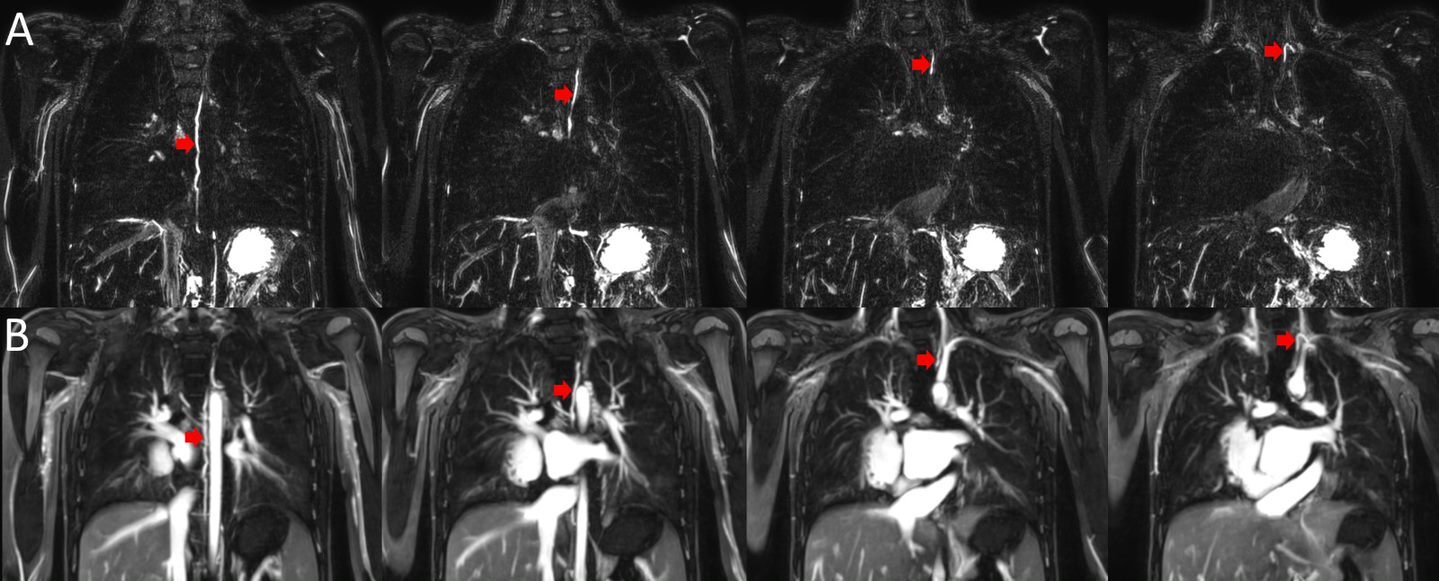
34 of the T2W lymphatic images were acquired before, 5 after and 1 during contrast administration. The thoracic duct was visible in 33/34 of the pre-contrast acquisitions, as well as in the image acquired during contrast administration. The duct was not visible in any of the post-contrast T2W acquisitions, which were acquired, on average, 74 mins following contrast infusion. Figure 1 shows an illustrative case where T2-weighted imaging was performed before and after ferumoxytol infusion showing degradation of imaging.The thoracic lymphatic duct was visible in the T1-weighted ferumoxytol-enhanced angiography, in 38% of all cases. Figure 2 shows the thoracic duct (red arrows) in the pre-contrast T2W lymphangiography (A) and corresponding post-contrast T1W acquisition in the same patient.
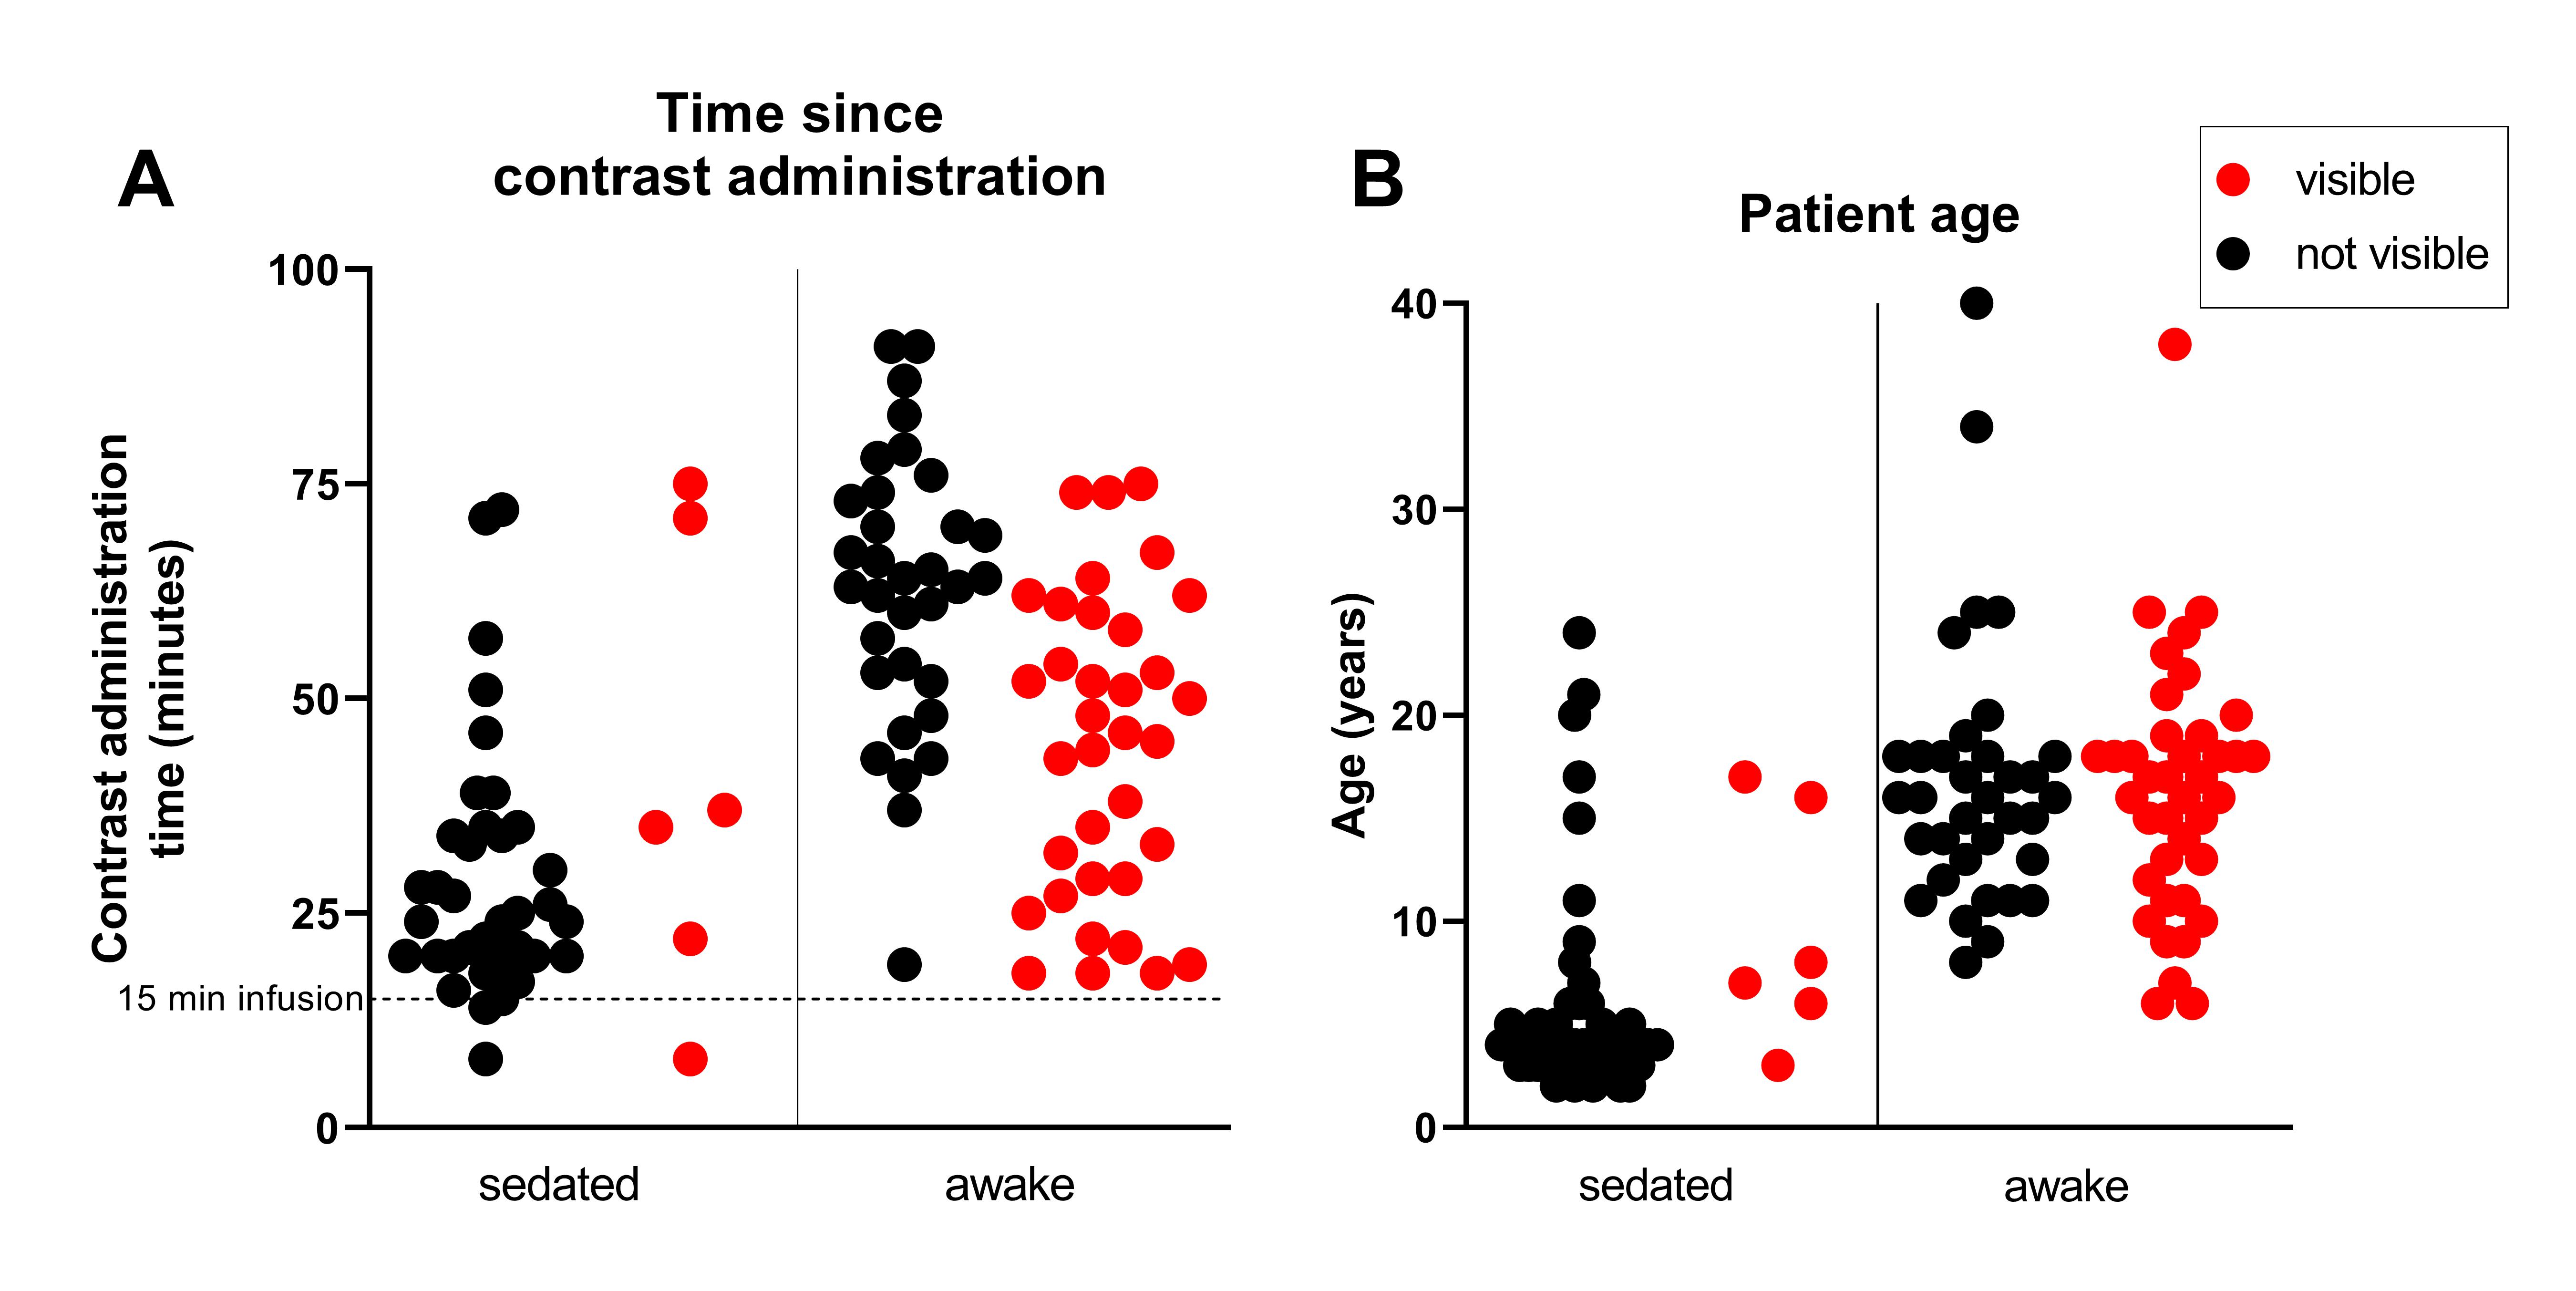
Figure 3A shows the time from contrast administration to T1W imaging in the sedated and awake patient groups. There was no statistical difference in the time to administration between the patients with and without enhancement of the thoracic duct. However, the thoracic duct was only visible in 6 of the sedated patients (13%), while 53% of awake (non-starved) patients showed enhancement of the thoracic duct. A chi-square test showed a significant association between thoracic duct enhancement and whether the patient was under sedation (p<.01).
Figure 3B shows the ages of the patients in the same groups. The patients with visible lymphatic duct enhancement were significantly older than those without enhancement (p<.01), though this is likely due to the older patients not requiring sedation. There was no difference in age of the patients with or without duct enhancement who were awake.
Discussion
Our study shows that intravenously administered ferumoxytol appears rapidly in the lymphatic system, leading to degraded T2W lymphatic imaging, and T1 enhancement in 3D-IR imaging in as little as 8 minutes. The speed of the mechanism for entry into the lymphatic system is not explained by slow macrophage uptake. The strong association with feeding versus starved patients suggests rapid uptake at the level of portal sinusoids, perhaps by liver scavenger cells. It is not clear what factors determine whether the duct is visible in non-starved patients.Conclusions
Intravenously administered Ferumoxytol arrives in the lymphatic system more rapidly than expected. T2-weighted imaging should be performed prior to the administration of ferumoxytol to avoid T2 shortening. This mechanism of lymphatic uptake could provide an alternative T1W imaging approach for lymphatic duct angiography.Acknowledgements
No acknowledgement found.References
1 Biko, D. M. et al. MRI evaluation of lymphatic abnormalities in the neck and thorax after Fontan surgery: relationship with outcome. Radiology 291, 774-780 (2019).
2 Pimpalwar, S. et al. Dynamic contrast enhanced magnetic resonance lymphangiography: categorization of imaging findings and correlation with patient management. European journal of radiology 101, 129-135 (2018).
3 Gooty, V. D. et al. Lymphatic pathway evaluation in congenital heart disease using 3D whole-heart balanced steady state free precession and T2-weighted cardiovascular magnetic resonance. Journal of Cardiovascular Magnetic Resonance 23, 1-9 (2021).
4 Muehe, A. M. et al. Differentiation of benign and malignant lymph nodes in pediatric patients on ferumoxytol-enhanced PET/MRI. Theranostics 10, 3612 (2020).
5 Kordbacheh, H. et al. Pictorial review on abdominal applications of ferumoxytol in MR imaging. Abdominal Radiology 44, 3273-3284 (2019).
6 Daldrup-Link, H. E. Ten things you might not know about iron oxide nanoparticles. Radiology 284, 616-629 (2017).
Figures