1441
A serial dilution study of four Gadolinium-based contrast agents for the detection of low-Gd concentration1Hospital Foundation A. de Rothschild, Imaging department, Paris, France, PARIS, France, 2Paris Brain Institute, Paris, France
Synopsis
Gadolinium-enhanced imaging provides valuable information in clinical practice. Concerns raised by gadolinium depositions favors strategies reducing injected doses in patients requiring repeated scans. We designed four phantoms containing serial dilutions of four gadolinium-based contrast agents to compare their efficacy for low-Gd concentration detection in clinically used MR sequences, based on signal intensity and contrast-to-noise ratio. We performed a preliminary study comparing T1-TSE, FLAIR and FLAIR with optimized parameters on these phantoms. The optimized FLAIR sequence shows an efficient detection of low concentrations, in particular using gadobutrol or gadoteridol.
Introduction
Gadolinium-based contrast agents provide valuable information in clinical practice, and intravenous injection before or during MR imaging is often required. Indeed, many CNS disorders, such as Multiple Sclerosis (MS) or metastases are better detected or assessed with an intravenous injection of gadolinium [1]. Signal enhancement from gadolinium leakage should be as high as possible for the radiologist to detect and describe the lesion’s features with high confidence. However, due to recent evidences of gadolinium deposition in the brain [2], clinical strategies tend to reduce injected doses and lifespan exposure to gadolinium in patients requiring repeated scans.This project aims to compare four commercial gadolinium-based contrast agents (GBACs) at different concentrations using clinical and optimized MRI sequences to detect gadolinium enhancement.
Methods
Serial dilutions of four commercial GBACs (gadobutrol, gadoteridol, and 2 gadoterate meglumines called GM1 and GM2) were performed by using saline solution, prepared within 50mL Falcon tubes and arranged in a 5L plastic container using polystyrene holder and a 1% agarose gel solution (Figure 1, A-B).Gadobutrol is formulated as a 1 molar solution, while gadoteridol, GM1 and GM2 are formulated as semimolar solutions. Each original Gd was diluted with saline to a reference concentration at 1.152mg/ml that simulates the concentration of gadolinium in the brain CSF [3], within the first 8 hours after an intravenous injection. Dilutions range from x3 to 1/2 000 000 of this theoretical concentration (Figure 1, C-D).
Each phantom was scanned 4 times, with 90° rotations, on a 3-tesla MR system (Elition, Philips) using a 32-channel array head coil. All imaging sequences were acquired in the axial image planes with FOVs of approximately 24 cm, imaging matrix of 240x240, and section thicknesses of 1 mm. Imaging protocol for the Gd detection included the following sequences: T1-TSE (TR/TE=500/27ms), FLAIR (TR/TE/TI=8000/400/2400ms), and an optimized FLAIR with the same MR parameters than conventional FLAIR but a modified refocusing angles scheme (Figure 2, A-C).
Each tube was segmented and labeled using an in-house tool on a T1-TFE sequence (Figure 2, D), and the mean and standard deviation of MR signal intensity (SI) was measured over 6 continuous slices. The SI of each tube was averaged over the rotation.
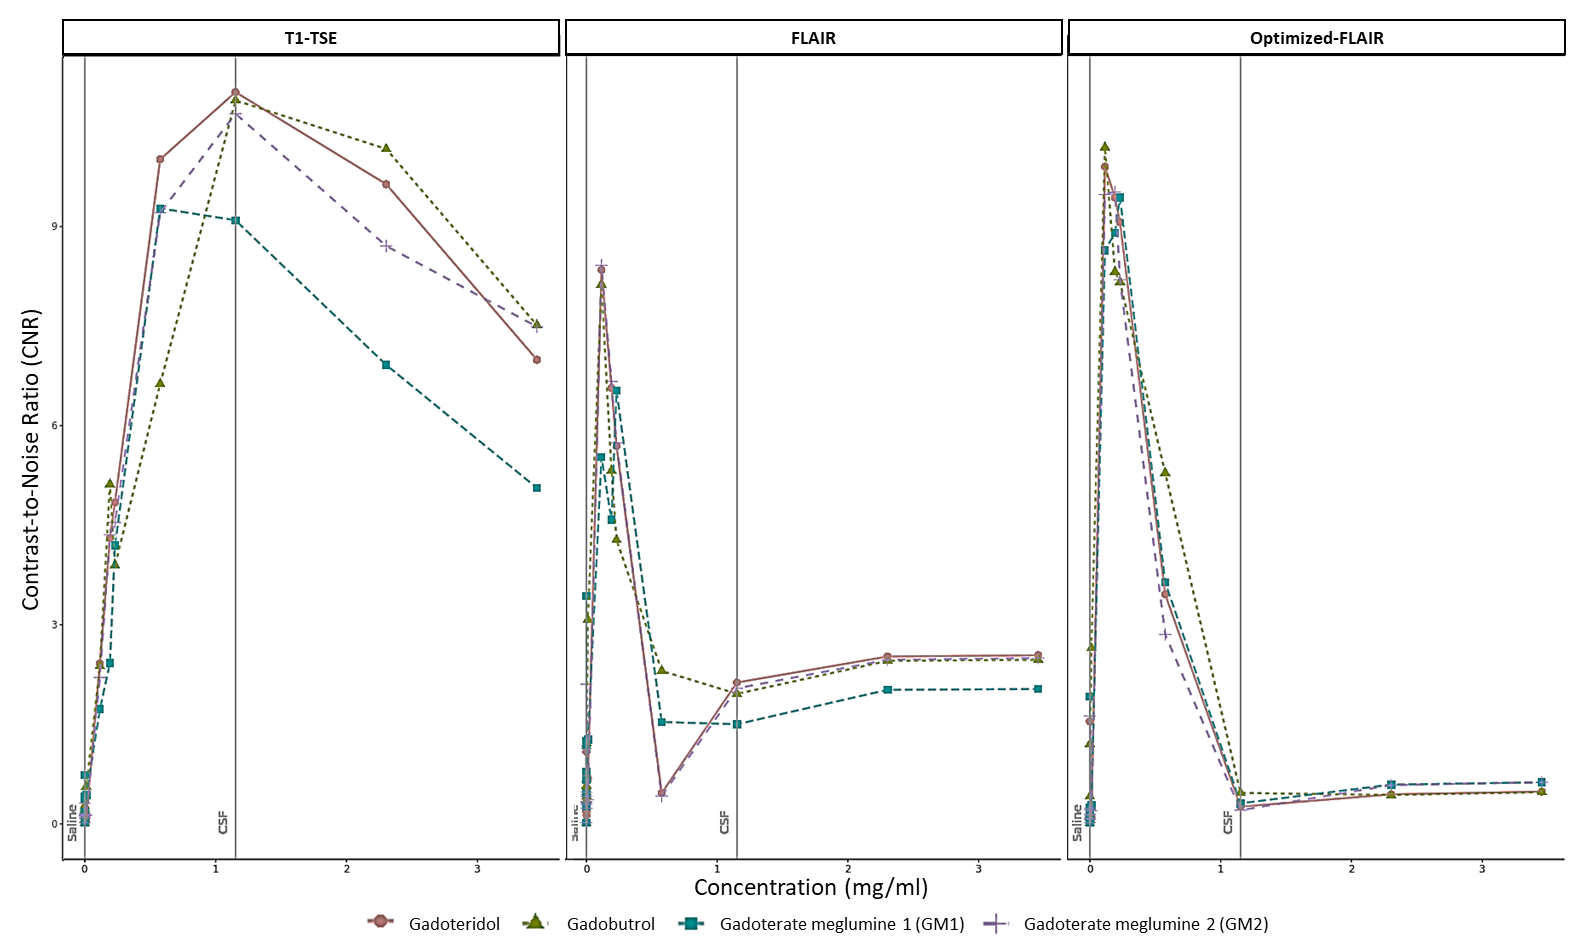
Contrast-to-noise ratio (CNR) was computed between saline and fluid with diluted Gd, defining noise as the standard deviation (SD) of the agar solution (SDagar). We calculated CNR as the difference between the SI of the Gd-containing tubes (SIGd) and saline (SIsaline), divided by SDagar, as follow: $$ CNR = | SIGd-SIsaline | / SDagar $$.
Results
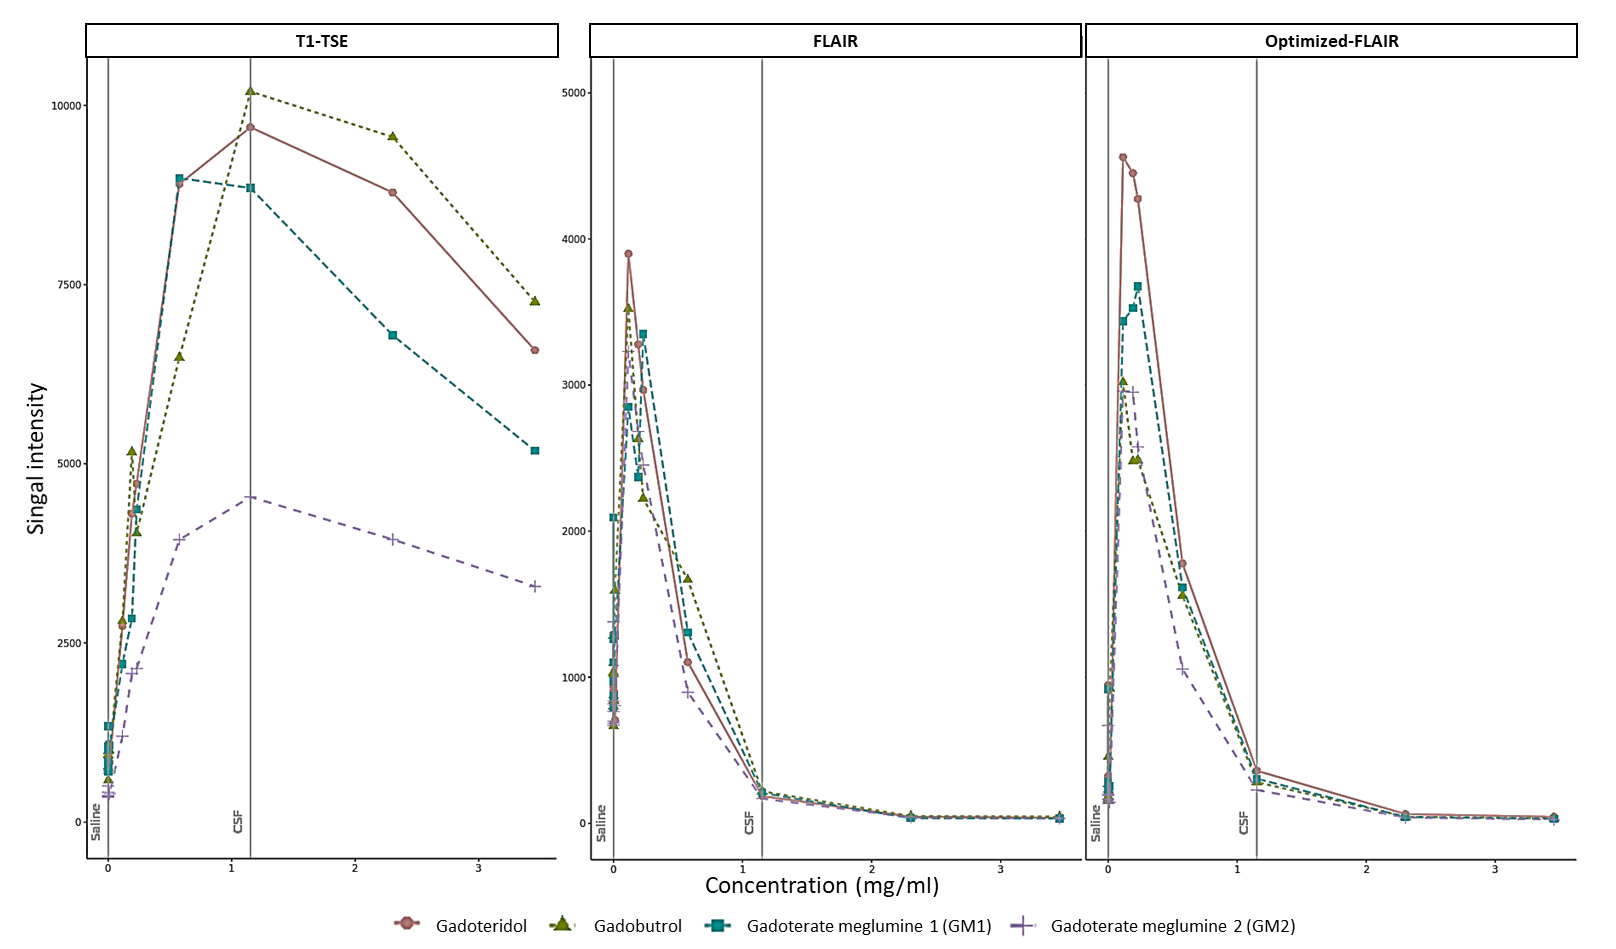
Figure 3 shows the mean signal of the three sequences from six slices in each diluted solution. For all sequences, signal intensities increased, peaked, and subsequently diminished with increasing concentrations. The concentration at which signal intensity peaked varied across each sequence, and GBACs. In the T1-TSE, the mean signal reached a maximum signal intensity at the extravasated Gd concentration in the CSF (T1-TSE: concentration(SImax) = 1.152mg/ml) for gadobutrol, followed by gadoteridol, and GM2, while GM1 peaked at 0.576mg/ml. For the sequence based on inversion recovery, the peak was reached at smaller gadolinium concentration (FLAIR: concentration(SImax) = 0.1152mg/ml, Optimized-FLAIR: concentration(SImax) = 0.1152mg/ml), with the Optimized-FLAIR showing the highest SI (FLAIR: SImax = 3899; Optimized-FLAIR: SImax = 4560). In both FLAIR, gadoteridol showed the highest SI of all four GBACs, followed by gadobutrol, GM1, and GM2 in the classical FLAIR, and by GM1, gadobutrol, and GM2 in the Optimized FLAIR.By comparing CNR values (Figure 4), similar results were observed for the T1-TSE sequence with a peak reached at the reference Gd concentration by gadoteridol, gadobutrol, and GM2, while GM1 peak was for lower concentration. For both Flair, the highest SI was reach by gadobutrol and gadoteridol.Discussion
In this study, we present a customized phantom that can be used to assess the performances of various sequences to detect low-Gd concentrations. We use that tool to evaluate the detection of different concentration of four commercial GBCAs by clinical sequences used to detect signal enhancement. Based on SI and CNR, we found that FLAIR was most efficient than the classical T1-TSE sequence to detect very low dose of gadolinium. Moreover, the FLAIR sequence can be made more sensitive to subtle gadolinium enhancements by modifying refocusing angle schemes. This result is of interest for diseases like MS where subtle gadolinium leakage have been identified in the meninges [4], [5].Acknowledgements
No acknowledgement found.References
[1] A. J. Thompson et al., « Diagnosis of multiple sclerosis: 2017 revisions of the McDonald criteria », Lancet Neurol., vol. 17, no 2, p. 162‑173, févr. 2018, doi: 10.1016/S1474-4422(17)30470-2.
[2] R. J. McDonald et al., « Gadolinium Deposition in Human Brain Tissues after Contrast-enhanced MR Imaging in Adult Patients without Intracranial Abnormalities », Radiology, vol. 285, no 2, p. 546‑554, juin 2017, doi: 10.1148/radiol.2017161595.
[3] F. Berger et al., « Gadolinium distribution in cerebrospinal fluid after administration of a gadolinium-based MR contrast agent in humans », Radiology, vol. 288, no 3, p. 703‑709, 2018.
[4] P. Eisele et al., « Investigation of leptomeningeal enhancement in MS: a postcontrast FLAIR MRI study », Neurology, vol. 84, no 8, p. 770‑775, févr. 2015, doi: 10.1212/WNL.0000000000001286.
[5] M. Absinta et al., « Leptomeningeal gadolinium enhancement across the spectrum of chronic neuroinflammatory diseases », Neurology, vol. 88, no 15, p. 1439‑1444, avr. 2017, doi: 10.1212/WNL.0000000000003820.
Figures
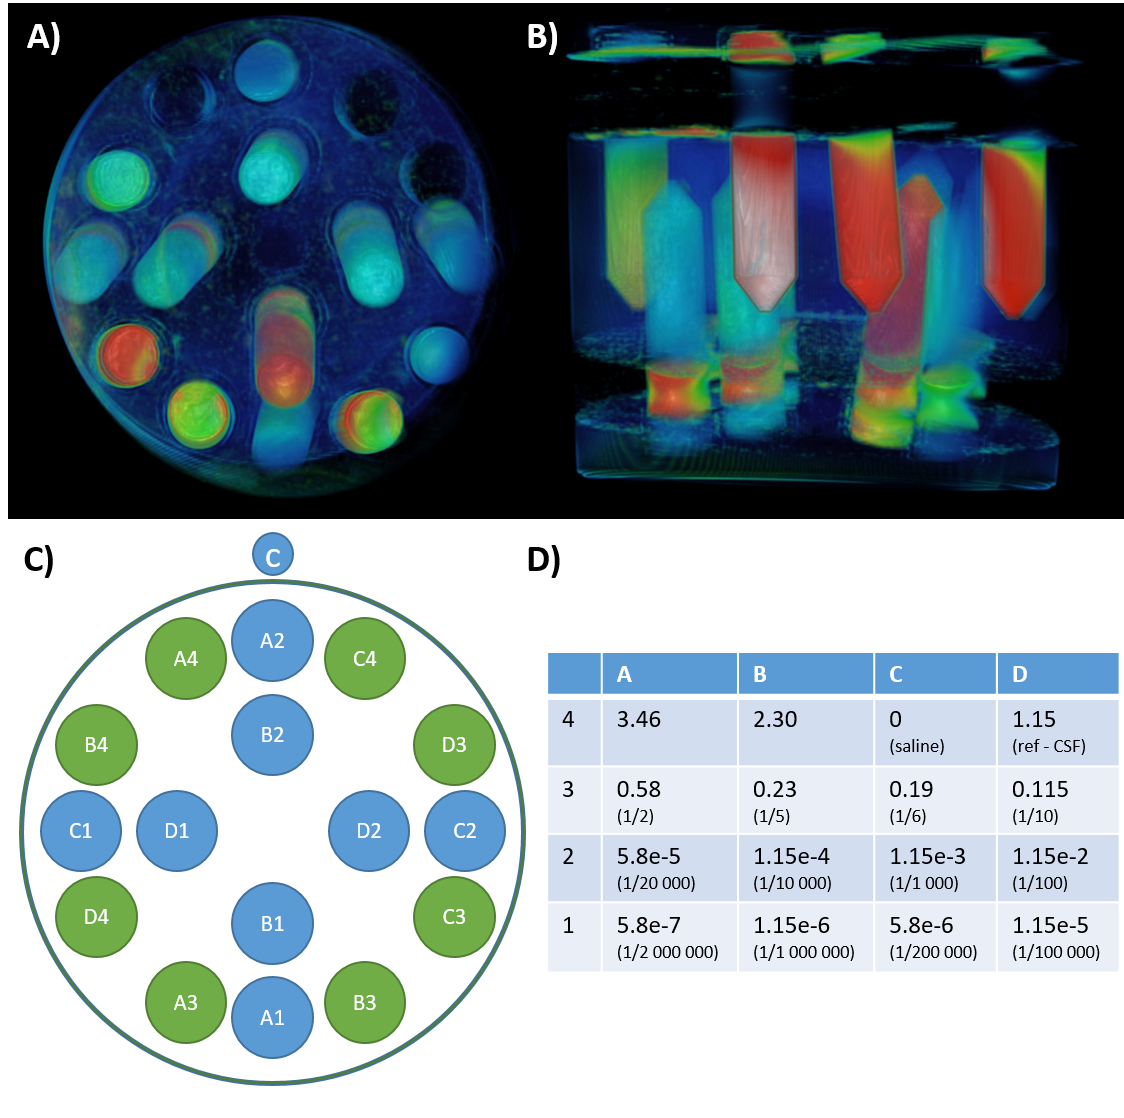
Figure 1: Phantoms design.
We prepared four phantoms (A, B) composed of 16 tubes (C) with variable concentration of four commercially gadolinium-based contrast agents (expressed as mg/ml, D), and filled with agar.
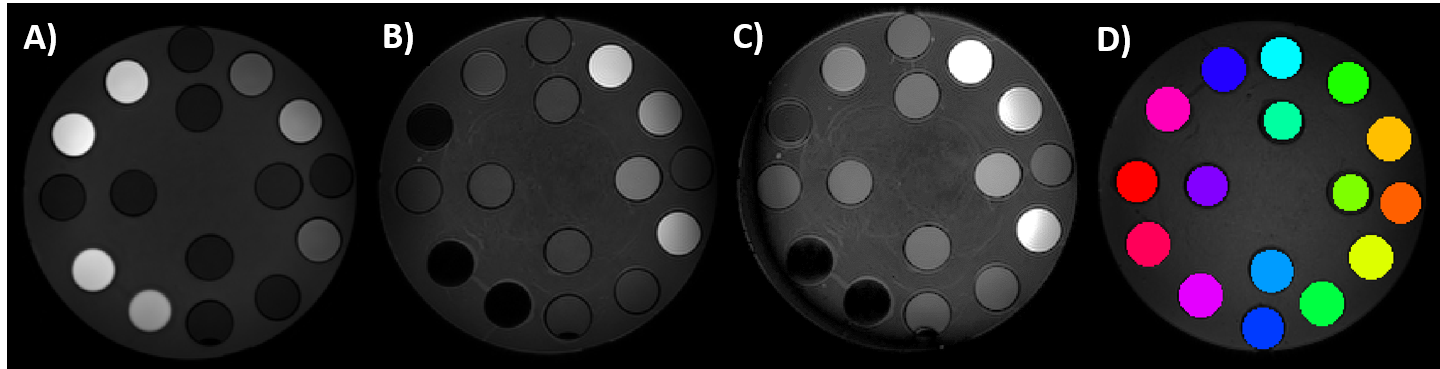
Figure 2: MRI acquisition and segmentation.
A set of three sequences were acquired a T1-weighted Spin Echo (A), a Fluid Attenuated Inversion-Recovery (FLAIR, B), and an Optimized-FLAIR with dedicated refocusing angle schemes (C). To extract mean signal intensity over six continuous slices, each tubes were segmented and labelled on a T1-weighted Turbo Field Echo (D).