1440
Development of a fluorescent, MRI contrast agent (Gd-DOTA-coumarin) to improve measurement of Gd concentration1Radiology, Weill Cornell Medicine, New York, NY, United States, 2Radiology, Grossman School of Medicine, New York, NY, United States
Synopsis
Measurement of gadolinium concentration in DCE-MRI is a significant step but remains challenging. In this study, we developed a novel Gd-based contrast agent Gd-DOTA-coumarin that can directly quantify gadolinium concentration through florescence measurement using a plate reader. The preliminary results shows that the longitudinal relaxivity in plasma at 7T is 8.6 mM-1s-1 and the limit of detection for the fluorescence measurement is 100 µM in blood. This new agent has also been successfully used for in vivo MRI experiments.
Introduction
Quantitative analysis of Dynamic Contrast Enhanced (DCE) MRI data relies on accurate estimation of Gd-based contrast agent (GBCA) concentration time course in tissue. However, it remains challenging to estimate the GBCA concentration from DCE-MRI signal intensity due to various factors affecting the MRI signal intensities, such as GBCA relaxivity in tissue, hematocrit, rf field inhomogeneity, and partial volume effect. Such conversion is even more difficult to do with blood in small vessels that is often used for measurement of the Arterial Input Function (AIF).1 The significance of accurate measurement of AIF is paramount to modeling tumor contrast kinetic parameters.2 In order to address this challenge, we propose using a GBCA with a fluorescence capability such that the GBCA concentration in blood or urine samples can be easily measured using a plate reader commonly available in laboratories. Here, we present the preliminary results from the development of a novel GBCA sensitized with a coumarin moiety.Methods
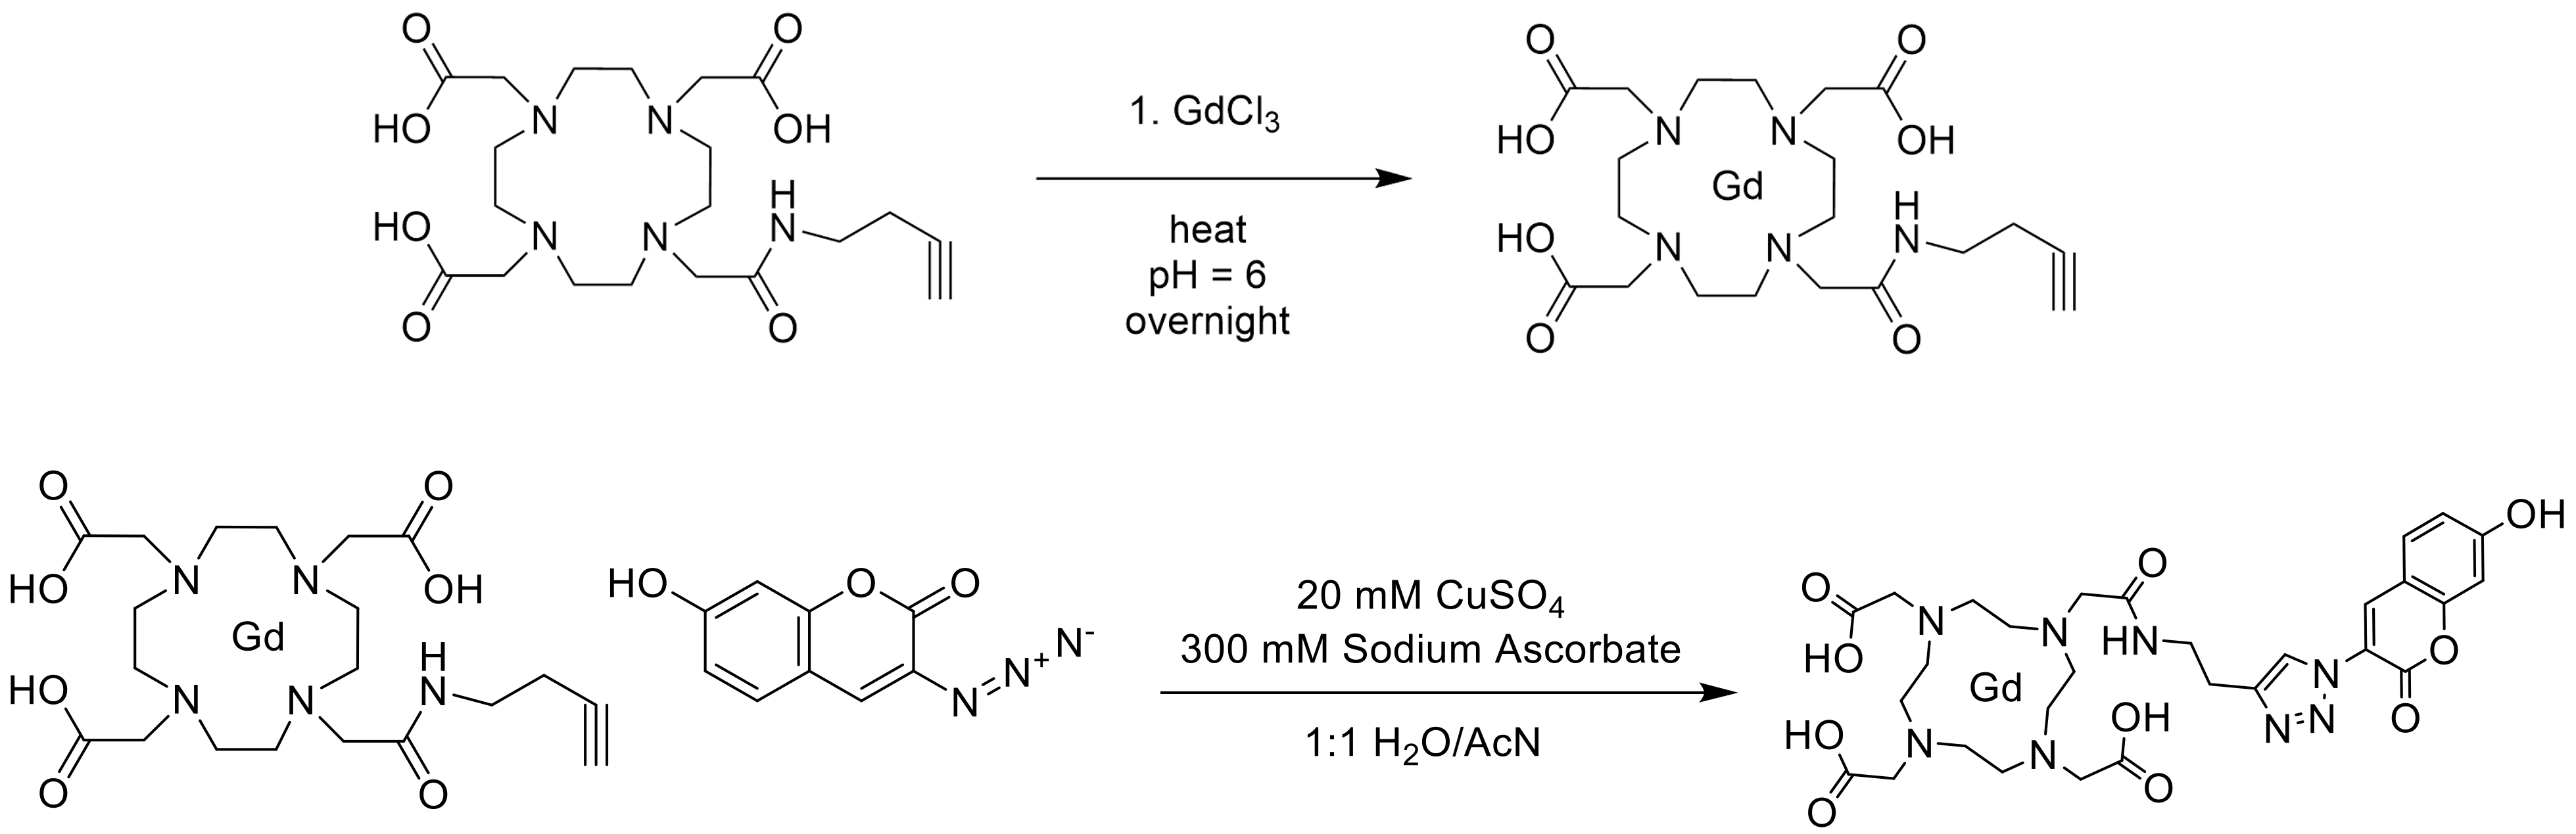
Synthesis of Gd-DOTA-coumarin (Gd-DOTA-butyne-3-azido-7-hydroxycoumarin): Figure 1 illustrates the synthesis of our novel contrast agent. In a dry vessel with DOTA-butyne (1 eq, 2x10⁻⁵ mol, Macrocyclics), GdCl3 · 6H2O (1.1 eq, 2x10⁻⁵ mol, Thermo Scientific) was added and stirred overnight in 5 mL sodium acetate/acetic acid buffer at 60°C. After filtration and lyophilization, Gd-DOTA-butyne (1 eq, 2x10⁻⁵ mol) was dissolved in 1 mL of AcN/H2O. 3-azido-7 hydroxycoumarin (1.1 eq, 2x10⁻⁵) was also dissolved in 1 mL AcN/H2O and added to the flask. 1.5 mL 20 mM CuSO4 was added to the reaction vessel. To start the CuAAC reaction, 1.6 mL 300 mM sodium ascorbate was added dropwise to the reaction vessel. The reaction was stirred at room temperature overnight and protected from light. After lyophilization, the reaction mixture was passed through a Strata SCX column and a C18 Sep Pak column. The filtered, eluted product was lyophilized to afford an off-white solid. The synthesis of the contrast agent was verified through LCMS (m/z = 813).Florescence measurements: All measurements were taken on an Infinite M1000 Pro Microplate Reader. Fluorescence was done at excitation of 390 nm and emission was read at 448 nm. Measurements were taken in PBS, rat blood, and plasma in triplicate.
Measurement of longitudinal relaxivity (r1): All MRI experiments were conducted using a Bruker 7T MRI system. Relaxivity measurements were taken via the RARE-VTR sequence provided by the vendor. We reported the relaxivity of this contrast agent in three different media: PBS, 5 g/dL albumin in PBS, and rat plasma in duplicate trials.
MRI in-vivo experiments: Six-to-eight-week-old C3H/HeJ mice (n=2) were inoculated with SCCVII tumors on the flank. A bolus of our contrast agent in saline at the dose of 0.1 mmol/kg was injected through a tail vein catheter, starting 3 minutes after the start of data acquisition. A T1-FLASH sequence (TE/TR: 3 ms/16 ms) was used with 16 repetitions to acquire T1-weighted images over 90 minutes with respiratory gating.
Results
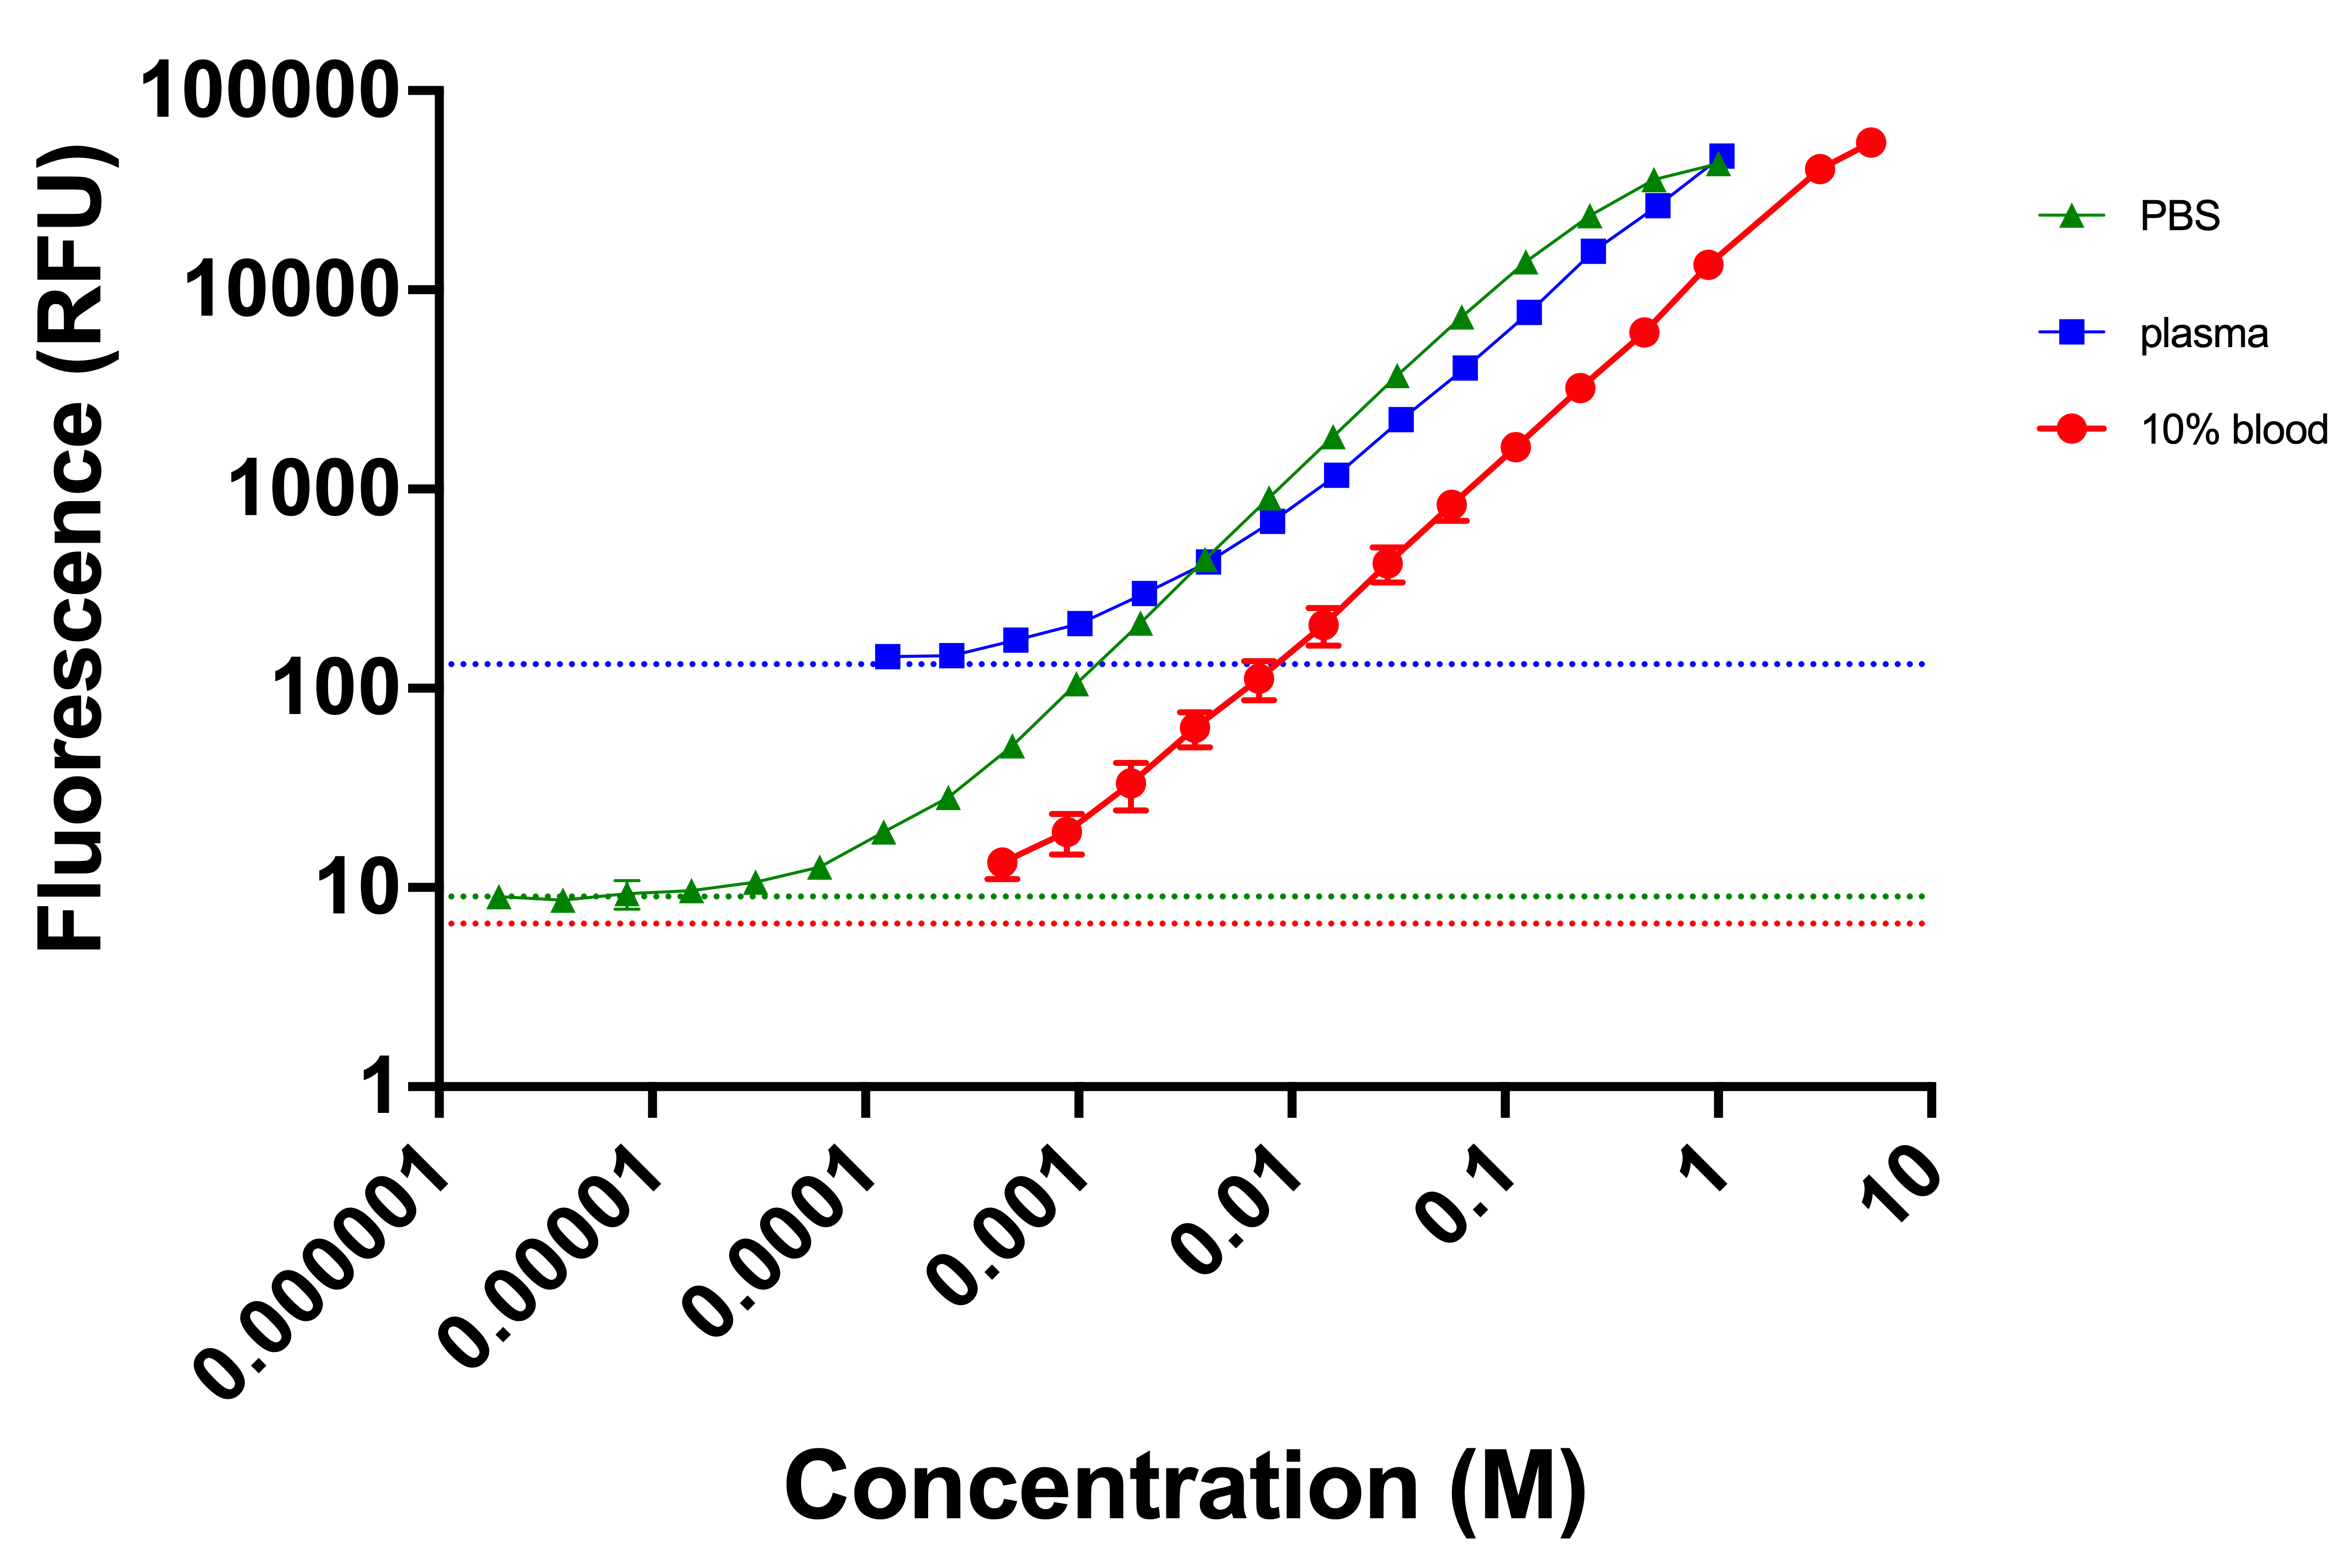
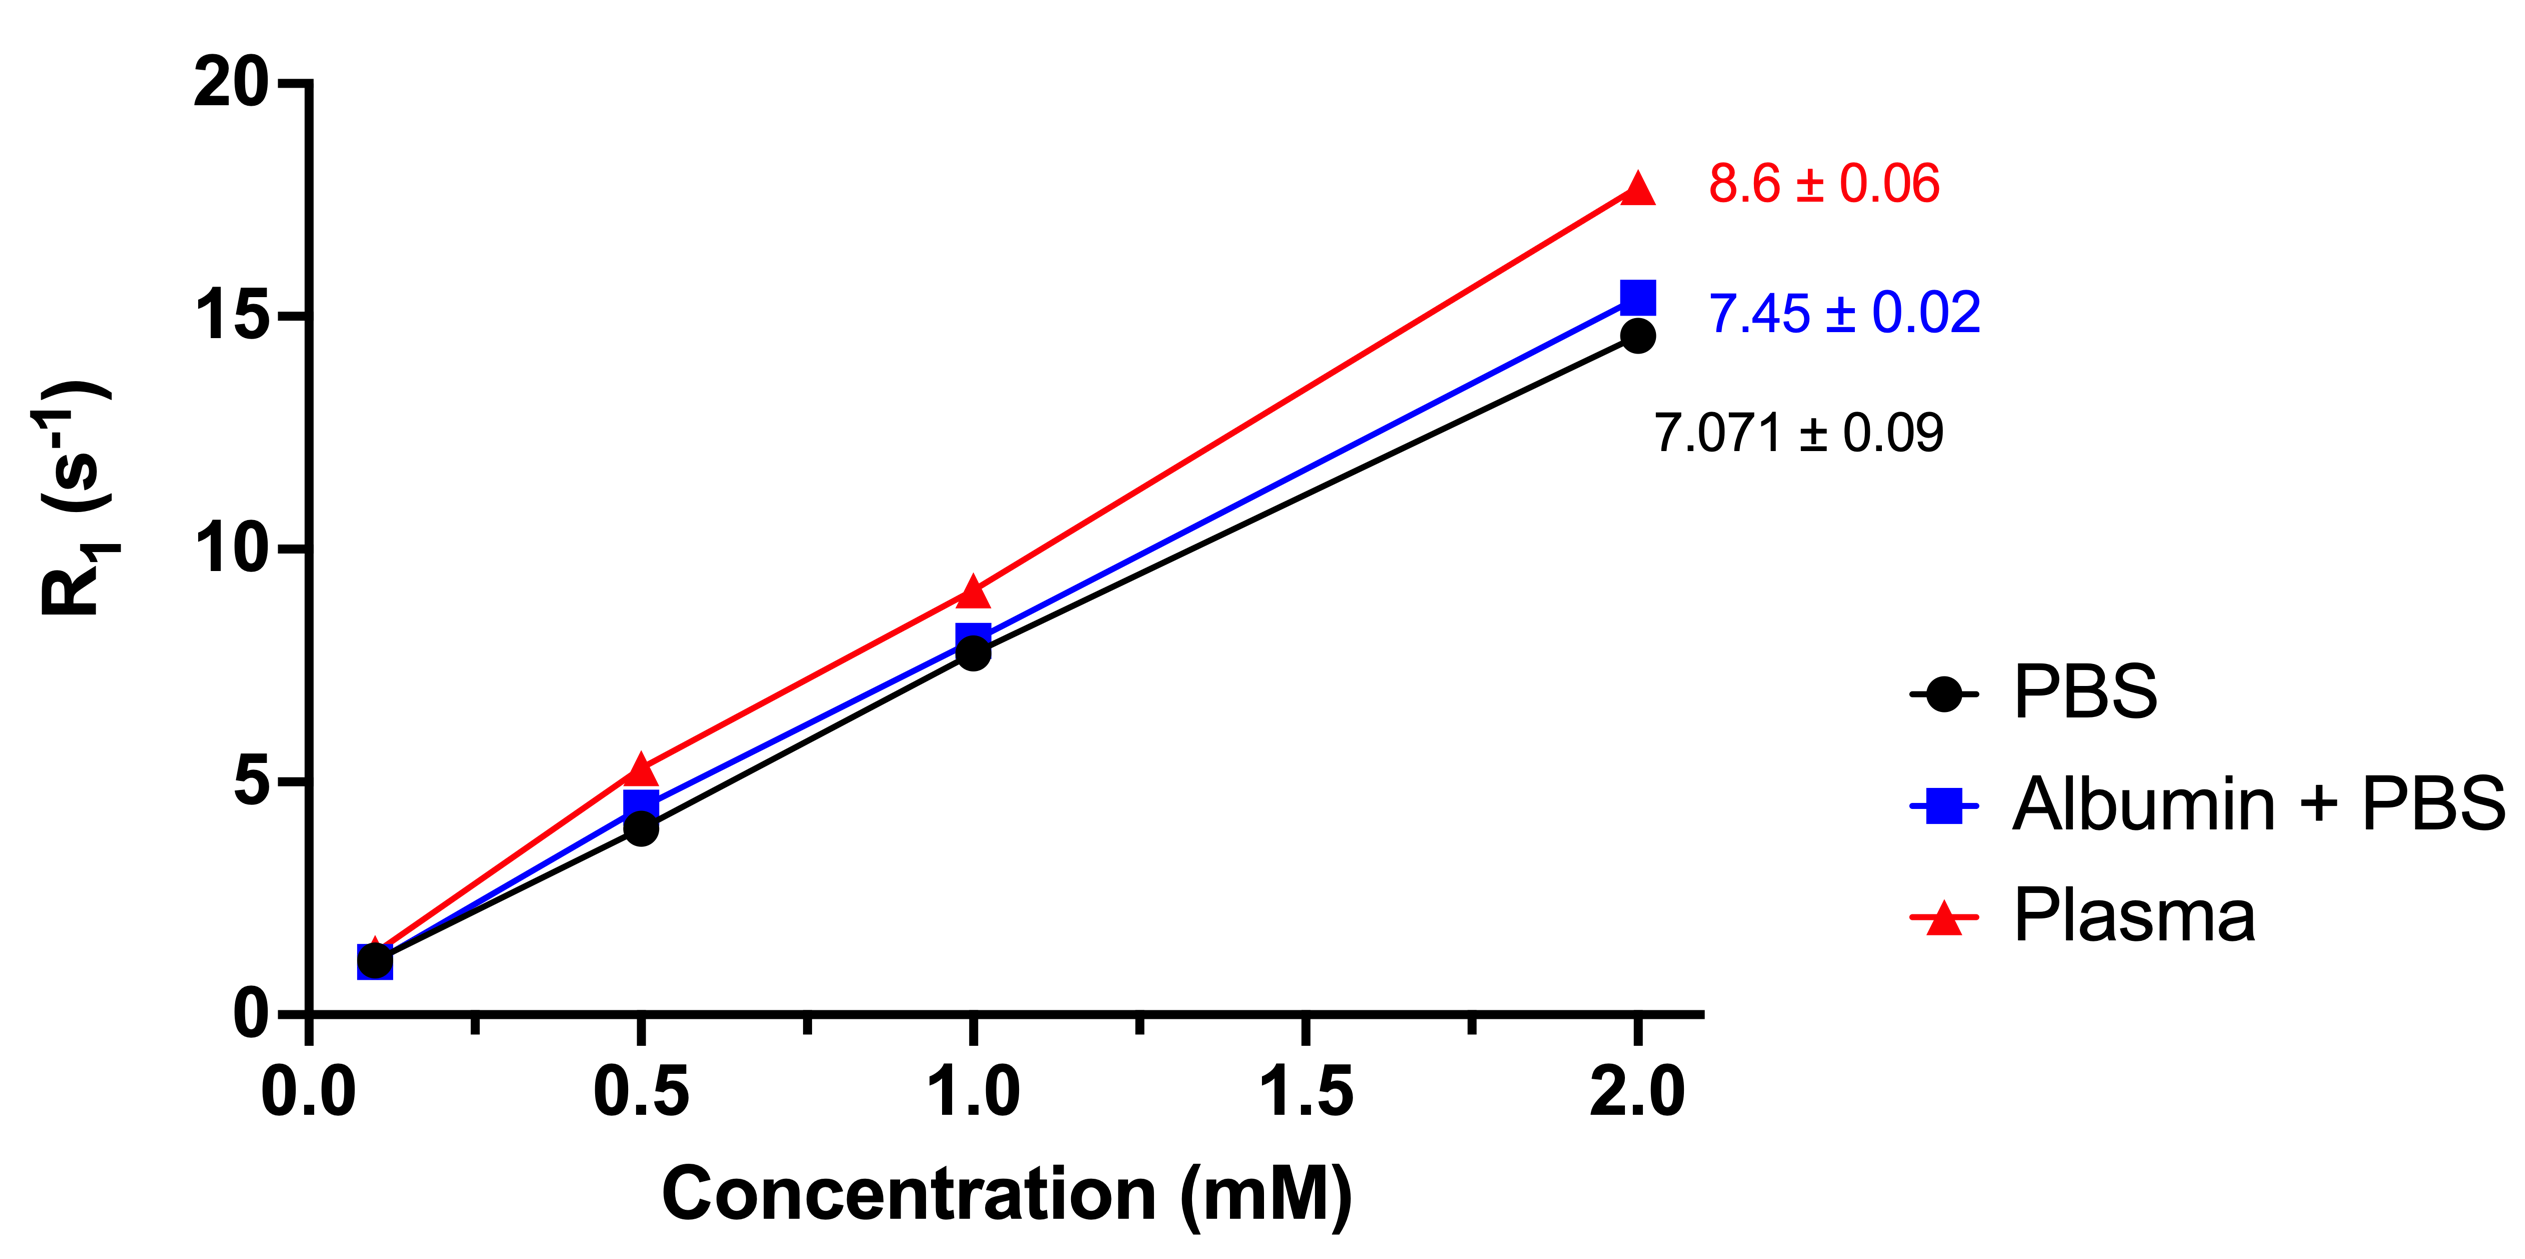
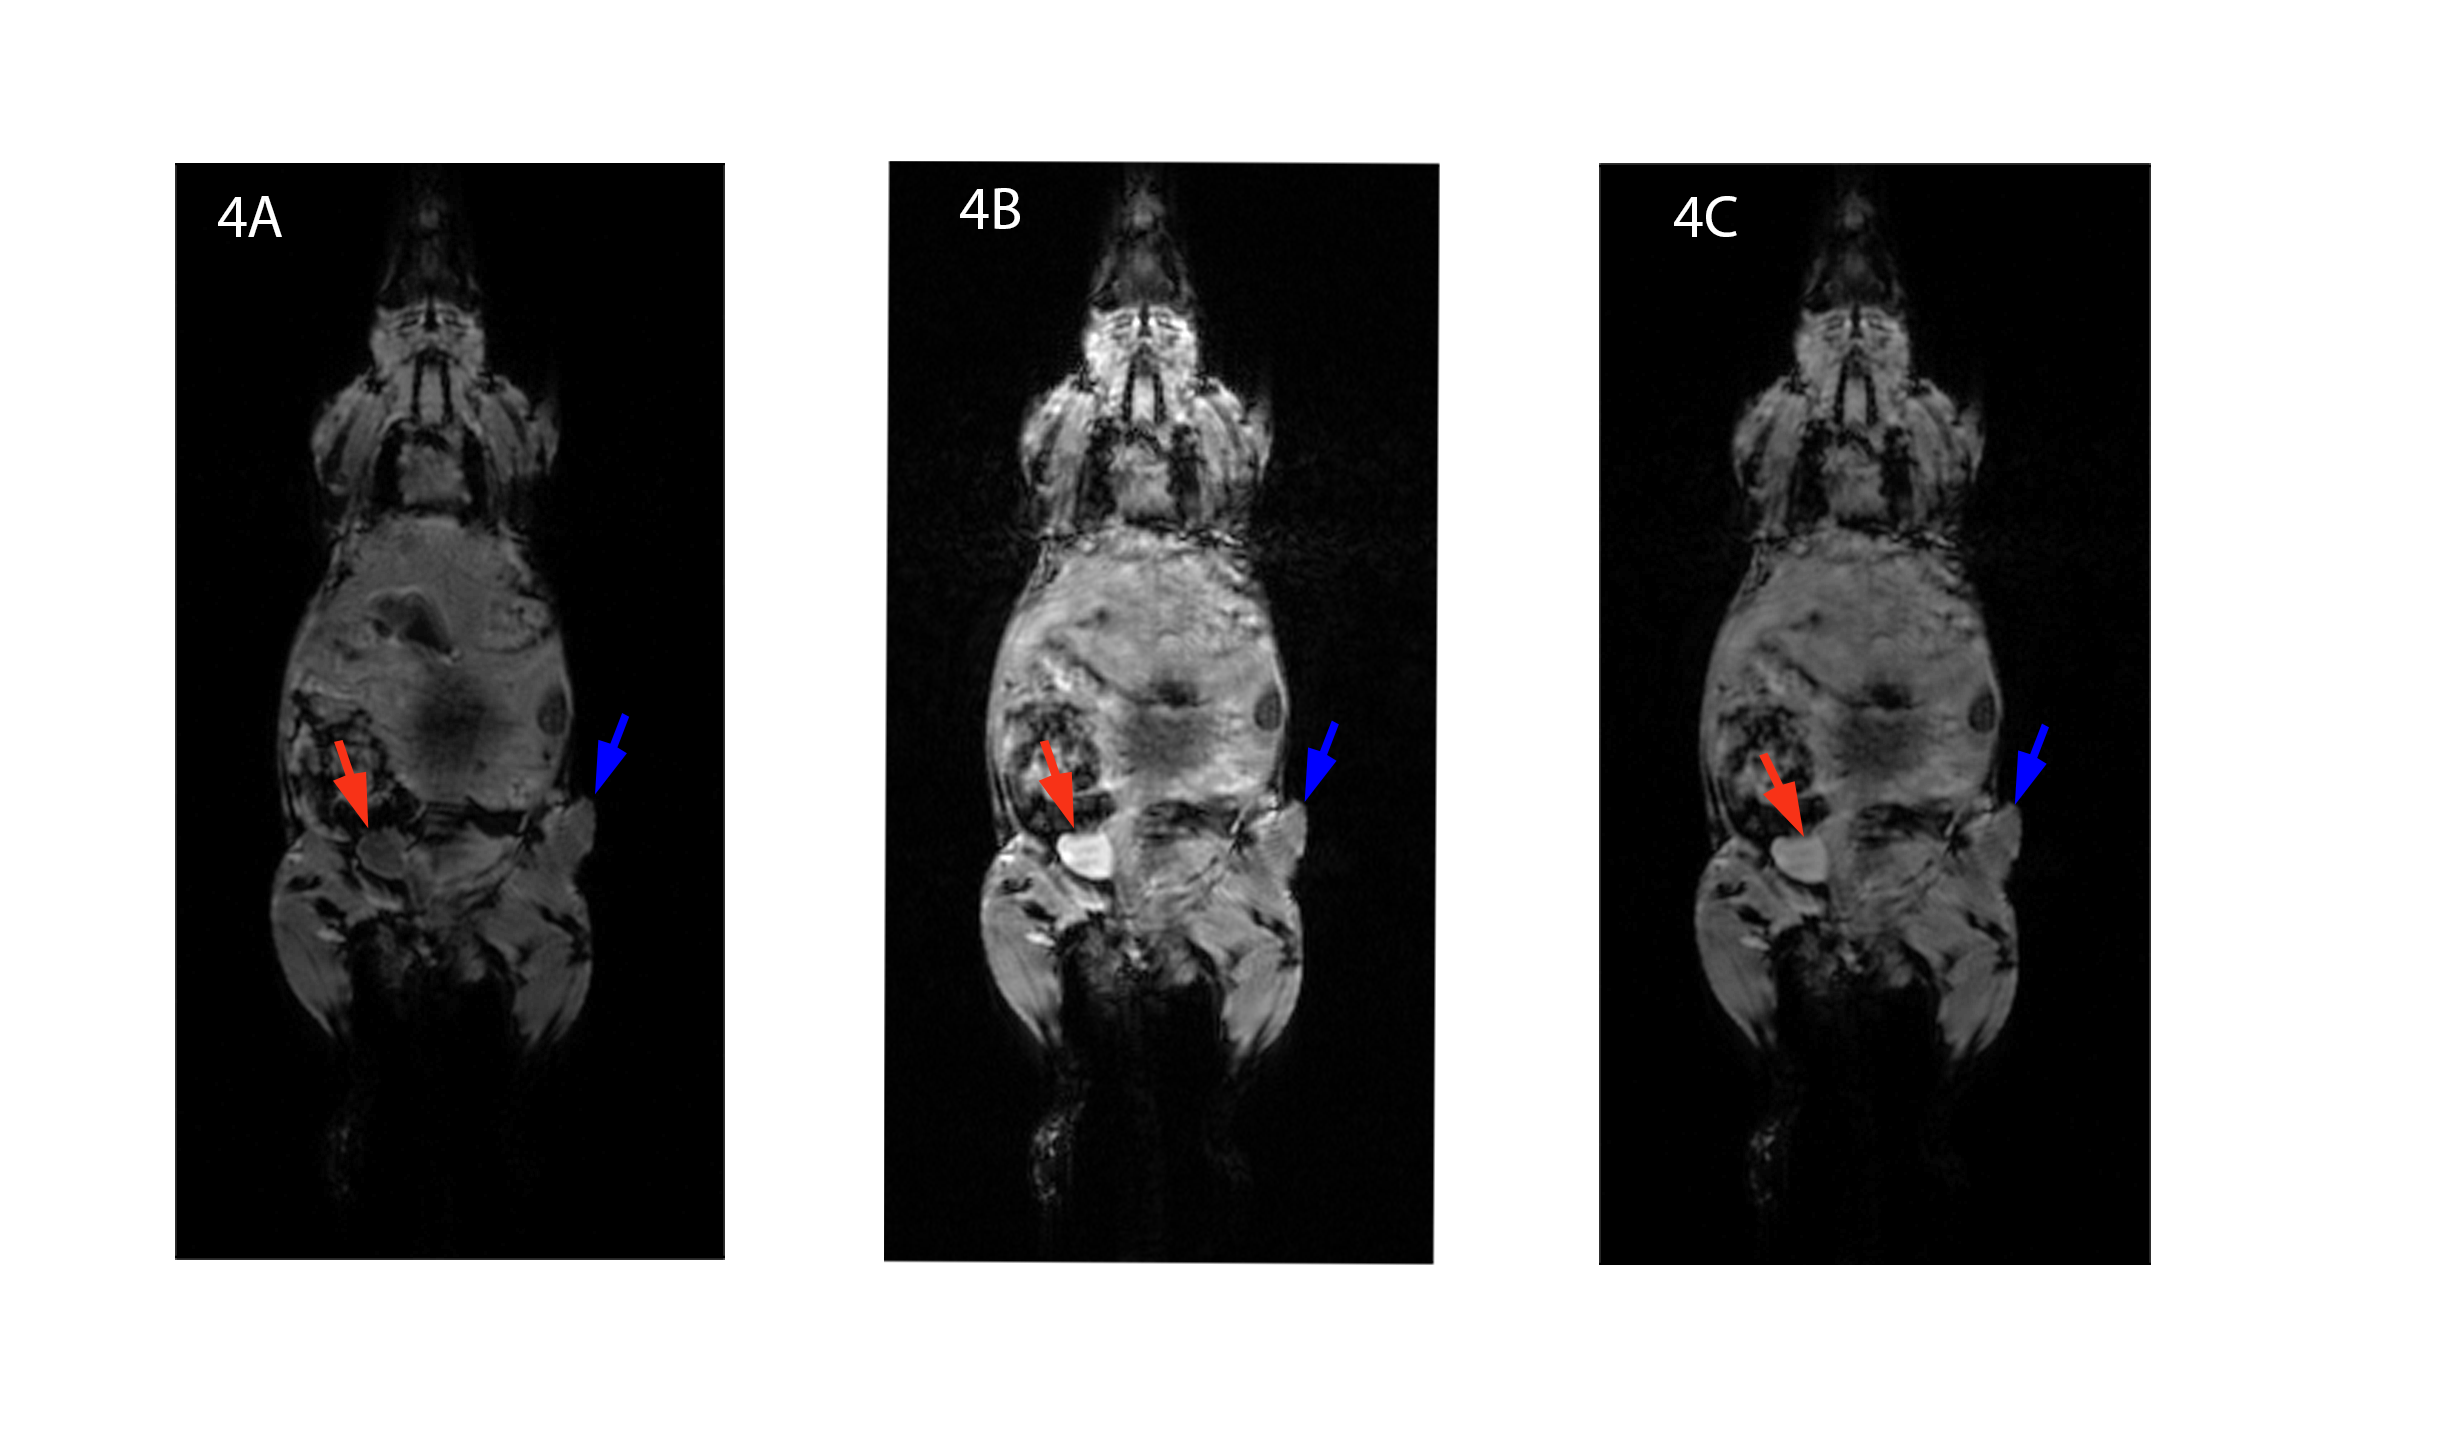
Figure 2 reports the standard curves for the fluorescent data. The data suggest that the limit of detection is approximately 100 µM in blood, 10 µM in PBS, and 100 µM in plasma. Figure 3 demonstrates the variability of relaxation among different biological media. Based on the linear regression analysis of the data, the longitudinal relaxivity, r1, in plasma is 8.6 mM-1s-1 at room temperature. Figure 4 exhibits the enhancement of the contrast agent following a bolus injection. Figure 4A shows a baseline image. Figure 4B shows the T1-weighted image 20 minutes after the bolus injection, and figure 4C shows the final image. We can observe the increased enhancement of the bladder (red arrows) and tumor (blue arrows) following the injection in figures 4B and 4C.Discussion/Conclusion
In this study, we have successfully synthesized a novel GBCA with florescent properties, which can be used to quantify gadolinium concentration. The fluorescent properties are understood through the 3-azido-7-hydroxycoumarin, which is a profluorophore.3 Following the copper(I)-catalyzed alkyne-azide cycloaddition (CuAAC) click reaction to DOTA-butyne, the quantity of the molecule, and corresponding gadolinium ion, is observed through fluorescence. We also denote the increased relaxivity of the contrast agent as the media becomes denser with protein, suggesting some effect of macromolecules on relaxivity. However, the relative similarity among the relaxivities measured in plasma, albumin and PBS suggests that our contrast agent does not bind to albumin, specifically, within in-vivo conditions and will not be greatly affected by human serum condition, a concern in clinical settings.4 The enhancement in the T1-weighted images demonstrates the biodistribution and elimination of the contrast agent over an hour period. In future studies, the accuracy of DCE-MRI with this contrast agent can be assessed by collecting blood samples during and/or following MR scans and measurement of GBCA concentrations via fluorescence and Induced Coupled Plasma Mass Spectrometry, the gold standard in metal detection.Acknowledgements
NIH R01CA160620, NIH R01CA219964, UH3CA228699References
1. A. Bharadwaj Das, J. Tranos, J. Zhang, Y. Wadghiri, S. Kim. Estimation of Contrast Agent Concentration in DCE-MRI Using Two Flip Angles. Investigative Radiology (in press)
2. W. Huang, Y. Chen, A. Fedorov, X.Li, G. Jajamochiv, D. Malyarenko, M. Aryal, P LaViolette, M. Oborski, R. O’Sullivan, R. Abramsom, J. Kalpathy-Cramer, J. Mountz, C. Laymon, M. Muzi, P. Kinahan, K. Schmainda, Y. Cao, T. Chenevert, B. Taouli, T. Yankeelov, F. Fennessy, and X. Li. The Impact of Arterial Input Function Determination Variations on Prostate Dynamic Contrast-Enhanced Magnetic Resonance Imaging Pharmacokinetic Modeling: A Multicenter Data Analysis Challenge. Tomography. 2016 Mar; 2(1): 56–66.
3. K. Sivakumar, F. Xie, B. Cash, S. Long, H. Barnhill, Q.Wang. A Fluorogenic 1,3-Dipolar Cycloaddition Reaction of 3-Azidocoumarins and Acetylenes. Org. Lett. 2004, 6, 24, 4603–4606.
4. F. Giesel, H. von Tengg-Kobligk, I. Wilkinson, P. Siegler, C. von der Lieth, M. Frank, K. Lodemann, and M. Essig. Influence ofHuman Serum Albumin on Longitudinal and Transverse Relaxation Rates (R1 and R2) of Magnetic Resonance Contrast Agents. Invest Radiol . 2006 Mar;41(3):222-8.
Figures