1439
Quantification of Gadolinium Deposition in the Brain Using Quantitative MRI1Department of Radiology, Linköping University, Linköping, Sweden, 2Center for Medical Image Science and Visualization (CMIV), Linköping University, Linköping, Sweden, 3Department of Medical Radiation Physics, Linköping University, Linköping, Sweden
Synopsis
Gadolinium-based contrast agents (GBCAs) used for MRI are known to cause gadolinium depositions in the brain. In this study we show that the using quantitative MRI we can detect gadolinium depositions after fewer doses of GBCAs than generally seen on conventional MRI. We included 43 patients that were earlier enrolled in a prospective longitudinal cohort study of early Multiple Sclerosis. All patients had received the linear GBCA Magnevist. Measurements of the longitudinal relaxation rate R1 showed a significant increase in dentate nuclei, globi pallidi and frontal grey matter.
Introduction
Gadolinium-based contrast agents (GBCAs) used for MRI are known to cause gadolinium depositions in several areas of the human body, including the brain, skin and bone(1). After the initial report in 2014(2), gadolinium depositions in the brain have mainly been found in the dentate nuclei and globi pallidi, mostly associated with linear GBCAs(3,4). There have also been studies indicating gadolinium uptake in the grey matter, thalami, pons and white matter(1,5).Our hypothesis is that using quantitative MRI, we can confirm the gadolinium depositions after fewer doses of GBCAs than generally seen on conventional MRI, without the need for reference areas. Quantitative data makes comparison and follow-up in future studies on gadolinium depositions easier.
Methods
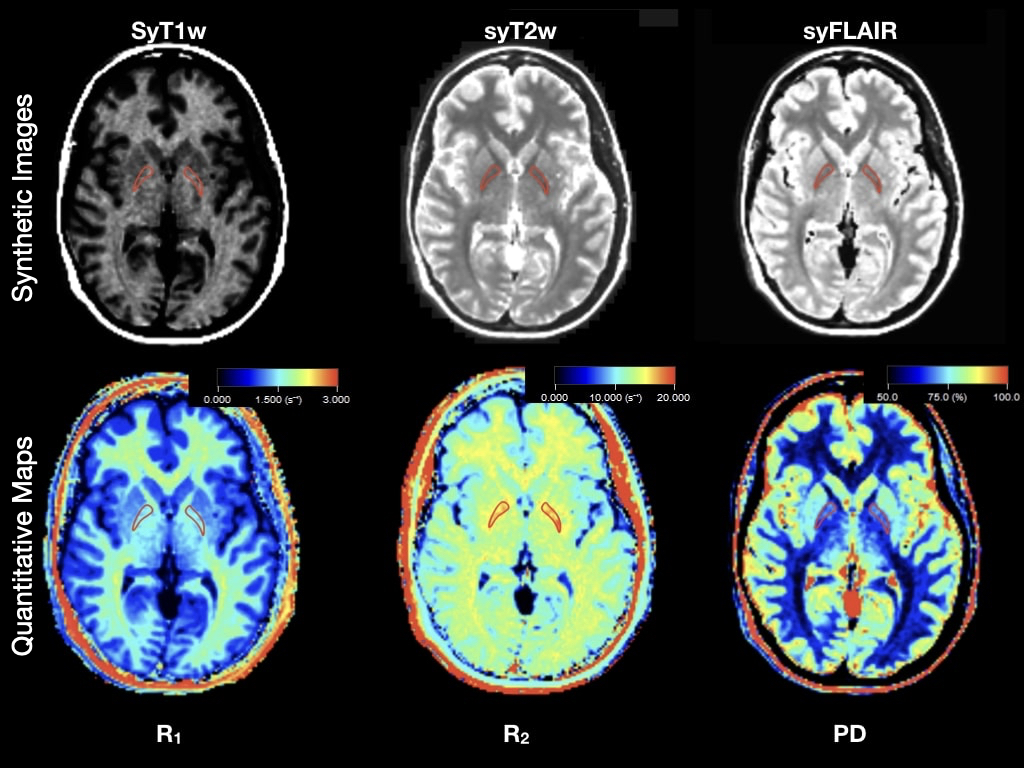
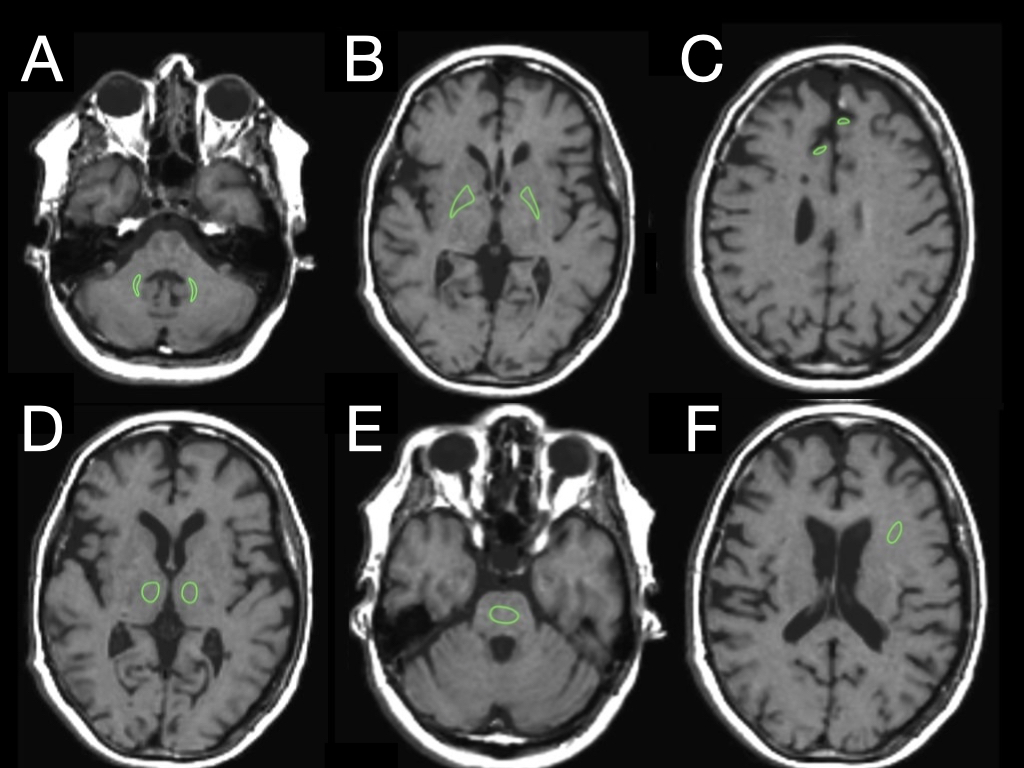
Forty-three patients who were earlier enrolled in a prospective longitudinal cohort study of early Multiple Sclerosis (MS), were included. MR imaging according to a standard clinical MS protocol with the addition of quantitative MRI (qMRI) before and after administration of Magnevist (gadopentetate dimeglumine, 0.2 mL/kg body weight, Bayer HealthCare Pharmaceuticals) was performed at inclusion (baseline) and after one year, two years and four years.Images were acquired on a 1.5T MR imaging scanner (Achieva, Philips Healthcare, Best, the Netherlands) by using an eight-channel phased array head coil. Quantitative images were acquired using the QRAPMASTER sequence(6) and post processed using SyMRI Diagnostic software (SyntheticMR, Linköping, Sweden) see figure 1.We have chosen six areas for our study; two areas that are most established as targets for gadolinium depositions (the dentate nuclei and globi pallidi), and additionally four areas that are often studied regarding gadolinium depositions (the thalami, pons, white matter and frontal cortex grey matter) see figure 2.
All statistical calculations were performed in IBM SPSS Statistics for Macintosh, Version 27.0 (IBM Corp, Armonk NY). A p-value of ≤0.05 was considered significant. The R1 value from the four-year control was compared to the R1 value of the baseline study for each subject using a Paired-Samples T test, which was performed for each of the above-mentioned six areas in the brain. For areas with a significant increase of R1, an Independent-Samples T test was performed to investigate if 4 doses of linear GBCA gave a stronger effect than 3 doses of linear GBCA to the increase in R1 in these areas.
Results
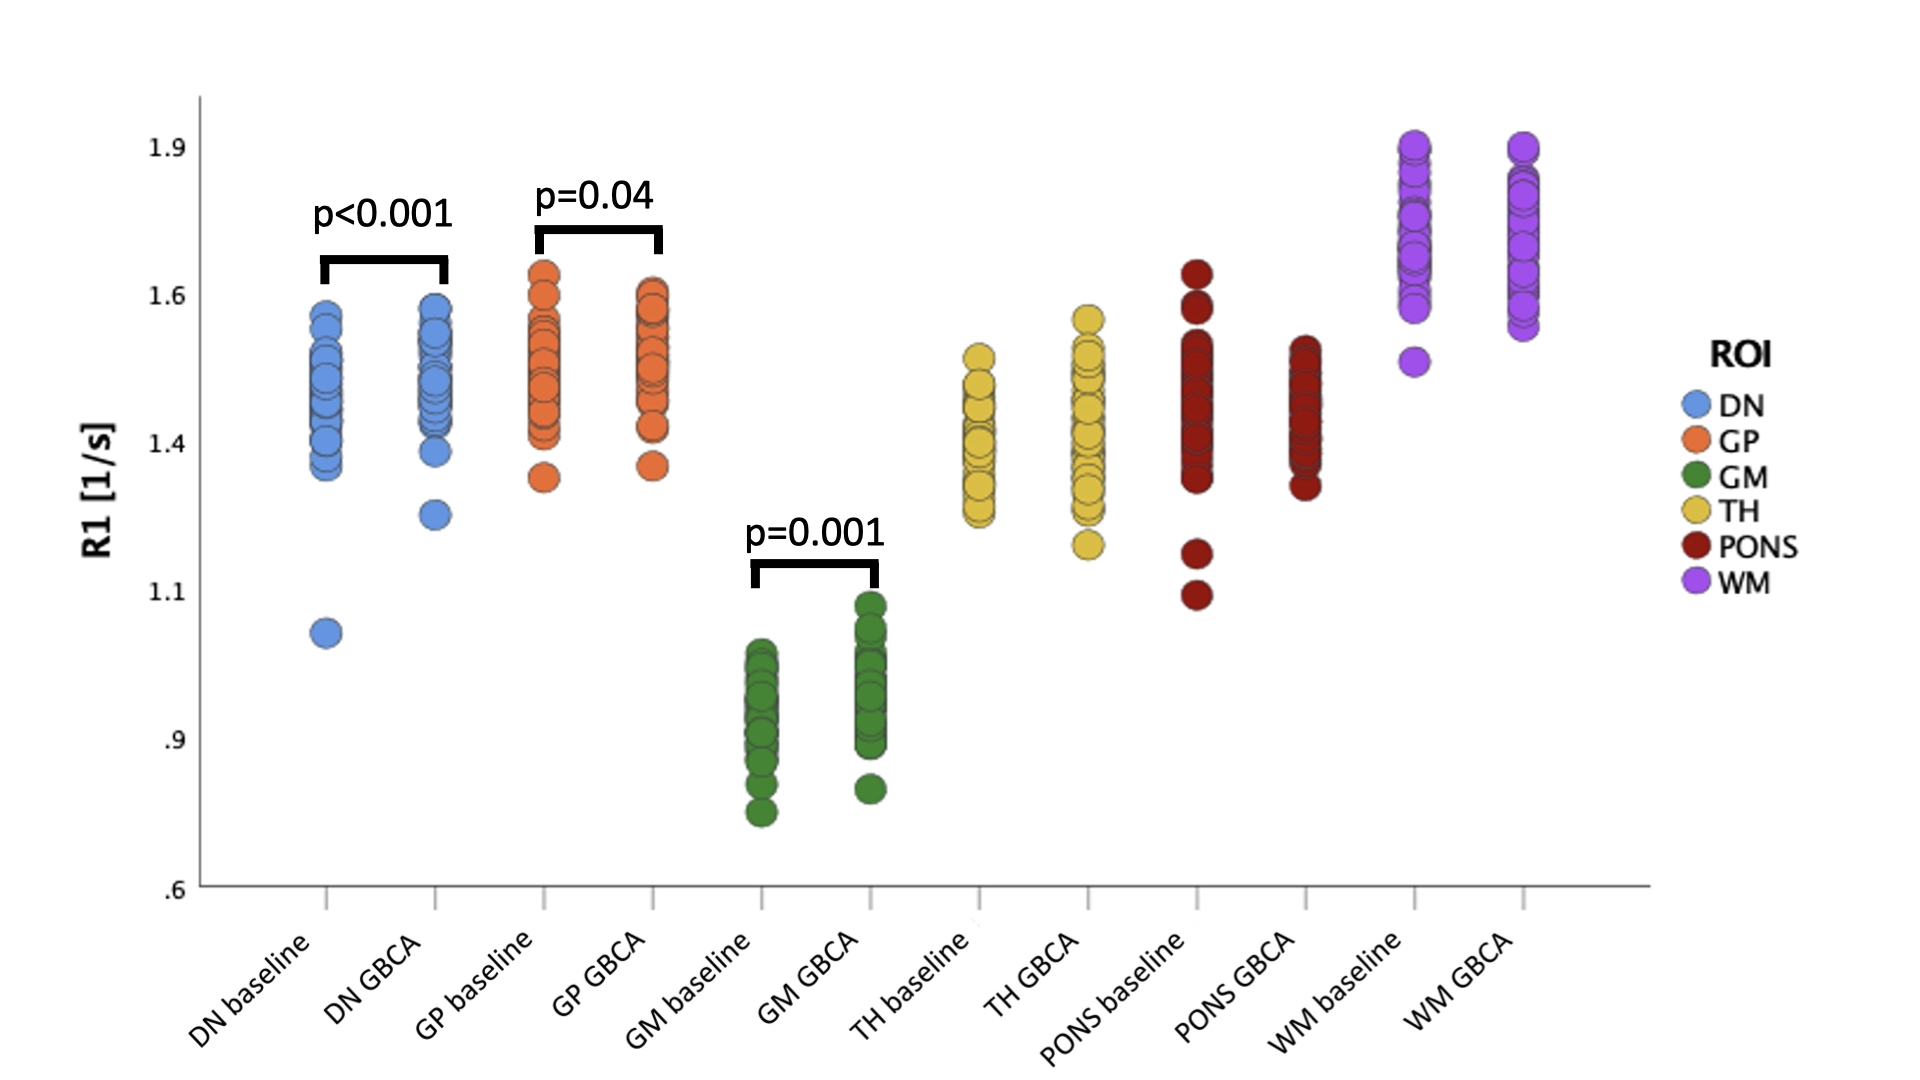
Measurements of the longitudinal relaxation rate R1 in the dentate nuclei, globi pallidi, thalami, pons, white matter and frontal cortex grey matter revealed an increase in R1 from 1.42 to 1.46 s-1 (p<0.001) in the dentate nuclei, an increase in R1 from 1.47 to 1.49 s-1 (p=0.04) in the globi pallidi, and an increase in R1 from 0.89 to 0.92 s-1 (p=0.005) in the frontal cortex grey matter. There was no significant change in R1 in the thalami (1.35 to 1.37 s-1, p=0.17), pons (1.41 to 1.40 s-1, p=0.57) or white matter (1.69 to 1.70 s-1, p=0.37) (Figure 3).Discussion
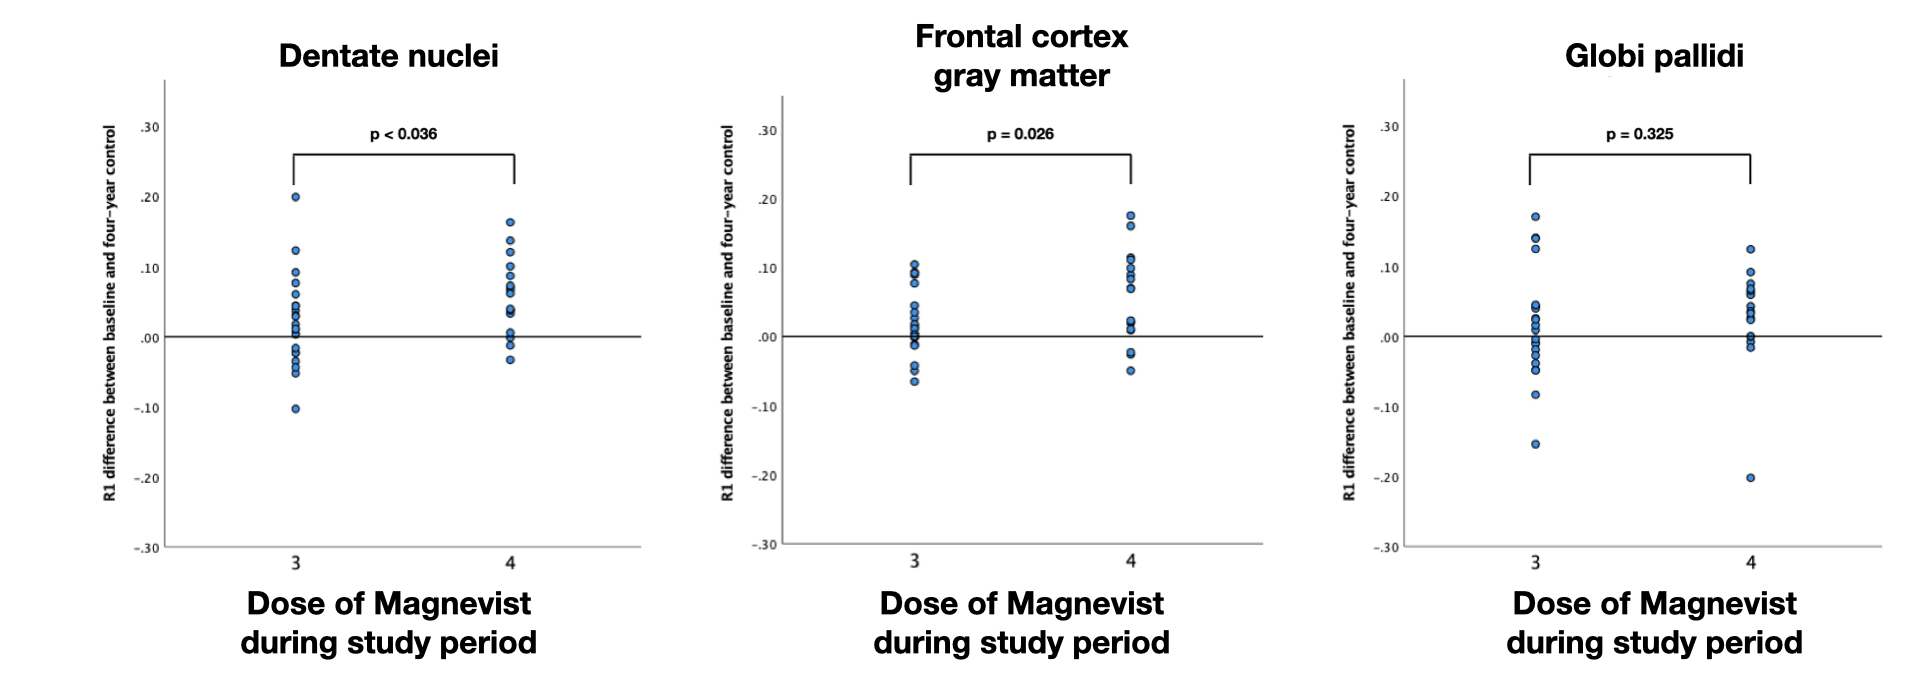
This study is to our knowledge the first to use quantitative MRI (quantitatively measured longitudinal relaxation) in longitudinal data, measuring gadolinium depositions over time, in our case in six areas of the brain following 3.4 doses (mean) of linear GBCA administration. R1 was significantly higher in the dentate nuclei, globi pallidi and frontal cortex grey matter following GBCA administration, whereas there was no difference in R1 in the pons, thalami or white matter. These findings of increased R1 in the dentate nuclei, globi pallidi and frontal cortex grey matter are consistent with previous findings(4,7,8,9,10). Subgroup analyses regarding differences between 3 and 4 GBCA doses and R1 increase showed a dose-dependent association of GBCA doses and R1 increase in the dentate nuclei and frontal cortex grey matter, no statistical significance was obtained in the globi pallidi seen in Figure 4. Outliers in this group are a possible explanation for this result.Conclusion
To conclude, quantitative MRI offers an alternative to conventional MRI for detecting and comparing gadolinium depositions in the brain, which can be useful in future studies regarding the distribution and toxicity of gadolinium depositions. This method potentially provides detection of gadolinium deposition after fewer doses of GBCA (compared to conventional MRI) without using reference areas which may be subjected to gadolinium depositions, in addition to providing quantitative data with fewer methodological limitations than conventional MRI.Acknowledgements
We thank Dr. Irene Håkansson, PhD, and Professor Jan Ernerudh, PhD for sharing data, and Lars Valter, Consulting Statistician, for assistance with statistical analyses.References
1. Ramalho M, Ramalho J, Burke LM, Semelka RC. Gadolinium Retention and Toxicity—An Update. Adv Chronic Kidney Dis [Internet]. 2017;24(3):138–46. Available from: http://dx.doi.org/10.1053/j.ackd.2017.03.004
2. Kanda T, Ishii K, Kawaguchi H, Kitajima K, Takenaka D. High signal intensity in the dentate nucleus and globus pallidus on unenhanced T1-weighted MR images: Relationship with increasing cumulative dose of a gadoliniumbased contrast material. Radiology. 2014;270(3):834–41.
3. Radbruch A, Weberling LD, Kieslich PJ, Eidel O, Burth S, Kickingereder P, et al. Gadolinium retention in the dentate nucleus and globus pallidus is dependent on the class of contrast agent. Radiology. 2015;275(3):783–91.
4. Choi JW, Moon WJ. Gadolinium deposition in the brain: Current updates. Korean J Radiol. 2019;20(1):134–47.
5. Kanda T, Fukusato T, Matsuda M, Toyoda K, Oba H, Kotoku J, et al. Gadolinium-based contrast agent accumulates in the brain even in subjects without severe renal dysfunction: Evaluation of autopsy brain specimens with inductively coupled plasma mass spectroscopy. Radiology. 2015;276(1):228–32.
6. Warntjes JBM, Dahlqvist O, Lundberg P. Novel method for rapid, simultaneous T1, T2*, and proton density quantification. Magn Reson Med. 2007;57(3):528–37.
7. McDonald RJ, McDonald JS, Kallmes DF, Jentoft ME, Murray DL, Thielen KR, et al. Intracranial gadolinium deposition after contrast-enhanced MR imaging. Radiology. 2015;275(3):772–82.
8. Forslin Y, Martola J, Bergendal Å, Fredrikson S, Wiberg MK, Granberg T. Gadolinium Retention in the Brain: An MRI Relaxometry Study of Linear and Macrocyclic Gadolinium-Based Contrast Agents in Multiple Sclerosis. Am J Neuroradiol. 2019;40(8):1265–73.
9. Kuno H, Jara H, Buch K, Qureshi MM, Chapman MN, Sakai O. Global and regional brain assessment with quantitative MR imaging in patients with prior exposure to linear gadolinium-based contrast agents. Radiology. 2017;283(1):195–204.
10. Khant ZA, Hirai T, Kadota Y, Masuda R, Yano T, Azuma M, et al. T1 shortening in the cerebral cortex after multiple administrations of gadolinium-based contrast agents. Magn Reson Med Sci. 2017;16(1):84–6.
Figures