1437
Differentiation of NF2 Loss and S100 Positivity in Meningioma Using Dynamic Susceptibility Contrast MRI with Machine Learning at 3T
Buse Buz-Yalug1, Ayca Ersen Danyeli2,3, Kubra Tan4, Ozge Can5, Necmettin Pamir3,6, Alp Dincer3,7, Koray Ozduman3,8, and Esin Ozturk-Isik1
1Institute of Biomedical Engineering, Bogazici University, Istanbul, Turkey, 2Department of Medical Pathology, Acibadem Mehmet Ali Aydinlar University, Istanbul, Turkey, 3Center for Neuroradiological Applications and Reseach, Acibadem Mehmet Ali Aydinlar University, Istanbul, Turkey, 4Health Institutes of Turkey, Istanbul, Turkey, 5Department of Medical Engineering, Acibadem Mehmet Ali Aydinlar University, Istanbul, Turkey, 6Department of Neurosurgery, Acibadem Mehmet Ali Aydinlar University, Istanbul, Turkey, 7Department of Radiology, Acıbadem Mehmet Ali Aydinlar University, Istanbul, Turkey, 8Department of Neurosurgery, Acıbadem Mehmet Ali Aydinlar University, Istanbul, Turkey
1Institute of Biomedical Engineering, Bogazici University, Istanbul, Turkey, 2Department of Medical Pathology, Acibadem Mehmet Ali Aydinlar University, Istanbul, Turkey, 3Center for Neuroradiological Applications and Reseach, Acibadem Mehmet Ali Aydinlar University, Istanbul, Turkey, 4Health Institutes of Turkey, Istanbul, Turkey, 5Department of Medical Engineering, Acibadem Mehmet Ali Aydinlar University, Istanbul, Turkey, 6Department of Neurosurgery, Acibadem Mehmet Ali Aydinlar University, Istanbul, Turkey, 7Department of Radiology, Acıbadem Mehmet Ali Aydinlar University, Istanbul, Turkey, 8Department of Neurosurgery, Acıbadem Mehmet Ali Aydinlar University, Istanbul, Turkey
Synopsis
Meningiomas are the most frequent primary intracranial and spinal tumors. In this work, we studied the relative cerebral blood volume (rCBV) changes in the meningiomas with NF2 loss and S100 positivity. Meningiomas with NF2-L had lower rCBV than NF2-NL, and S100 positive group had also lower rCBV than S100 negative group. The highest classification accuracies obtained using machine learning applications were 75.6% for NF2 molecular subsets and 75.2% for S100 molecular subsets.
Introduction
Recent efforts have sought to identify prognostic biomarkers that may correlate with treatment response in meningiomas.1 Mutations in neurofibromatosis type 2 (NF2) gene implicate meningioma tumorigenesis.2 Moreover, S100 protein profile, which is one of the popular immunohistochemistry markers, is related to tumor progression and can be distinctive regarding diagnosis, prognosis and/or drug response.3, 4 Recent studies have indicated that rCBV values could be used to identify subtypes of meningiomas.5 Therefore, this study aims to define possible brain perfusion-based signatures for identification of tumors with NF2-copy number loss (NF2-L) or S100 positivity using rCBV maps with classical machine learning algorithms and convolutional neural networks (CNN).Methods
Eighty-three meningioma patients (53F/30M, mean age = 51.13 ± 14.11 years, 39 NF2-L, 51 s100 positivity) were included in this study. The patients were scanned on a 3T Siemens MR scanner (Erlangen, Germany) using a 32-channel head coil before surgery. The brain tumor protocol included pre- and post-contrast (gadolinium DTPA) T1-weighted TSE (TR=500 ms, TE=10 ms), T2-weighted TSE (TR=5000 ms, TE=105 ms), and T2*-weighted gradient-echo echo-planar imaging (EPI) dynamic susceptibility contrast (DSC) MRI (TR=1500 ms, TE=30 ms). NF2-copy number loss was determined by digital droplet PCR using pre-validated Taq-man probes. Immunohistochemical analysis with anti S-100 antibody was used to obtain S100 protein expression. T1-weighted post-contrast images were segmented using 3D slicer version 4.11.0 (http://slicer.org/), and the corresponding tumor masks were registered to rCBV maps using FMRIB Software Library (FSL). The histogram properties such as mean, median, standard deviation, kurtosis and skewness of the rCBV pixel values within the tumor regions were calculated using an in-house program written in MATLAB 2020a (The MathWorks Inc., Natick, MA). A Mann Whitney U test was applied to detect statistically significant differences between the two molecular subsets of meningiomas defined either based on NF2 loss or s100 positivity status. Then, these different histogram properties were used as input features, and supervised machine learning algorithms were used in the Classification Learner application of MATLAB with five-fold cross validation. The class imbalance problem6 was resolved by synthetic minority oversampling technique (SMOTE)7. The overall classification accuracy, specificity and sensitivity were calculated before and after oversampling. Moreover, an in-house program was written to automatically convert the segmented ROI into an RGB image including the slice with the largest tumor area, and the previous and the next slices (Figure 1). Finally, the RGB images were used as inputs to a CNN architecture. For classification task, ResNet508 and Inception V39 were used as pre-trained CNNs to initialize the weights. Then, data was augmented using flipping, cropping, rotating, and adding some noise to the images. Learning rate (LR) was set as 0.001, ADAM optimizer and binary cross entropy loss function were used during training with 100 epochs and a batch size of 8.Results
Median, mean and skewness of the rCBV values were statistically significantly different between tumors with NF2-L and tumors with no copy number loss (NF2-NL) (p<0.0006 for all). The standard deviation, skewness, and kurtosis values of S100 positive (S100+) and S100 negative (S100-) subgroups were also statistically significantly different (p<0.009 for all) (Table 1). The NF2 based subgroups were classified with 75.6% accuracy (sensitivity = 76.9%, specificity = 73.1%) using a linear discriminant analysis. Additionally, the classification accuracy of S100 based subgroups was 73.2% (sensitivity = 54.8%, specificity = 84.3%) using the same algorithm (Table 2). After using SMOTE for oversampling the S100+ class, the accuracy slightly increased to 75.2% (sensitivity = 81.4%, specificity = 68.6%). On the other hand, pretrained Resnet and Inception v3 models could not outperform the machine learning algorithms even though they had upto 90% validation accuracy. The highest test accuracy was 69.2% for the NF2 subgroup using Inception v3, which meant overfitting.Conclusion and Discussion
The result of this study indicated that both NF2 and S100 molecular subsets of meningiomas could be classified using rCBV maps acquired from DSC-MRI. Both NF2-L and S100+ groups have higher rCBV and their distribution is more heterogeneous. Future studies will optimize deep learning approaches using a larger patient cohort.Acknowledgements
This study was supported by the Scientific and Technological Research Council of Turkey (TUBITAK) grant 119S520.References
1. Al-Rashed M, Foshay K, Abedalthagafi M. Recent Advances in Meningioma Immunogenetics. Front Oncol 2020;9:1472-.2. Lee S, Karas PJ, Hadley CC, Bayley V JC, Khan AB, Jalali A, et al. The Role of Merlin/NF2 Loss in Meningioma Biology. Cancers (Basel) 2019;11(11):1633.
3. Bresnick AR, Weber DJ, Zimmer DB. S100 proteins in cancer. Nature Reviews Cancer 2015;15(2):96-109.
4. Fei F, Qu J, Zhang M, Li Y, Zhang S. S100A4 in cancer progression and metastasis: A systematic review. Oncotarget 2017;8(42):73219.
5. Rohilla S, Garg HK, Singh I, Yadav RK, Dhaulakhandi DB. rCBV-and ADC-based grading of meningiomas with glimpse into emerging molecular diagnostics. Basic and clinical neuroscience 2018;9(6):417.
6. Vabalas A, Gowen E, Poliakoff E, Casson AJ. Machine learning algorithm validation with a limited sample size. PloS one 2019;14(11):e0224365.
7. Chawla NV, Bowyer KW, Hall LO, Kegelmeyer WP. SMOTE: synthetic minority over-sampling technique. Journal of artificial intelligence research 2002;16:321-57.
8. He K, Zhang X, Ren S, Sun J. Deep residual learning for image recognition. Proceedings of the IEEE conference on computer vision and pattern recognition. 770-8
9. Szegedy C, Vanhoucke V, Ioffe S, Shlens J, Wojna Z. Rethinking the inception architecture for computer vision. Proceedings of the IEEE conference on computer vision and pattern recognition. 2818-26
Figures
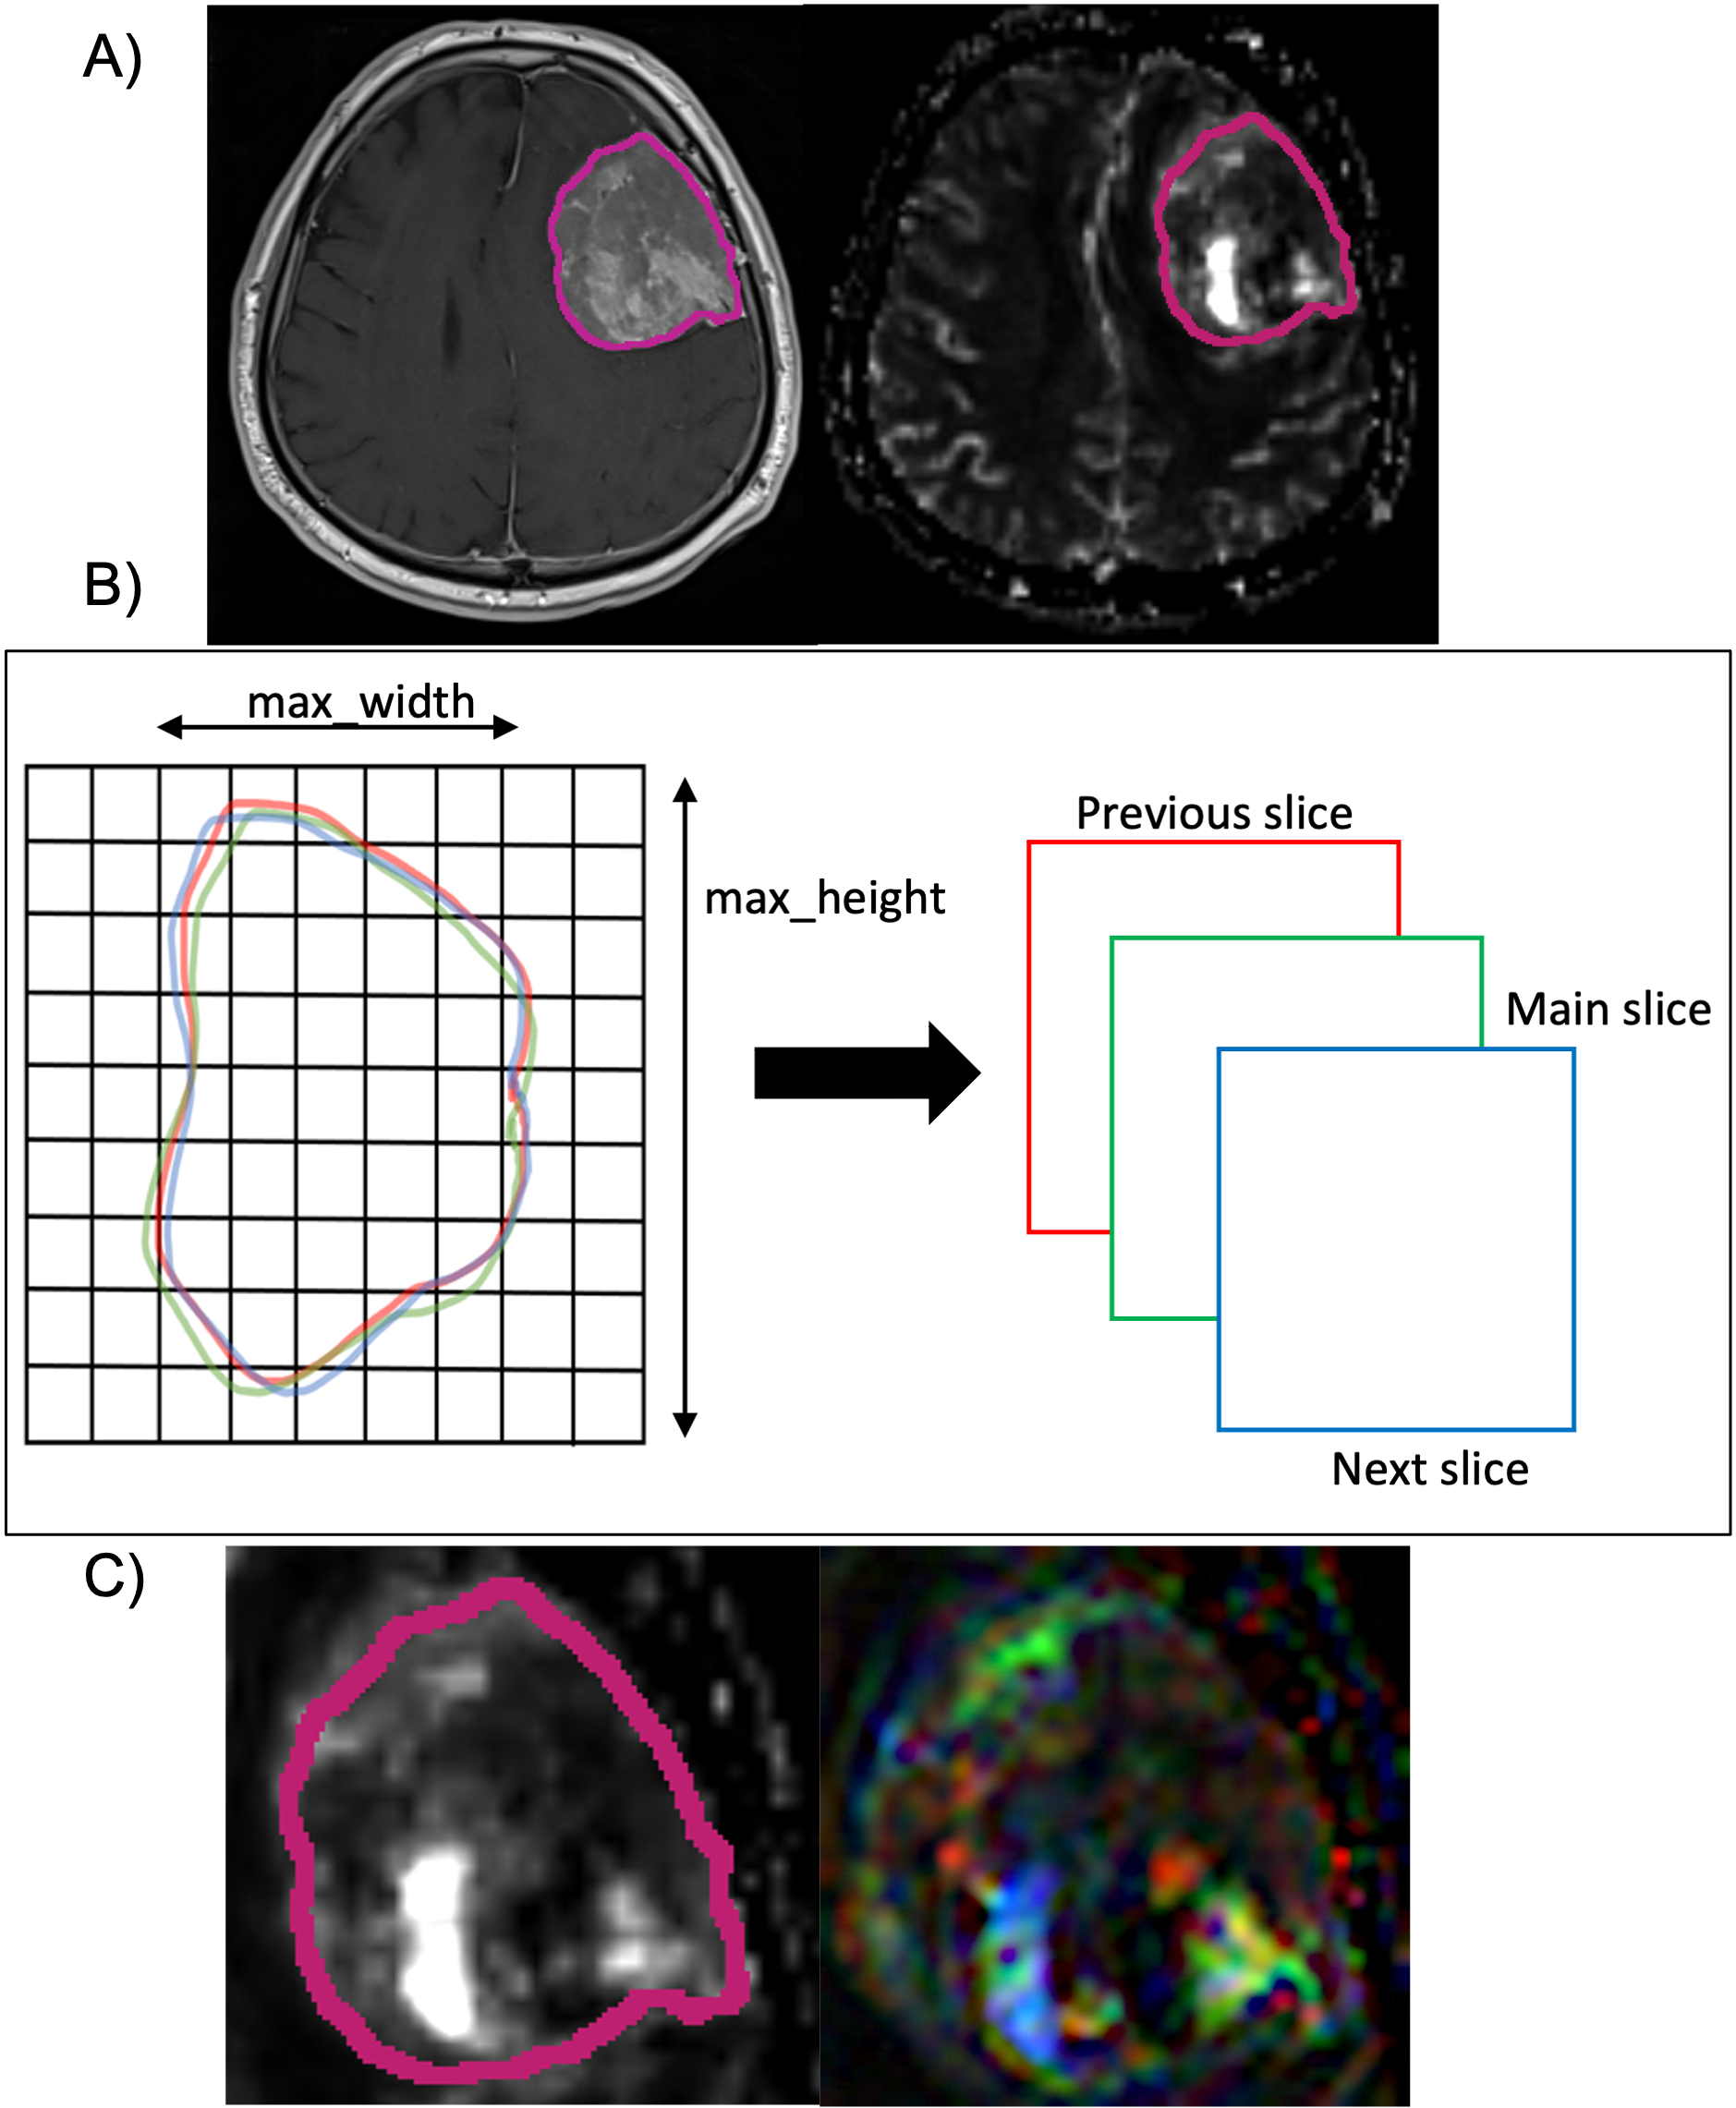
Figure 1. A) A tumor mask on a T1-weighted post-contrast MRI and on the corresponding rCBV map, B) Example of masks on three consecutive slices and C) Segmented ROI and the RGB image that was created.
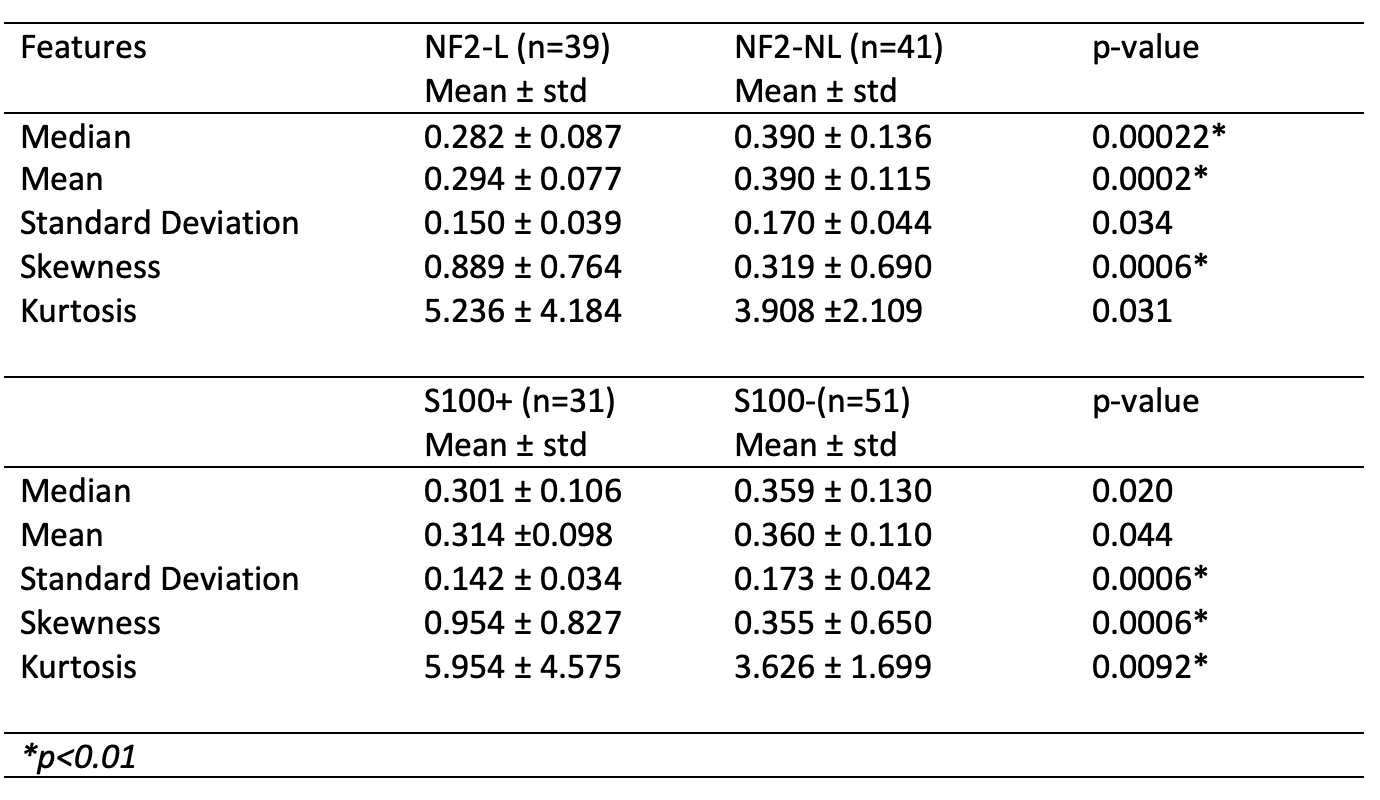
Table 1. The statistical feature differences between NF2 and S100 molecular subsets of meningiomas and the p-values of the Mann-Whitney U tests.
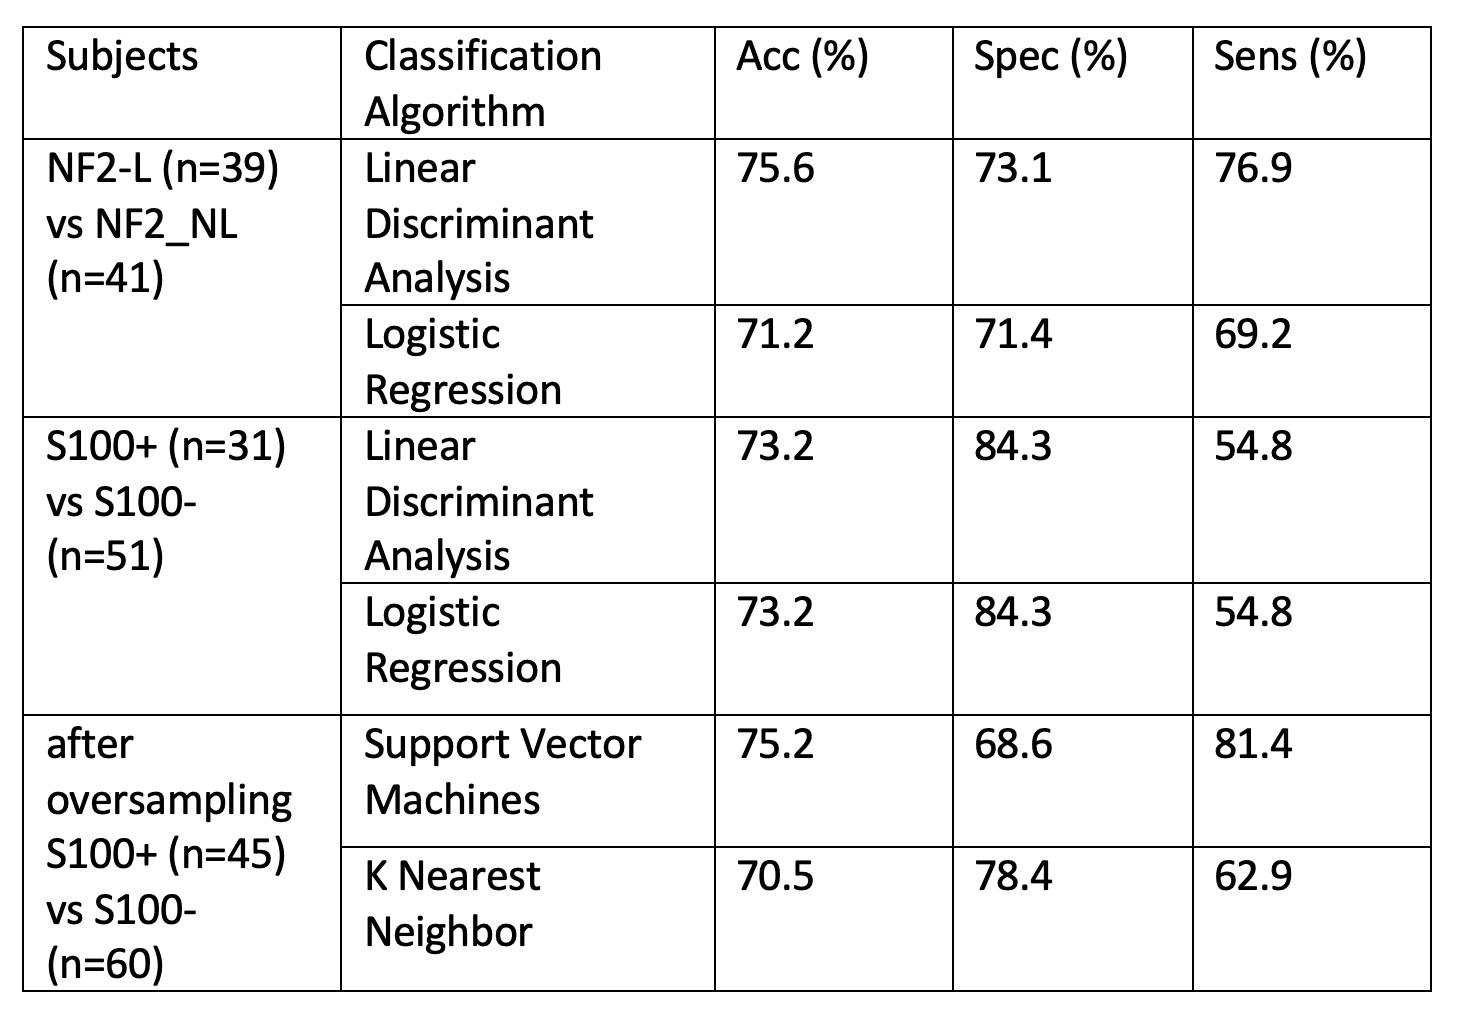
Table 2. The accuracy, specificity, and sensitivity values of classification of the NF2 and S100 molecular subsets of meningiomas.
DOI: https://doi.org/10.58530/2022/1437