1434
Radiomics signature from multiparametric MRI as early in-vivo biomarkers for pseudoprogression in recurrent glioblastoma patients.1Department of Radiotherapy, Institut Universitaire du Cancer de Toulouse - Oncopole, Toulouse, France, 2Grenoble Institut des Neurosciences, Grenoble, France, 3Department of Clinical Trials, Institut Universitaire du Cancer de Toulouse - Oncopole, Toulouse, France, 4Dipartimento di Scienze Mediche e Chirurgiche, Università Magna Graecia, Catanzaro, Italy, 5U1037, RADOPT Team, Cancer Research Center of Toulouse, Toulouse, France, 6Department of Engineering and Medical Physics, Institut Universitaire du Cancer de Toulouse - Oncopole, Toulouse, France, 7MINDS Team UMR 5505, Institut de Recherche en Informatique de Toulouse, Toulouse, France
Synopsis
Radiomic features computed from multiparametric MRI were found to be relevant as early in-vivo biomarkers for pseudoprogression evaluation in recurrent glioblastoma patients. At baseline, predictive biomarker for pseudoprogression outcome was related to kurtosis parameter of FLAIR histogram plotted from abnormal hyper-intense signal area. When considering variation between baseline and first event (either pseudoprogression or true progression), four early biomarkers were found for entropy of T1-weighted, T1-weighted-post-contrast morphological MRI and Apparent Diffusion Coefficient maps derived from diffusion-weighted MRI.
Such early in-vivo biomarkers easily computed from automatic segmentation and first order radiomics analysis could be useful for the assessment of treatment response.
Introduction
In the context of a clinical trial (STERIMGLI NTC02866747), differentiating pseudoprogression (PP) from true progression (TP) is of crucial interest in recurrent glioblastoma patients treated by combined treatment of immunotherapy and hypo-fractionated stereotactic radiotherapy (hFSRT).Material and Method
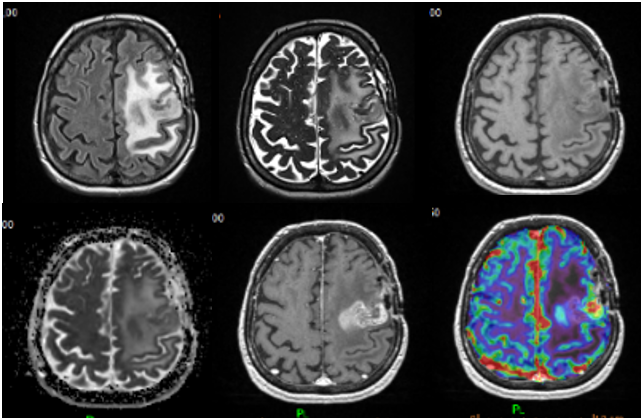
Longitudinal MRI follow-up consisted in the acquisition of multimodal MRI protocol repeated every 8 weeks. Each follow-up session included T2-weighted (T2), T2-weighted-FLAIR (FLAIR), T1-weighted (T1), T1-weighted-post-contrast (T1c) morphological MRI, in addition to Diffusion and Perfusion MRI from which Apparent Diffusion Coefficient (ADC) and Cerebral Blood Volume (CBV) maps were respectively derived (Figure 1).Pre-processing for each MRI follow-up consisted in the co-registration and the normalization of the 6 modalities (T2, FLAIR, T1, T1c, ADC and CBV maps) into the BraTS space1. Deep Learning algorithms for automatic segmentation of region-of-interest (ROIs) namely contrast-enhancing tumour (ET) segmented from T1c maps and peri-tumoral edema (ED) segmented from FLAIR maps were generated for all follow-up time points2. The mirror contralateral ET-ROI and ED-ROI were also considered at each follow-up for unrelevant features rejection.
Radiomics analysis3 consisted in features extraction from all ED and ET-ROIs reported on FLAIR, ADC, CBV maps and T1, T1c, ADC, CBV maps respectively. For the sake of interpretability, only eight of the first order radiomics were computed (minimum, maximum, median, mean, entropy, skewness, kurtosis and volume).
Radiomic features (n=5824) were analyzed at baseline, at first event (PP or TP) time-point and variation between baseline and first event.
Results
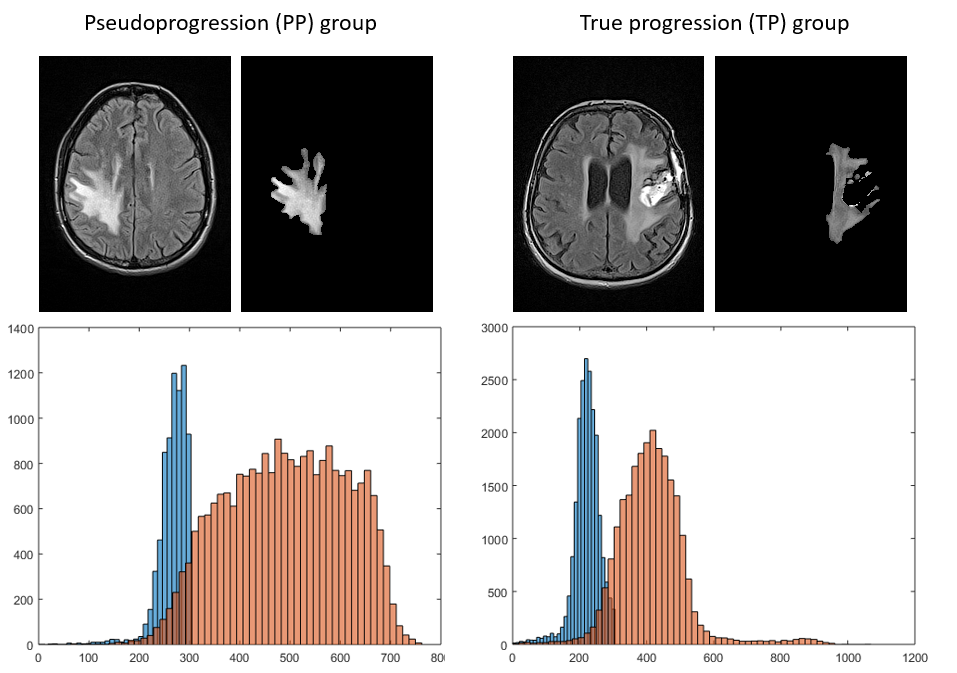
In total, 121 multimodal MRI from 26 patients included in the clinical trial were pre-processed and analyzed.At baseline, ED median kurtosis on FLAIR maps was significantly lower for patients in the PP group compared to patients in the TP one, respectively 2.292 vs. 3.111 (p=0.0047). A representative example of the difference between the two groups for this radiomic feature is given on Figure 2. ROC curve for ED kurtosis on FLAIR maps gave a sensitivity and specificity of 76% and 89 % (AUC=0.843) with a cut-off at 2.52.
For variation between baseline and first event, ET median volume on T1c maps was significantly higher for patients in the TP group compared to patients in the PP one, respectively 1115 vs.6800 mm3 (p=0.0055). ET median entropy on T1, T1c and ADC maps were significantly higher for patients in the TP group compared to patients in the PP one, respectively 0.710 vs. 0.177, 0.721 vs. 0.171 and 0.818 vs. 0.162 (p<0.0254).
A multiparametric score with these four features was able to differentiate TP and PP with a sensitivity and specificity of 86.67% and 87.50% (AUC=0.90).
Conclusion
Despites a small number of patients included in our study, a predictive feature, namely low ED median kurtosis on FLAIR MRI computed at baseline, was able to predict PP outcome. An early multiparametric MRI score, derived from ET median volume and entropy computed between first event and baseline, was also able to discriminate TP from PP.These results have to be confirmed on a larger patient cohort and analysis is still on-going with the currently recruiting clinical trial.
Acknowledgements
No acknowledgement found.References
1. Kofler F, Berger C, Waldmannstetter D, Lipkova J, Ezhov I, Tetteh G, Kirschke J, Zimmer C, Wiestler B, Menze BH. BraTS Toolkit: Translating BraTS Brain Tumor Segmentation Algorithms Into Clinical and Scientific Practice. Front Neurosci. 2020 Apr 29;14:125.
2. Piram L, Acquitter C, Sabatini U, Lemasson B,Moyal, E, El Idrissi S, Ken S. P04.06 Can BraTS Toolkit Brain Tumor Segmentation Algorithms be relevant when dealing with post-operativeMRI in clinical practice? Neuro-Oncology 2021, 23, ii19–ii20.
3. Lambin P, Rios-Velazquez E, Leijenaar R, Carvalho S, van Stiphout RG, Granton P, Zegers CM, Gillies R, Boellard R, Dekker A, Aerts HJ. Radiomics: extracting more information from medical images using advanced feature analysis. Eur J Cancer. 2012 Mar;48(4):441-6.
Figures