1433
Improved assessment of fetal ocular pathologies in MRI using ocular ratios and machine-learning multi-parametric classification
1Sagol Brain Institute, Tel Aviv Sourasky Medical Center, Tel Aviv, Israel, 2School of Computer Science and Engineering, The Hebrew University of Jerusalem, Jerusalem, Israel, 3Division of Pediatric Radiology, Tel Aviv Sourasky Medical Center, Tel Aviv, Israel, 4Sackler Faculty of Medicine, Tel Aviv University, Tel Aviv, Israel, 5Sagol School of Neuroscience, Tel Aviv University, Tel Aviv, Israel, 6Division of Ultrasound in Obstetrics & Gynecology, Lis Maternity Hospital, Tel Aviv, Israel, 7Obstetrics and Gynecology Division, Hadassah Hebrew University Medical Center, Jerusalem, Israel, 8Medical Imaging, CHEO, University of Ottawa, Ottawa, ON, Canada
Synopsis
Brain MRI of 296 fetuses (22-40 weeks’ gestational-age, normal n=244, hypo/hyper-telorism n=52 were included. Binocular, interocular, and ocular diameters, and ocular volume were measured using automatic methods. Two new parameters, binocular-ratio and interocular-ratio, were defined. In normal fetuses, all four measurements increased with gestational-age. However, constant values were detected across all gestational-ages of binocular-ratio=1.56±0.05 and interocular-ratio=0.60±0.05. A random-forest classifier achieved the best results (out of eight classifiers) with AUC-ROC=0.90±0.03 for classification between normal and fetuses with hypo/hyper-telorism. mainly based on the two new ratios. Machine-learning multi-parametric classification and the new ratios are suggested to be used in routine clinical practice.
Introduction
Abnormalities of the fetal eye globes are associated with various syndromes and brain malformations. Evaluation of fetal eye globe is mainly subjective and may include manual measurements of the ocular (OD), inter-ocular (IOD) and binocular (BOD) distances (Figure 1), thus rely on performer’s expertise. Recently, a few studies proposed automatic methods for fetal ocular measurement based on deep learning and geometric algorithms1, and on motion corrected volumes2. Few studies provided normal ocular growth charts3-6, however, these studies show high variability in reported normal values7, both in MRI and ultrasound. This variability in the normal range may affect diagnosis of hypo- or hypertelorism, which are defined based on IOD measurement.The aim of this study was to improve detection of fetuses with hypo/hyper-telorism from in-vivo fetal brain MRI based on ocular measurements.
Methods
Subject data: Axial brain MRI volumes of 296 fetuses (gestational-age: 22-40 weeks, normal n=244, hypo/hyper-telorism n=52) were included. Scans were performed on 1.5T General-Electric or 3T Siemens systems and included T2-weighted FRFSE/HASTE/TrueFISP/SSFSE sequences, with in-plane resolution of 0.39-1.60mm and slice thickness of 2-7mm.Data annotation: Normal developing fetuses were defined as having normal imaging findings, excluding congenital malformations, chromosomal abnormalities, perinatal infections, chronic maternal pathology, and non-cephalic anomalies. Fetuses with hyper- or hypotelorism (abnormal fetuses) were defined based on MRI assessment performed by a senior fetal neuro-radiologist.
Automatic fetal ocular measurements: BOD, IOD, and OD, as well as Ocular Volume (OV) were measures automatically using three-stage algorithm1: (1) fetal brain detection using 2D U-Net; (2) ocular segmentation using 2D U-Net; and (3) ocular measurements using geometric algorithm.
Ocular ratios: Two new ratios were calculated: binocular-ratio (BOD-ratio) and inter-ocular ratio (IOD-ratio), as follows (Eq. 1 and Eq. 2):
$$ (1) IOD-ratio=IOD/(OD_{right}+OD_{left}) $$ $$ (2) BOD-ratio=BOD/(OD_{right}+OD_{left})$$
Normal changes with gestational-age (GA): Changes with GA of each ocular biometric parameter were analyzed using polynomial regression models.
Differentiation between normal and abnormal fetuses: Differences between normal and abnormal fetuses were first assessed using two-way ANCOVA, controlling for age and using Benjamini-Hochberg correction for multiple comparisons.
Next, classification was performed first based on the accepted clinical criteria defining normal cases within the range of 5-95% of IOD, and hypo- or hypertelorism when IOD was below 5% or above 95%, for appropriate GA (respectively).
In addition, a machine-learning (ML) classifier was developed to differentiate between normal and abnormal cases based on six ocular parameters. Eight models were tested: Random forests (RF)8 (N=10), Linear and RBF-Kernel SVM9, extreme gradient boost classifiers (XGBoost)10 using three different objectives – Logistic, Linear and pairwise ranking regression, k-Nearest neighbors (k=5) and Multi-Layer Perceptron. To compensate for the inherent imbalance with more normal than abnormal cases, synthetic minority oversampling (SMOTE)11 was used in model training. Model performance was evaluated using accuracy, F1-Score, Matthews Correlation Coefficient (MCC)12 and area under the curve of the receiver operating characteristic curve (AUC-ROC), with a five-fold cross-validation scheme.
The decision function of the best-performing model was evaluated using SHAP13 (SHapley Additive exPlanation) to rank the input parameters by their contribution to the model.
Results
Normal changes with GA: All ocular measurements significantly increased with GA (Figure 2), using a second-order polynomial regression model for the three linear measurements: BOD, IOD and OD, and a linear model for ocular volume, as suggested by Velsaco-Annis et al4. Comparing previous studies3-5, variable trajectories and values are reported.The two ocular ratios showed no changes with GA (Figure 3) with mean(±std) values of 1.56±0.05 for the BOD-ratio and 0.55±0.05 for the IOD-ratio. The BOD-ratio is close to the golden ratio of 1.618, commonly found in many biological structures. Both ratios can also be obtained, when calculated from data published in previous studies, both from MRI such as in (Li et al3), BOD-ratio=1.56±0.03, IOD-ratio=0.58±0.03, and in (Velasco-Annis et al4), BOD-ratio=1.54±0.02, IOD-ratio=0.60±0.04, and from ultrasound (Jeanty et al6) BOD-ratio=1.58±0.02, IOD-ratio=0.58±0.03.
Differentiation between normal and abnormal fetuses: Significant differences were detected by all measured and ratio parameters (p<0.001) except for the OD (p=0.676).
Classification results of the eight ML models are presented in Table 1. The best results were obtained using a RF classifier. Figure 4 shows model decision function analysis using SHAP, with BOD-ratio found to be the most important feature for classification, followed by IOD-ratio, in all test splits of five-fold training.
Discussion and Conclusion
In this work, we suggest two new calculated ratios, BOD-ratio and IOD-ratio, that demonstrate constant values across GA, and replicable when calculated from previous studies. Furthermore, a ML classifier demonstrated high accuracy in differentiation between normal fetuses and fetuses with hyper- or hypotelorism. The classifier achieved higher performance in all evaluation parameters, than classification based on IOD alone using the accepted criteria. This highlights the importance of multi-parametric classification. Furthermore, the suggested ocular ratios were the most contributing feature for classification.Ocular ratios and machine-learning multi-parametric classification suggested to improve the assessment of fetal ocular pathologies in MRI, and to be used in routine clinical practice.
Acknowledgements
This work was supported by Kamin grants of the Israel Innovation Authority.
References
1. Avisdris, N., D. Link-Sourani, L. Ben-Sira, L. Joskowicz, E. Miller, and D. Ben-Bashat. Automatic fetal ocular measurements in MRI. in Proceedings of the ISMRM & SMRT Annual Meeting & Exhibition. 2021.
2. Uus, A., J. Matthew, I. Grigorescu, et al. Spatio-Temporal Atlas of Normal Fetal Craniofacial Feature Development and CNN-Based Ocular Biometry for Motion-Corrected Fetal MRI. 2021. Cham: Springer International Publishing.
3. Li, X.B., G. Kasprian, J.C. Hodge, X.L. Jiang, D. Bettelheim, P.C. Brugger, and D. Prayer, Fetal ocular measurements by MRI. Prenatal diagnosis, 2010. 30(11): p. 1064-1071.
4. Velasco‐Annis, C., A. Gholipour, O. Afacan, S.P. Prabhu, J.A. Estroff, and S.K. Warfield, Normative biometrics for fetal ocular growth using volumetric MRI reconstruction. Prenatal diagnosis, 2015. 35(4): p. 400-408.
5. Robinson, A.J., S. Blaser, A. Toi, et al., MRI of the fetal eyes: morphologic and biometric assessment for abnormal development with ultrasonographic and clinicopathologic correlation. Pediatric radiology, 2008. 38(9): p. 971-981.
6. Jeanty, P., M. Dramaix-Wilmet, D. Van Gansbeke, N. Van Regemorter, and F. Rodesch, Fetal ocular biometry by ultrasound. Radiology, 1982. 143(2): p. 513-516.
7. Burns, N.S., R.S. Iyer, A.J. Robinson, and T. Chapman, Diagnostic imaging of fetal and pediatric orbital abnormalities. American Journal of Roentgenology, 2013. 201(6): p. W797-W808.
8. Breiman, L., Random forests. Machine learning, 2001. 45(1): p. 5-32.
9. Chang, C.-C. and C.-J. Lin, LIBSVM: a library for support vector machines. ACM transactions on intelligent systems and technology (TIST), 2011. 2(3): p. 1-27.
10. Chen, T., T. He, M. Benesty, V. Khotilovich, Y. Tang, and H. Cho, Xgboost: extreme gradient boosting. R package version 0.4-2, 2015. 1(4): p. 1-4.
11. Chawla, N.V., K.W. Bowyer, L.O. Hall, and W.P. Kegelmeyer, SMOTE: synthetic minority over-sampling technique. Journal of artificial intelligence research, 2002. 16: p. 321-357.
12. Chicco, D. and G. Jurman, The advantages of the Matthews correlation coefficient (MCC) over F1 score and accuracy in binary classification evaluation. BMC genomics, 2020. 21(1): p. 1-13.
Figures
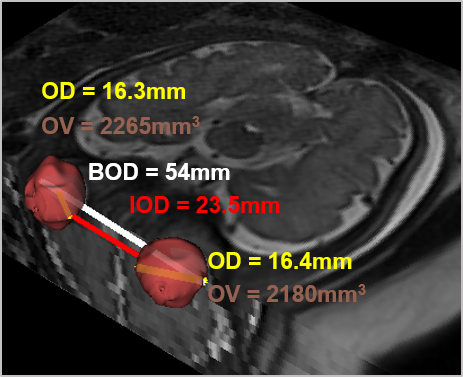
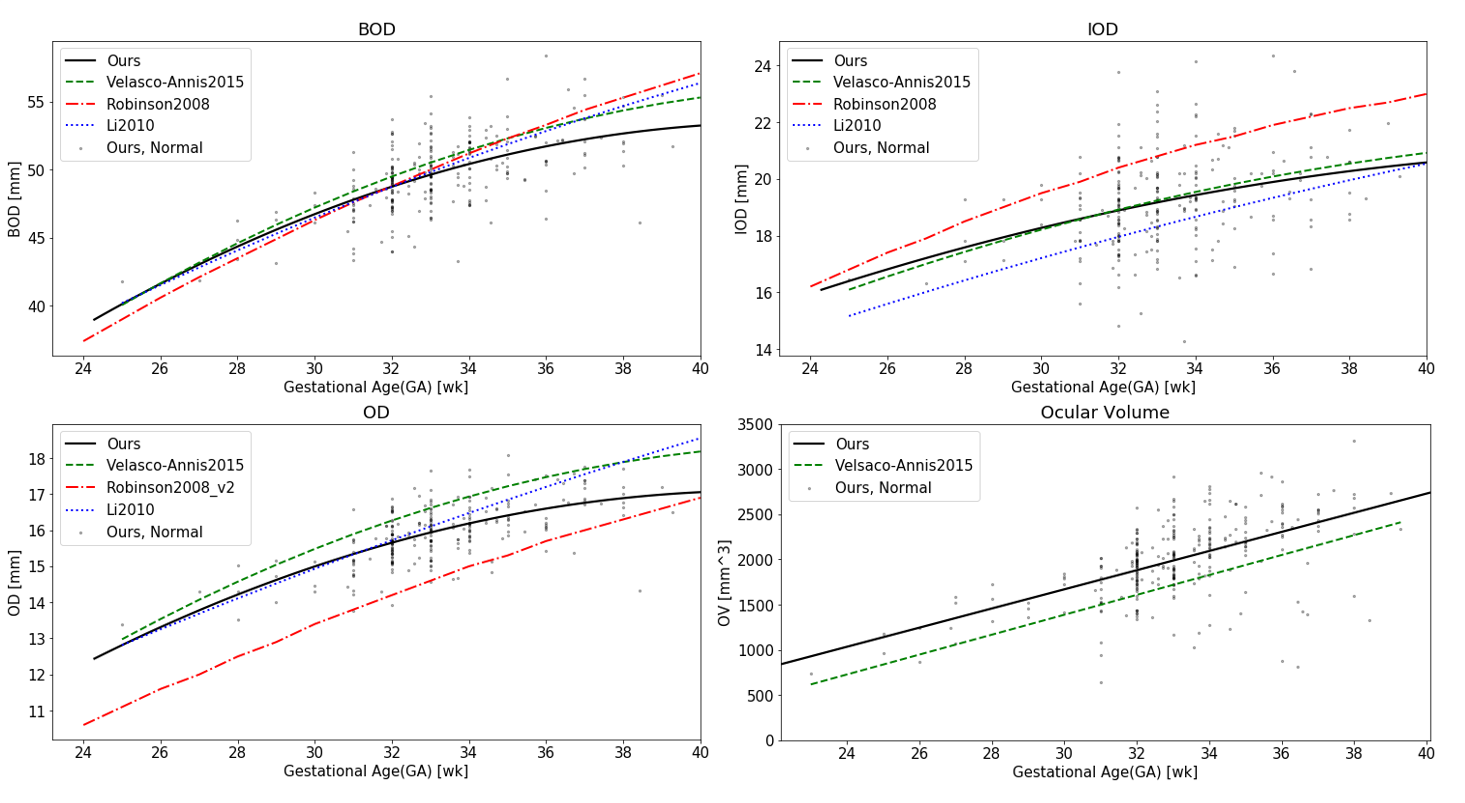
Figure 2: Changes in the normal development ocular linear
measurements (BOD, IOD, OD) and ocular volume (OV) with GA. Black dots and line
– data from the current study, dashed green (Velasco-Annis et al.4), dashed red - (Robinson et al.5), and dotted dark blue (Li et al.3).
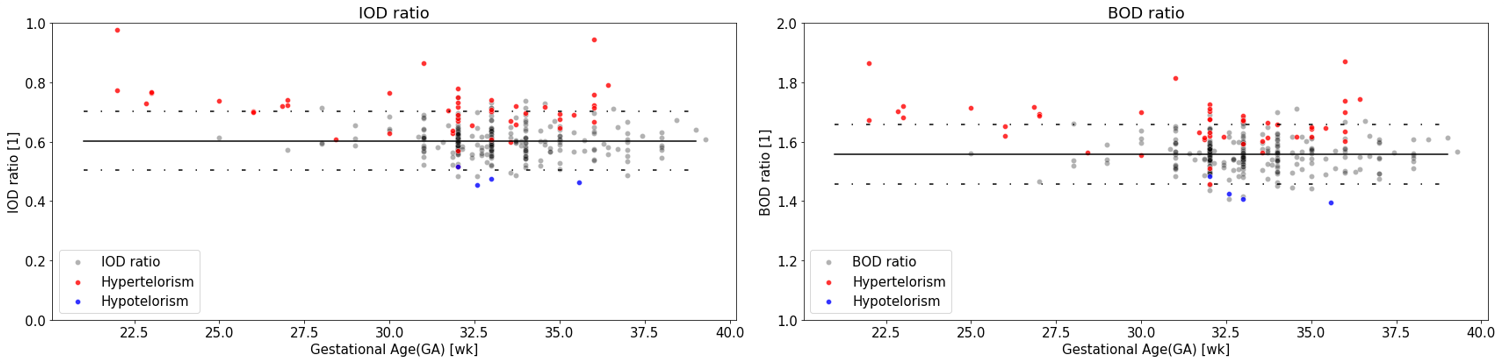
Figure 3: Changes of ocular ratios – (a) BOD-ratio and (b) IOD-ratio,
with GA. Black dots line – data from our study of normal cases. Dashed line –
95% confidence interval. Other dots are hyper-(red) and hypo-(blue) telorism
cases.
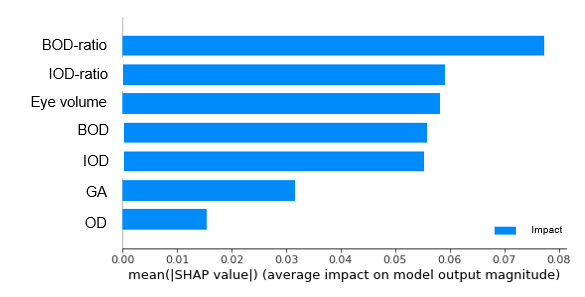
Figure 4: SHapley Additive exPlanation (SHAP) feature
ranking results, for the selected model (random forest) for classifying between
fetuses with and without ocular anomalies. The X-Axis is the feature impact.
Y-Axis is the feature name.
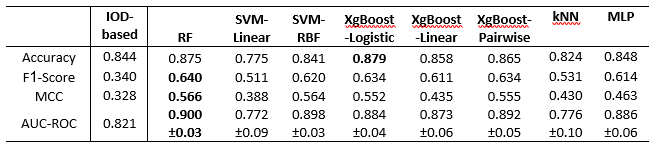
Table 1: Classification results between normal and abnormal fetuses. IOD-based: the accepted criteria that define hypo- or hypertelorism; RF: Random forest; SVM-Linear: Support Vector Machine with linear kernel; SVM-RBF: Support Vector Machine with Radial Basis Function kernel; extreme gradient boosting classifiers: XgBoost-Logistic: using logistic regression loss; XgBoost-Linear: using linear regression loss; XgBoost-Linear: using pairwise ranking loss; kNN: k-Nearest neighbors; MLP: Multi-Layer Perceptron. Boldface denotes the best result for each metric.