1431
MR-only staging of osteonecrosis of the femoral head (ONFH) using self-supervised learning for multiple MR protocols1Department of Bio and Brain Engineering, Korea Advanced Institute of Science and Technology, Daejeon, Korea, Republic of, 2Deparment of Radiology, Chung-Ang University Hospital, Seoul, Korea, Republic of
Synopsis
Diagnosing stages of osteonecrosis of the femoral head (ONFH) based on MR images can reduce additional cost and radiation exposure caused by CT scan. We propose a deep learning network that enables 4-way classification of ONFH stages, utilizing the information from MR images with different contrasts and planes. Given the limited number of available data, we enhanced the network performance by using self-supervised learning based on MR-to-CT translation task, which increased AUC significantly. We also investigated the diagnostic results from different MR protocols, and obtained more precise and robust results by combining them.
Introduction
Osteonecrosis of the femoral head (ONFH) is a disabling pathology that is the most important cause of total hip anthroplasty1. MRI is the first diagnostic imaging modality for ONFH due to its high sensitivity in early diagnosis. CT shows superiority in more advanced stages, but needs additional cost and radiation exposure. An automated MR-only ONFH diagnosing system using deep learning can alleviate those problems. However, deep learning methods require a large amount of data, which is hard to obtain in medical domain. In this work, we suggest to mitigate this issue by using self-supervised learning based on MR-to-CT translation task. We claim that deep-learning based MR-only ONFH staging with only a small number of data can be done via self-supervised learning, which is our major contribution. In addition, we introduce an effective way to extract femoral head (FH) regions from pelvic MR images and explore the use of MR images with different contrasts and planes, which has not been explored yet.Method
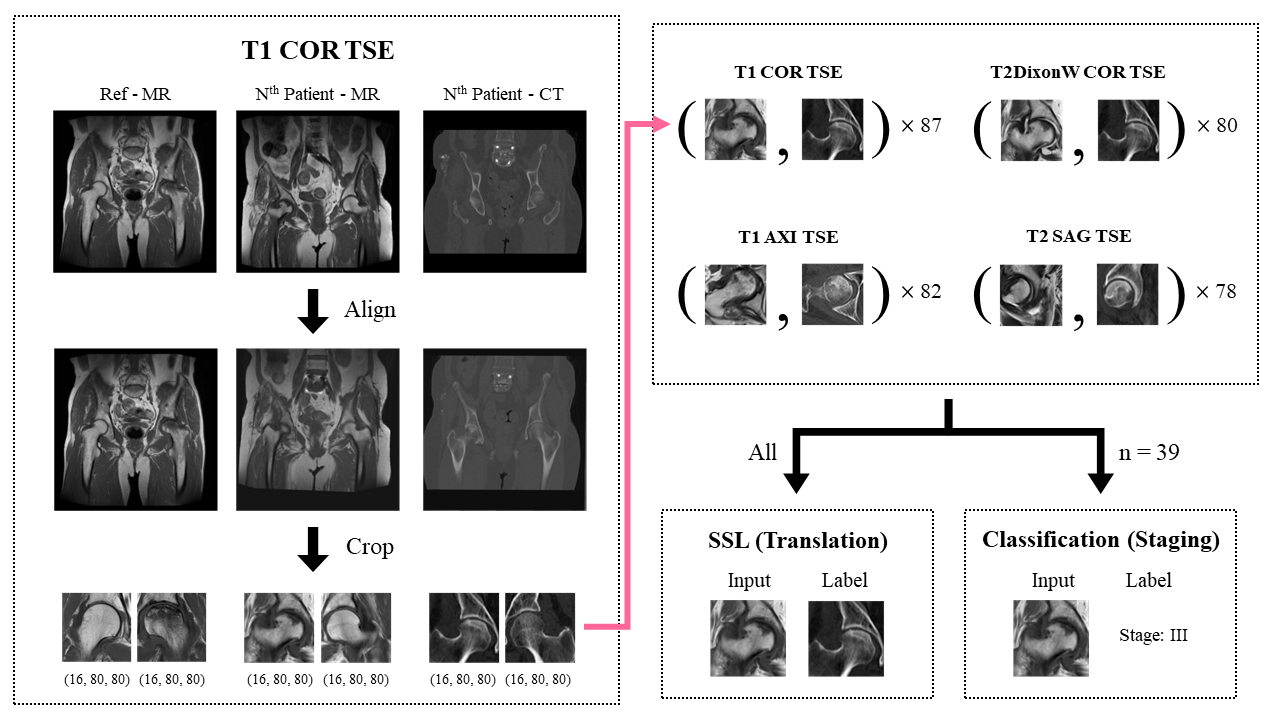
Data Preparation and PreprocessingMR images with 4 different protocols (T1COR TSE, T2DixonWCOR TSE, T1AXI TSE, T2SAG TSE) and CT images were obtained from 48 patients and categorized to 4 levels based on ARCO staging system2.
Every MR and CT image was first aligned with each other using SimpleITK library and then cropped to two 16×80×80 shaped patches containing FH region. Left FH images were horizontally flipped. This process minimized the manual selection process of region-of-interest. Some data such as those with misalignment or total hip anthroplasty were excluded, thus the number of hips in each protocol varied from 78 to 87. All of them were used for self-supervised learning and about half of them (39 hips) were used for staging (Figure 1).
Overall Process
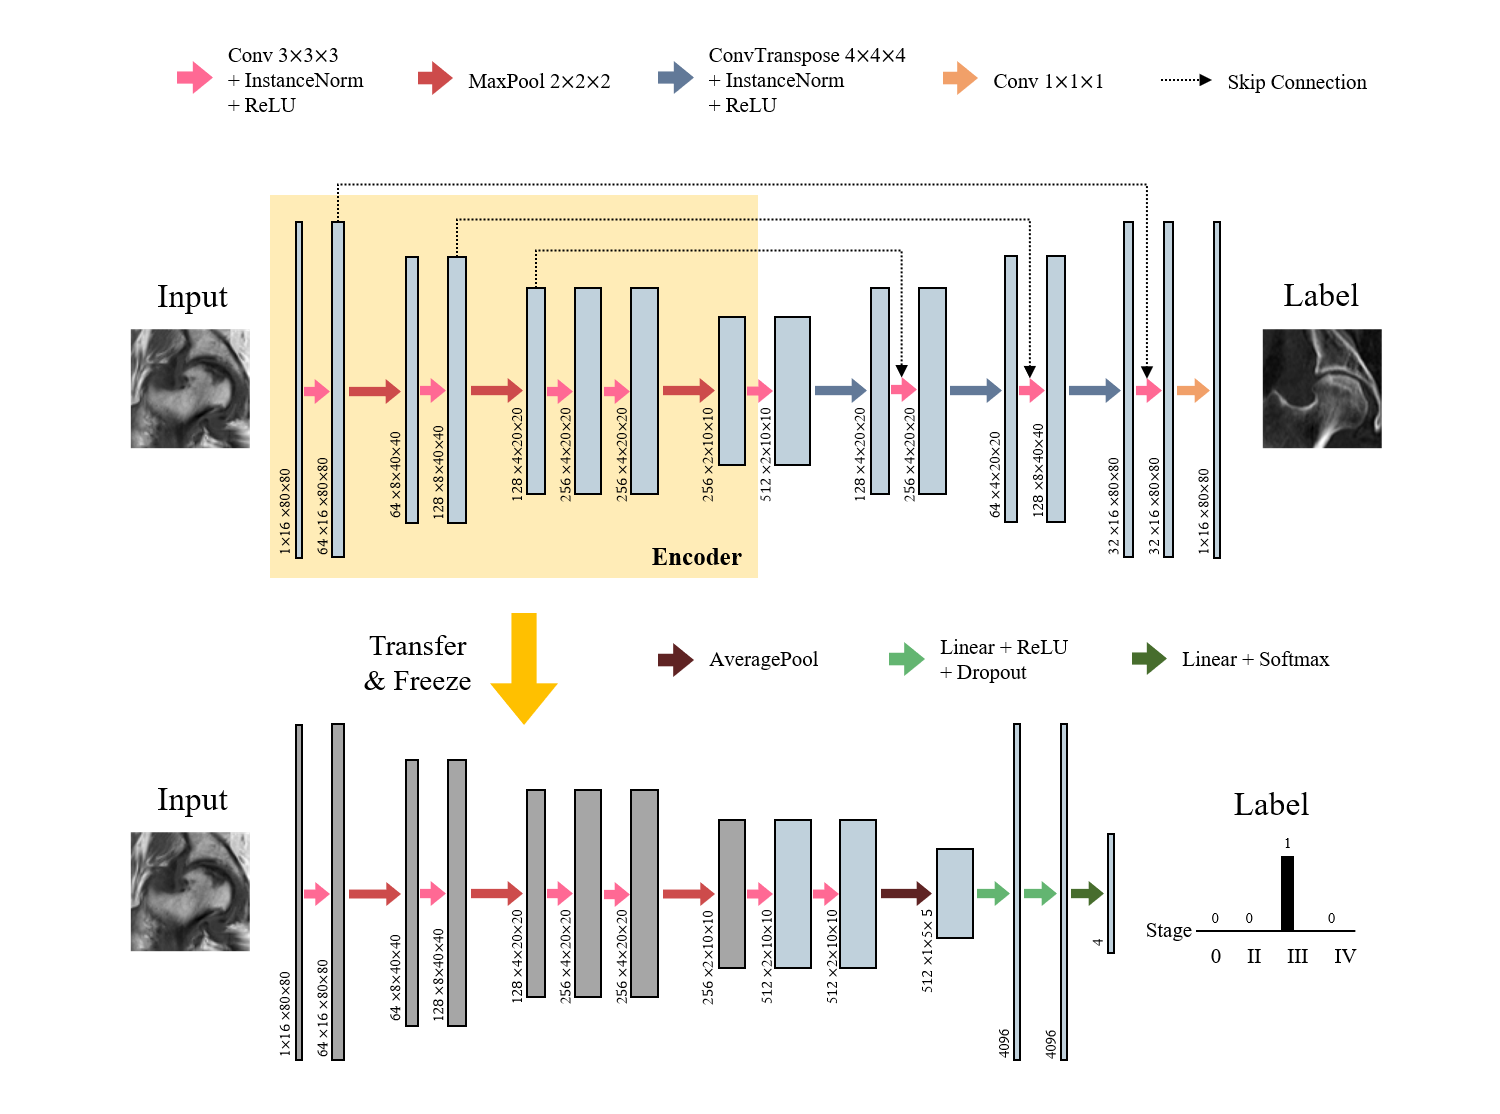
The overall process is composed of three steps: 1) self-supervised learning, 2) staging (Figure 2) and 3) combining (Figure 3). Due to the lack of annotated data, it was difficult to train the network for staging from the scratch. Self-supervised learning aims to learn the feature representations without manually annotated data. We built an encoder-decoder network that performed MR-to-CT translation. Since paired MR-CT images are relatively easy to collect, we can utilize more amount of data that require no manual annotations. We used U-net3 as a backbone network, and the encoder part followed the VGG-114 architecture.
After training the translation network, the encoder part was extracted and used as a feature embedding network for staging. A convolutional neural network took the feature embedding of each input image that came from the encoder and performed a 4-way classification. The output was the probability distribution for each stage. The number of training data in this step was much smaller than the previous step.
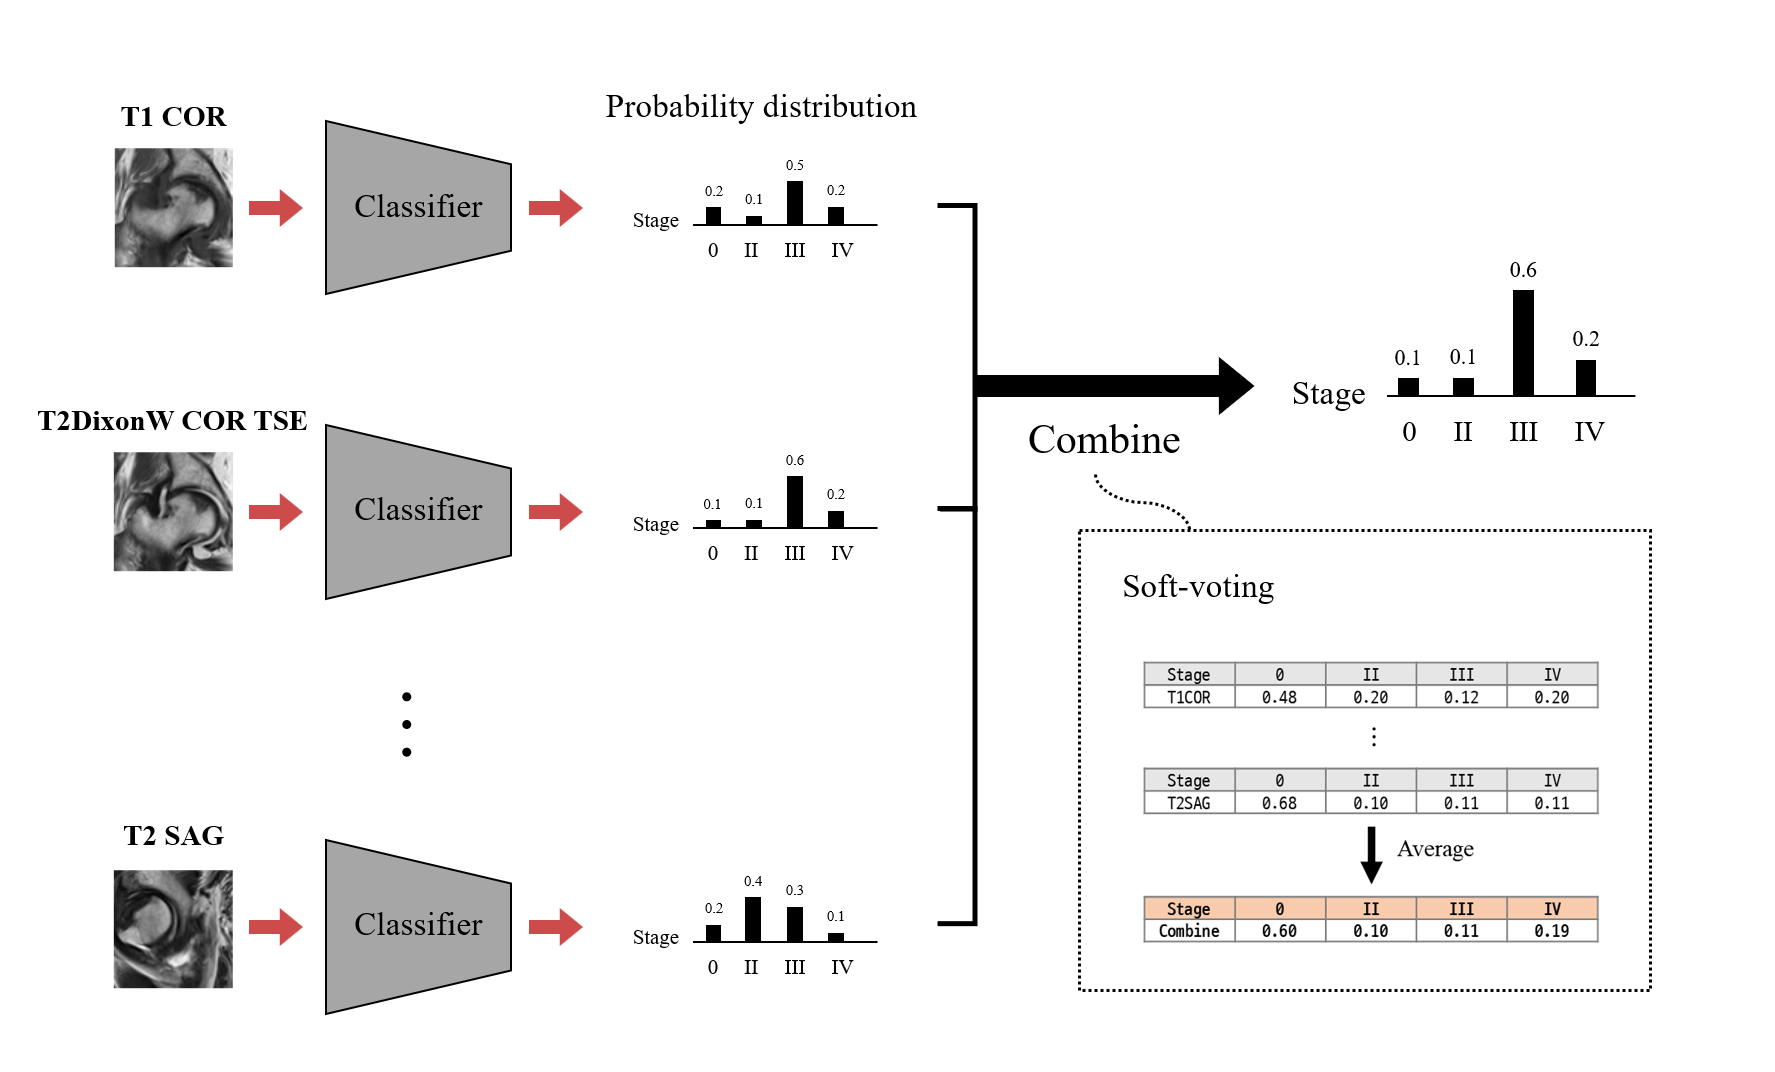
Both steps were performed for each MR protocol. In other words, 4 different networks were trained separately and output 4 different staging results. These outputs were than combined via soft-voting, which simply took the average of the predicted distributions, similar to ensemble learning that combines the predictions from different networks.
For each imaging protocol, we trained two types of classifiers: 1) Scratch: model trained from scratch (fully train the classifier) and 2) Self-supervised: model with self-supervised learning (adapt weights learned from translation network). In addition, we trained two more models that used all data for training classifiers – namely, Scratch_all and Self-supervised_all - to see the effect of representation learning of self-supervised learning. In this case, the number of data used in training classifier was the same as that used in self-supervised learning.
Training and Evaluation
For every task, the dataset was divided into train, validation and test sets without overlapping. We used leave-one-out validation due to the lack of data. Area under the curve (AUC) was reported for evaluation of classification models.
Result & Discussion
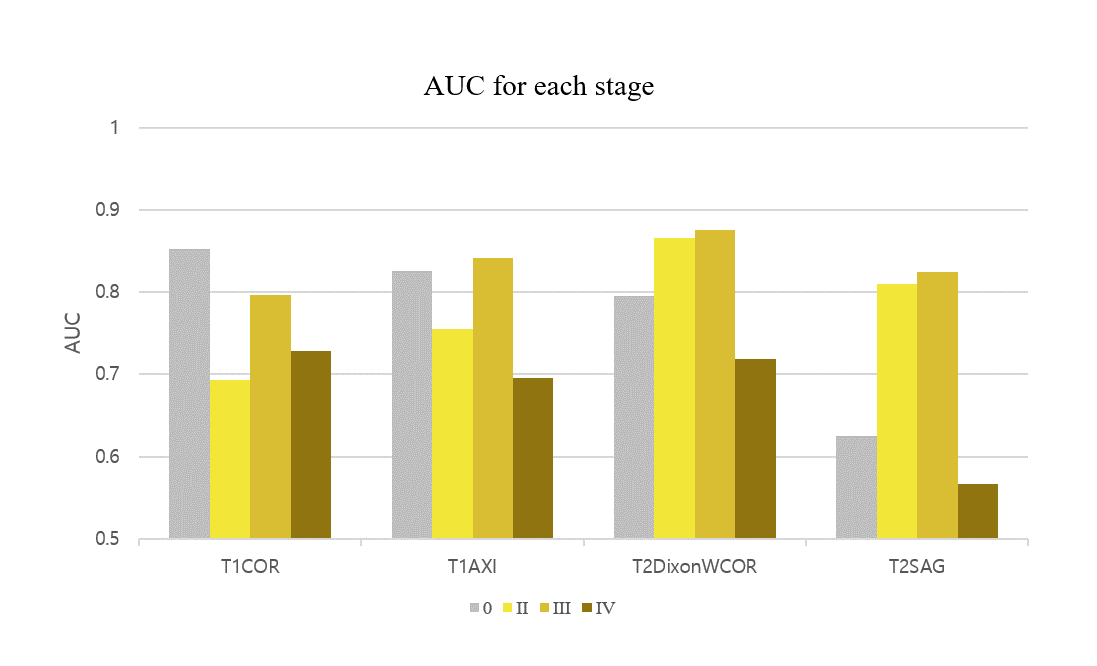
Figure 4 shows the result for the four different models. Self-supervised learning significantly improved performance when more data was available (Scratch and Self-supervised – red colored), and even when the number of data was same (Scratch_all and Self-supervised_all – blue colored). This implies translation-based self-supervised learning can mitigate the data deficiency issue and/or improve model performance when the number of data is sufficient.The final staging result was obtained by combining all four probability distributions from each protocol, resulting in AUC of 0.81, which was better than AUCs of all individual models. This might come from the different class-wise sensitivity of each protocol. As shown in Figure 5, the AUC for each stage varied among the input protocols. Therefore more precise and robust results can be obtained by combining the outputs obtained from various protocols. While simple soft voting was used for the combination, the results may be further improved by more complex methods such as linear classifiers.
Conclusion
Our results show that translation-based self-supervised learning can provide a powerful way to learn representations for MR-only ONFH diagnosis when number of labeled data is not enough. The performance of the networks varied across different contrasts and planes. The networks can be combined together for better performance for predicting the ARCO stage of ONFH (0.81 AUC). The proposed approaches may be generalized in diagnosing other diseases as well.Acknowledgements
No acknowledgement found.References
1. Petek, Daniel, Didier Hannouche, and Domizio Suva. "Osteonecrosis of the femoral head: pathophysiology and current concepts of treatment." EFORT open reviews 4.3 (2019): 85-97.
2. Yoon, Byung-Ho, et al. "The 2019 revised version of association research circulation osseous staging system of osteonecrosis of the femoral head." The Journal of arthroplasty 35.4 (2020): 933-940.
3. Ronneberger, Olaf, Philipp Fischer, and Thomas Brox. "U-net: Convolutional networks for biomedical image segmentation." International Conference on Medical image computing and computer-assisted intervention. Springer, Cham, 2015.
4. Simonyan, Karen, and Andrew Zisserman. "Very deep convolutional networks for large-scale image recognition." arXiv preprint arXiv:1409.1556 (2014).
Figures