1427
A novel clinical prostate diffusion MRI approach for combined measurement of ADC and non-monoexponential diffusion1Institute of Clinical Sciences, Sahlgrenska Academy, Gothenburg University, Gothenborg, Sweden, 2Department of Radiology, Brigham Women’s Hospital, Harvard Medical School, Boston, MA, United States
Synopsis
A novel clinical protocol for prostate diffusion imaging is presented. The commonly applied strategy of averaging MR signal at a small number of b-values is replaced by the acquisition of a whole range of b-values in conjunction with a model fitting post precessing step. With no increase in acquisition time, our results show that the same image quality can be achieved. As a main benefit, modelling is made more consistent and largely b-value independent for both the simple ADC model, as well as for more complex signal representations such as the kurtosis model.
Introduction
Magnetic resonance diffusion measurements are usually time consuming as the effect of diffusion weighting results in a low signal to noise ratio (SNR). Therefore, a commonly applied strategy for clinical patient examinations in prostate (1,2) is to only probe a few different b-values and to use signal averaging. While this procedure is suitable for generating maps of the apparat diffusion coefficient, the lack of variety in the acquired b-values is a hinder for the application of higher order signal representations, such as the truncated kurtosis model given by S(b)=S0⋅exp(−bADCK+b2K·ADCK2/6) and leads to a bias in ADC values depending on the exact b-values probed (3).Here we suggest a procedure where 21 linearly spaced b-values over a wider range are probed instead without any averaging applied. Using the same amount of orthogonal directions as in the clinical procedure, the total amount of images stays more or less constant. The lack of averaging leads to a low SNR for a single b-value image (see Fig.1). However, synthesized images at arbitrary b-values can be computed in a post-processing step where the model-driven denoising tool OBSIDIAN (4) is applied. The quality of the synthesized images is comparable to those from the clinical protocol. The main advantage of the suggested procedure is that model parameters, such as the basic ADC and ADCK, can be determined in a more reproducible way and are not relying on the exact choice probed b-values (3).
Methods
Simulated data was generated for two tissue type models, representing normal and cancerous prostate tissue, based on a biexponential function. Both have a fast diffusion component D1 of 2.2 μm2/ms, while the slow diffusion parameter D2 and the fast signal fraction f differ, i.e., D2 = 0.4 μm2/ms and f = 0.8 in the normal case and D2 = 0.2 μm2 /ms and f = 0.6 for the cancerous case. Simulation data consisted of signals at N = 21 b-values, linearly spaced in the range of 0 to bmax. For both the normal and the cancerous case, 60 000 signal realizations at different SNR levels were generated by adding Gaussian noise with a standard deviation of σ = 1. These profiles were fitted with biexponential, kurtosis and gamma distribution model functions allowing the fitted signal Sfit(b) to be calculated. The averaging effect (AE) for certain b-values was then calculated as AE(b)=(σ/STD(Sfit(b)))2, where STD represents the standard deviation over all realizations. A synthetic ADC termed trueADC was computed by means of linear regression for Sfit(b) at b-values of 0, 100, 1000 and 1500 s/mm2 as used in the clinical protocol.
Informed consent of the patient was received prior to imaging. Clinical data from the 21 b-value protocol was processed with OBSIDAN (4) employing the kurtosis model. From the resulting parameter maps images at the 4 standard clinical b-values were calculated and used to compute trueADC maps by means of linear regression in each pixel.
Results
The averaging effect across the measured b-value range for different bmax values is shown in Fig.1. In Fig.2 clinical ADC, kurtosis ADC and trueADC are compared for simulated signal. Comparison of clinical data, synthesized images and raw signals is shown in Fig.3. In Fig.4 clinical and computed ADC maps are shown.Discussion
As shown in Fig.1, a considerable AE results from model fitting of the simulated MR signal, particularly in the middle part of the chosen b-range. As images at b=1000 s/mm2 and 1500 s/mm2 are of particular importance in clinical practise, a bmax of 2000 s/mm2 appears to be a good choice as the AE is high for the clinically relevant b-values. Higher bmax values generally produce a higher AE, however, at the cost of a longer echo time and an increased signal bias (see Fig.3 in reference (4)). For simulations, trueADC is equivalent to clinical ADC, while ADCK is larger and more noisy, which is not surprising due to the higher complexity of the model.The quality of synthesized images is on-par with the images obtained from the clinical protocol. Furthermore, the improvement in image quality by model fitting with respect to the raw data is apparent. With respect to the ADC maps, ADCK is more noisy in comparison to the clinical and the synthesized ADC map (trueADC) in agreement with the simulations. The trueADC map is of equal quality as the clinical ADC map and can be computed for arbitrary b-value choices.
Conclusion
A novel approach for clinical acquisition and processing of prostate is presented where a large range of b-values is probed without the need for averaging. Preliminary results show that image quality is on-par with the six fold averaged clinical images without an increase in acquisition time. In principle, the dense coverage of a whole b-range, gives more reproducible trueADC values, since b-value settings can be modified after the acquisition. Furthermore, the new approach can account for more complex signal representations, such as the kurtosis model. Further work is under way to support these claims and which in turn might lead to a paradigm shift in prostate diffusion acquisition.Acknowledgements
Barncancerfonden; the Swedish Cancer Society; the Swedish Research Council; The Swedish state under an agreement between the Swedish government and the country councils (the ALF agreement).
References
1. Weinreb JC, Barentsz JO, Choyke PL, Cornud F, Haider MA, Macura KJ, et al. PI-RADS Prostate Imaging – Reporting and Data System: 2015, Version 2. Eur Urol. 2016;69(1):16–40.
2. Rosenkrantz AB, Padhani AR, Chenevert TL, Koh D-M, Keyzer FD, Taouli B, et al. Body diffusion kurtosis imaging: Basic principles, applications, and considerations for clinical practice. J Magn Reson Imaging. 2015;42(5):1190–202.
3. Maier SE, Wallström J, Langkilde F, Johansson J, Kuczera S, Hugosson J, et al. Prostate Cancer Diffusion-Weighted Magnetic Resonance Imaging: Does the Choice of Diffusion-Weighting Level Matter? J Magn Reson Imaging. 2021;
4. Kuczera S, Alipoor M, Langkilde F, Maier SE. Optimized bias and signal inference in diffusion-weighted image analysis (OBSIDIAN). Magn Reson Med. 2021;86(5):2716–32.
5. Richter PH. Estimating errors in least-squares fitting. Telecommun Data Acquis Rep. 1995; Available from: https://ntrs.nasa.gov/citations/19960009481
Figures
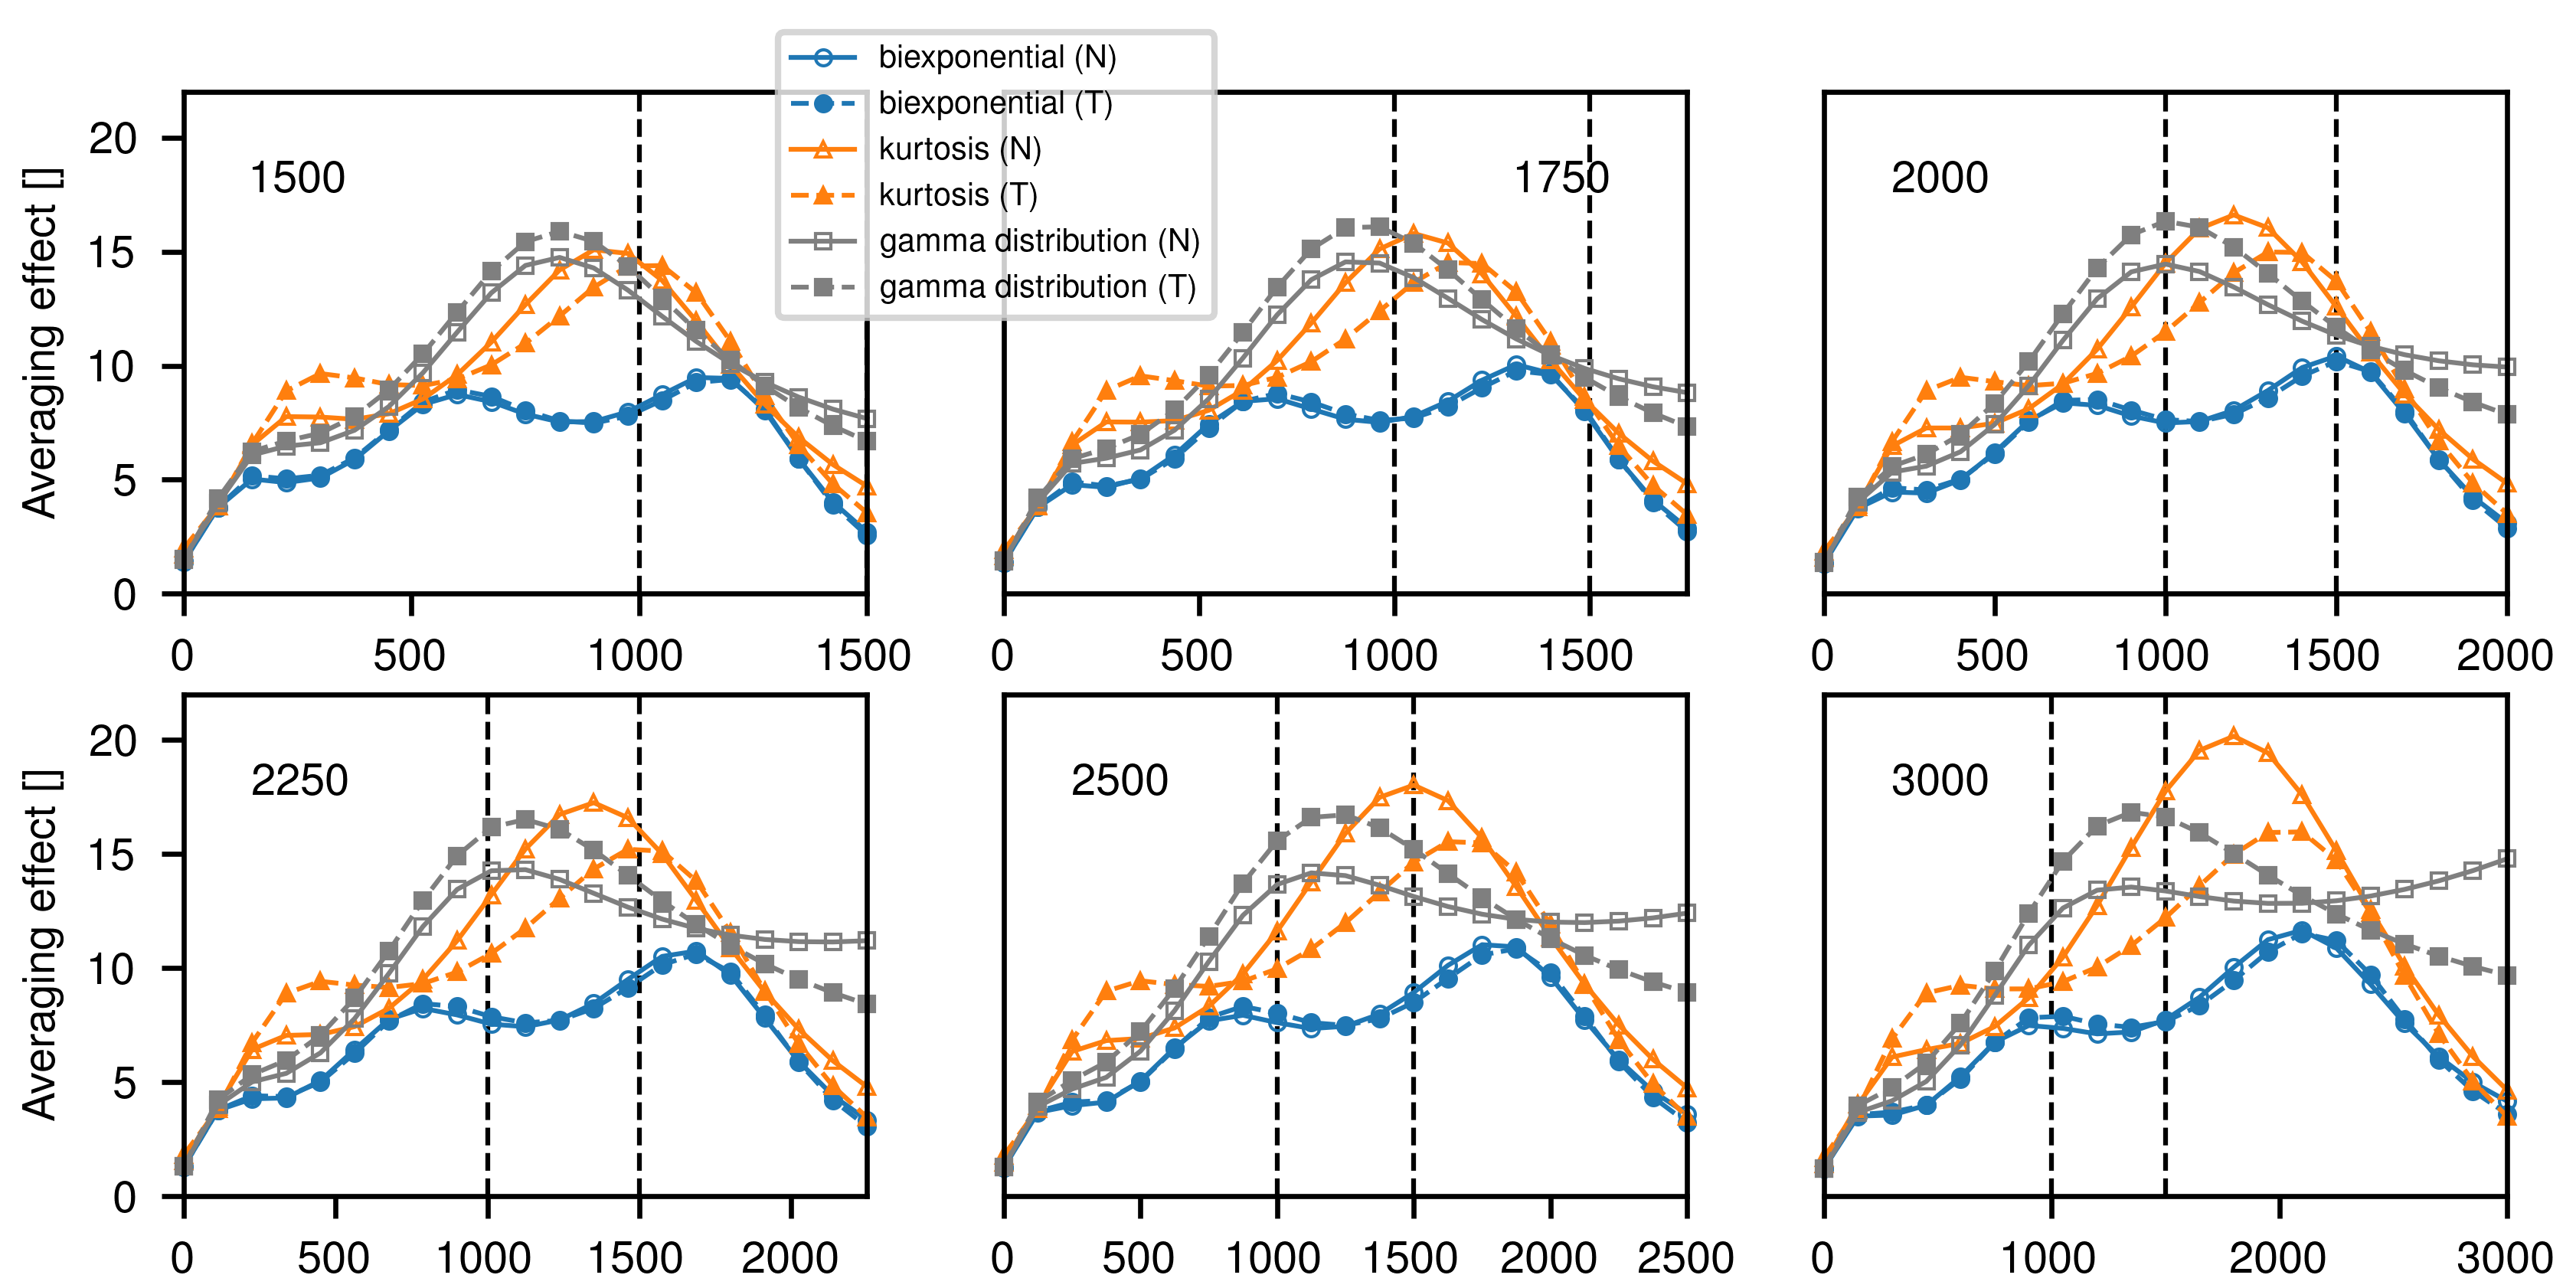
Figure 1: Average effect for different bmax (indicated in each plot) in normal (N) and tumorous (T) tissue model signal decays . Vertical dashed lines indicate b-values of 1000 and 1500 s/mm2. The averaging effect represents the amount of averages needed to achieve the same reduction in noise standard deviation in comparison to the fit (5). For all plots the b-value is shown on the x-axis. All b-values are given in s/mm2.
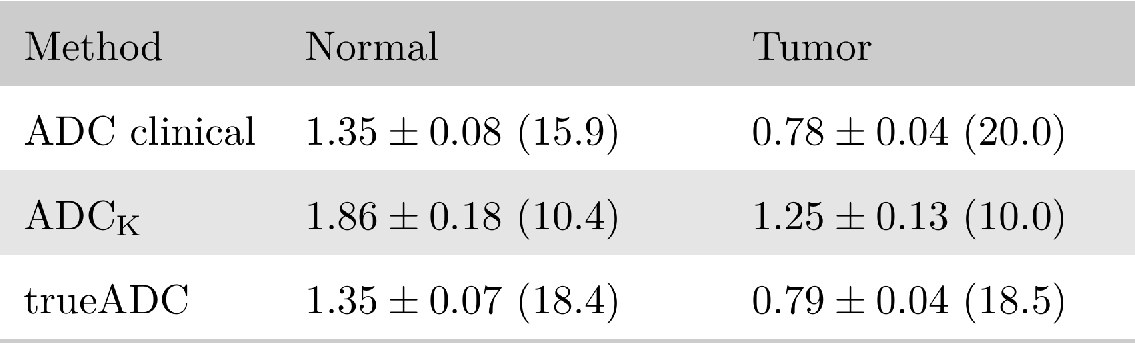
Figure 2: Comparison of ADC values for simulated signal in normal and tumor tissue at an SNR of 20. In parenthesis the ADC SNR is given, defined as the mean over the standard deviation. ADC clinical and trueADC were calculated by means of linear regression at b=0, 100, 1000 and 1500 s/mm2. In the clinical case the simulated signal was averaged six-fold before calculation whereas the fitted kurtosis signal Sfit was used to compute trueADC. ADC values are given in μm2/ms.
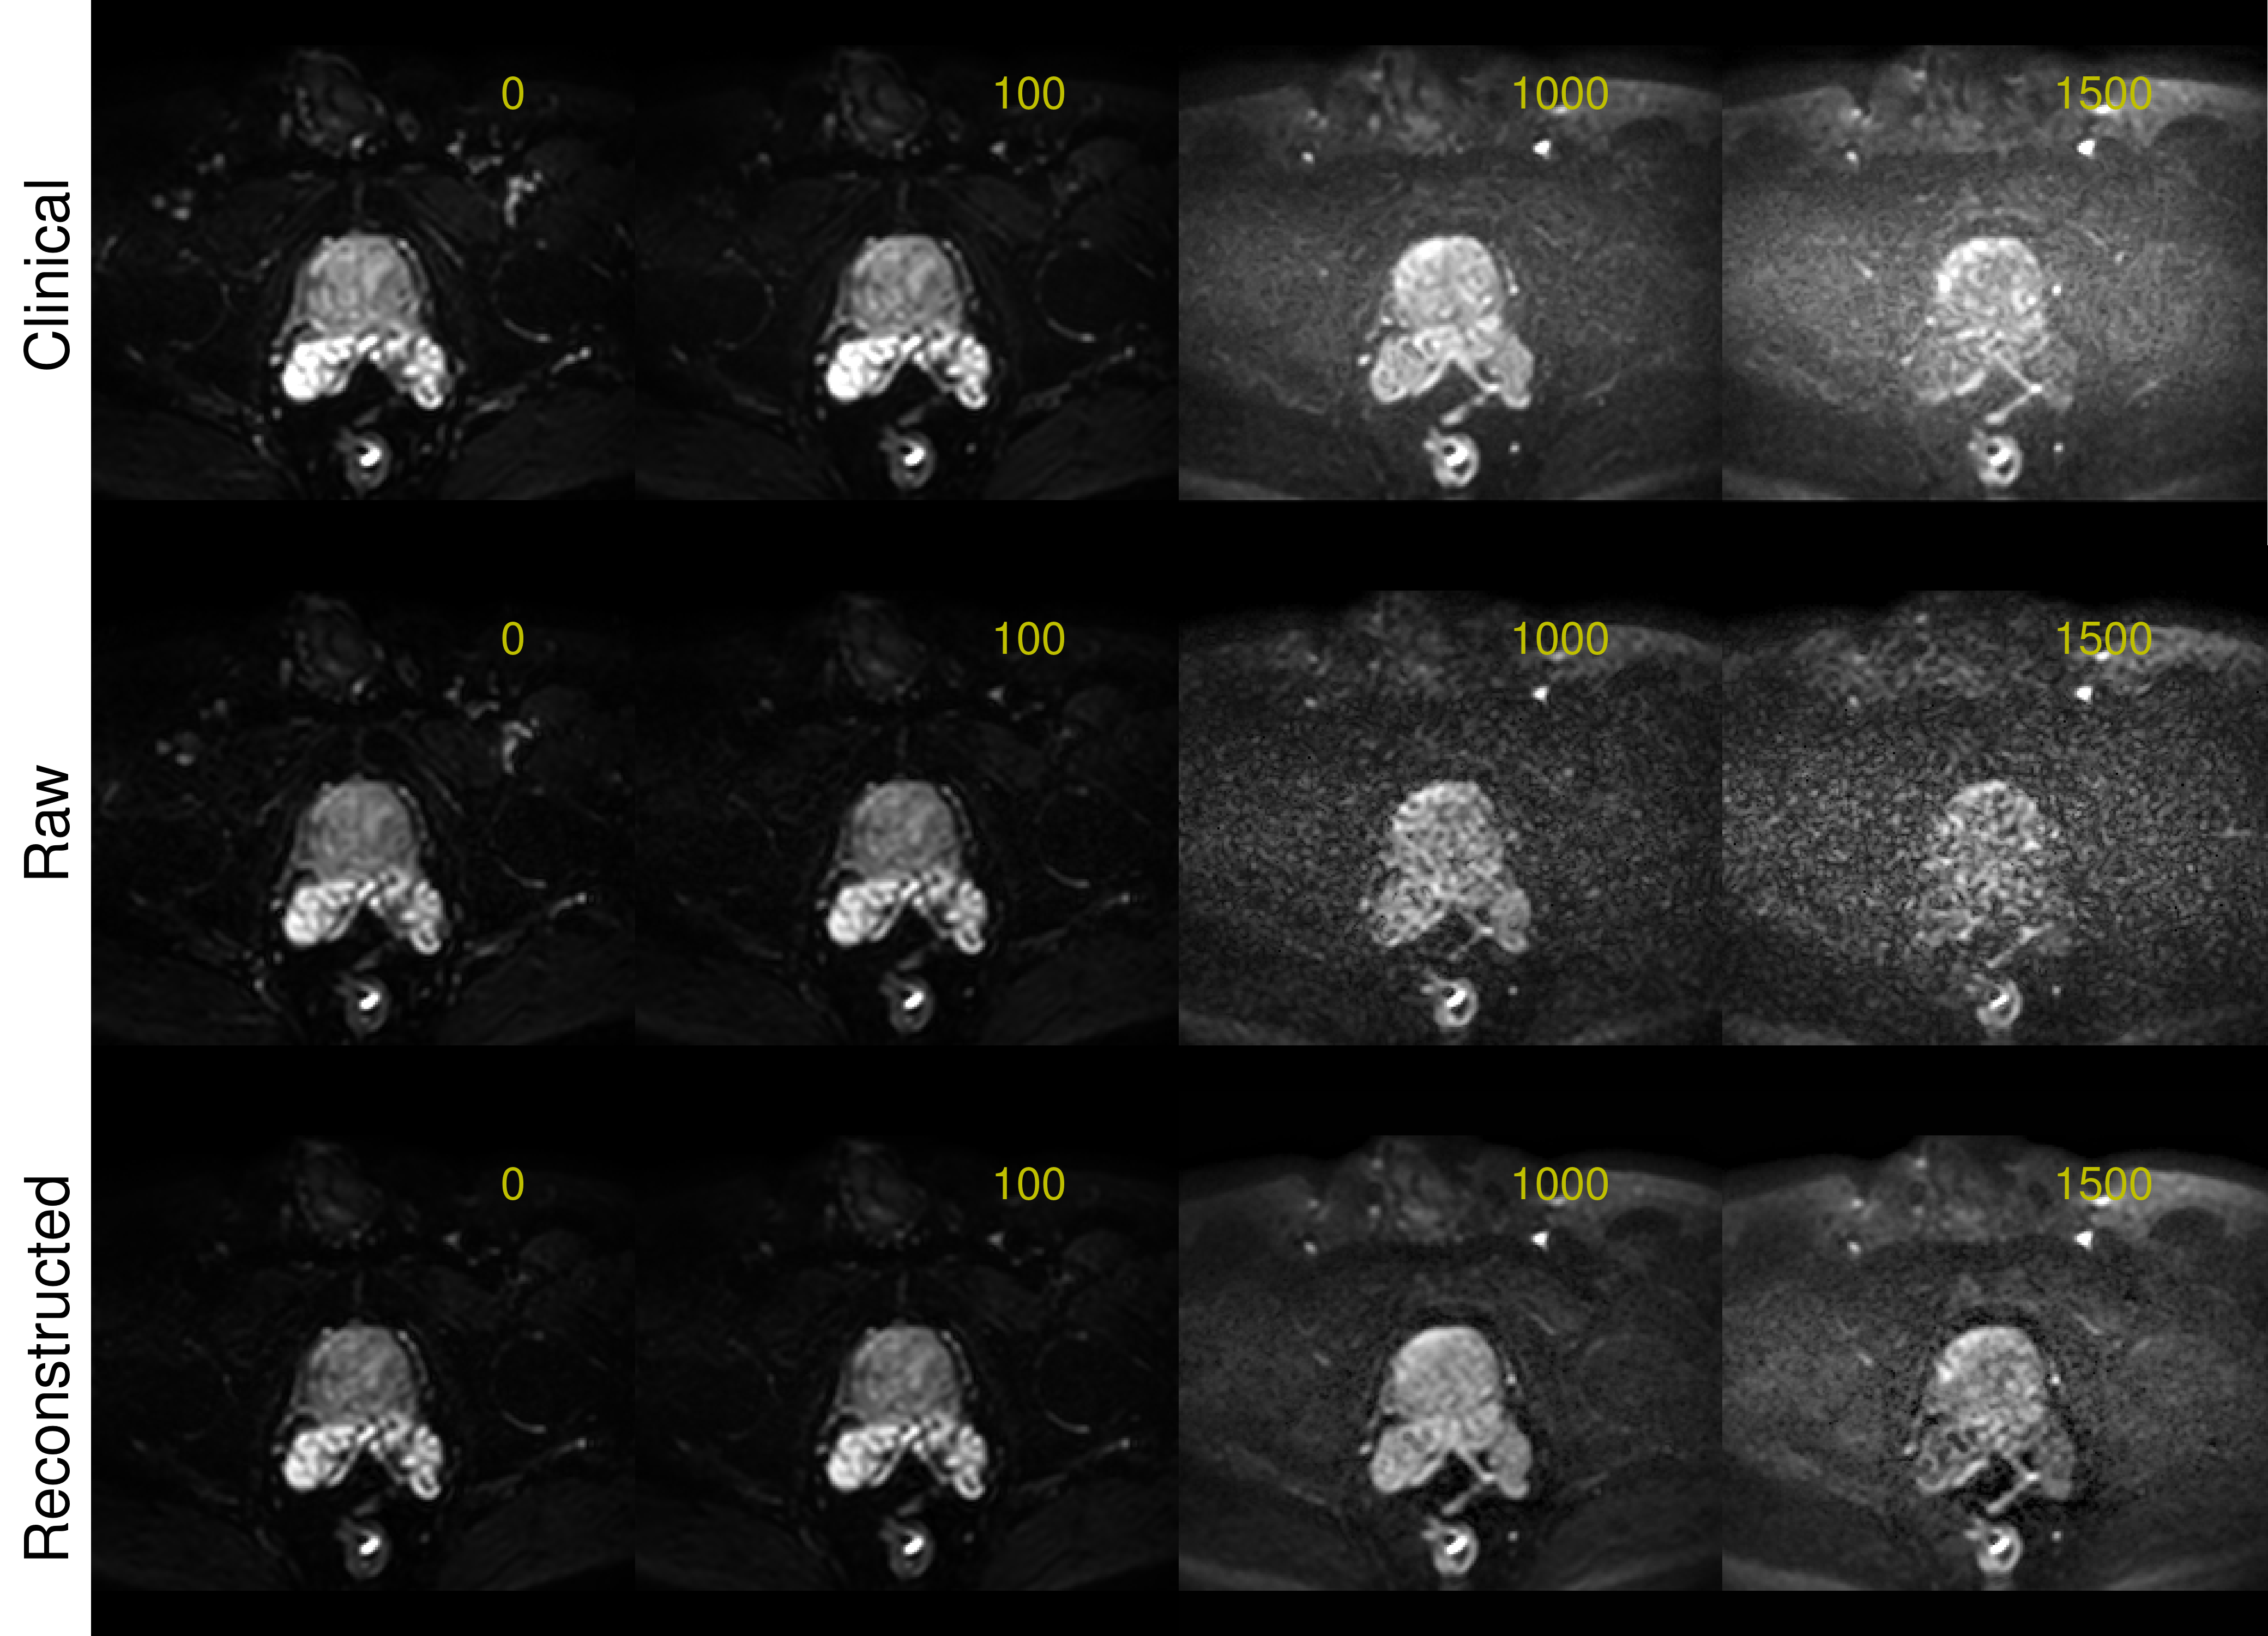
Figure 3: Images at b-values of 0, 100, 1000 and 1500 s/mm2 for the clinical protocol (6 averages, 3 directions, TE 78ms), for the raw data of the suggested protocol (no averages, 3 directions, TE 78ms) and for the reconstructed images by application of the OBSIDIAN. Both protocols use single-shot echo-planar imaging and two-fold multi-coil acceleration. For the suggested protocol a range of 21 evenly spaced b-values, ranging from 0 to bmax = 2000s/mm2, was applied.
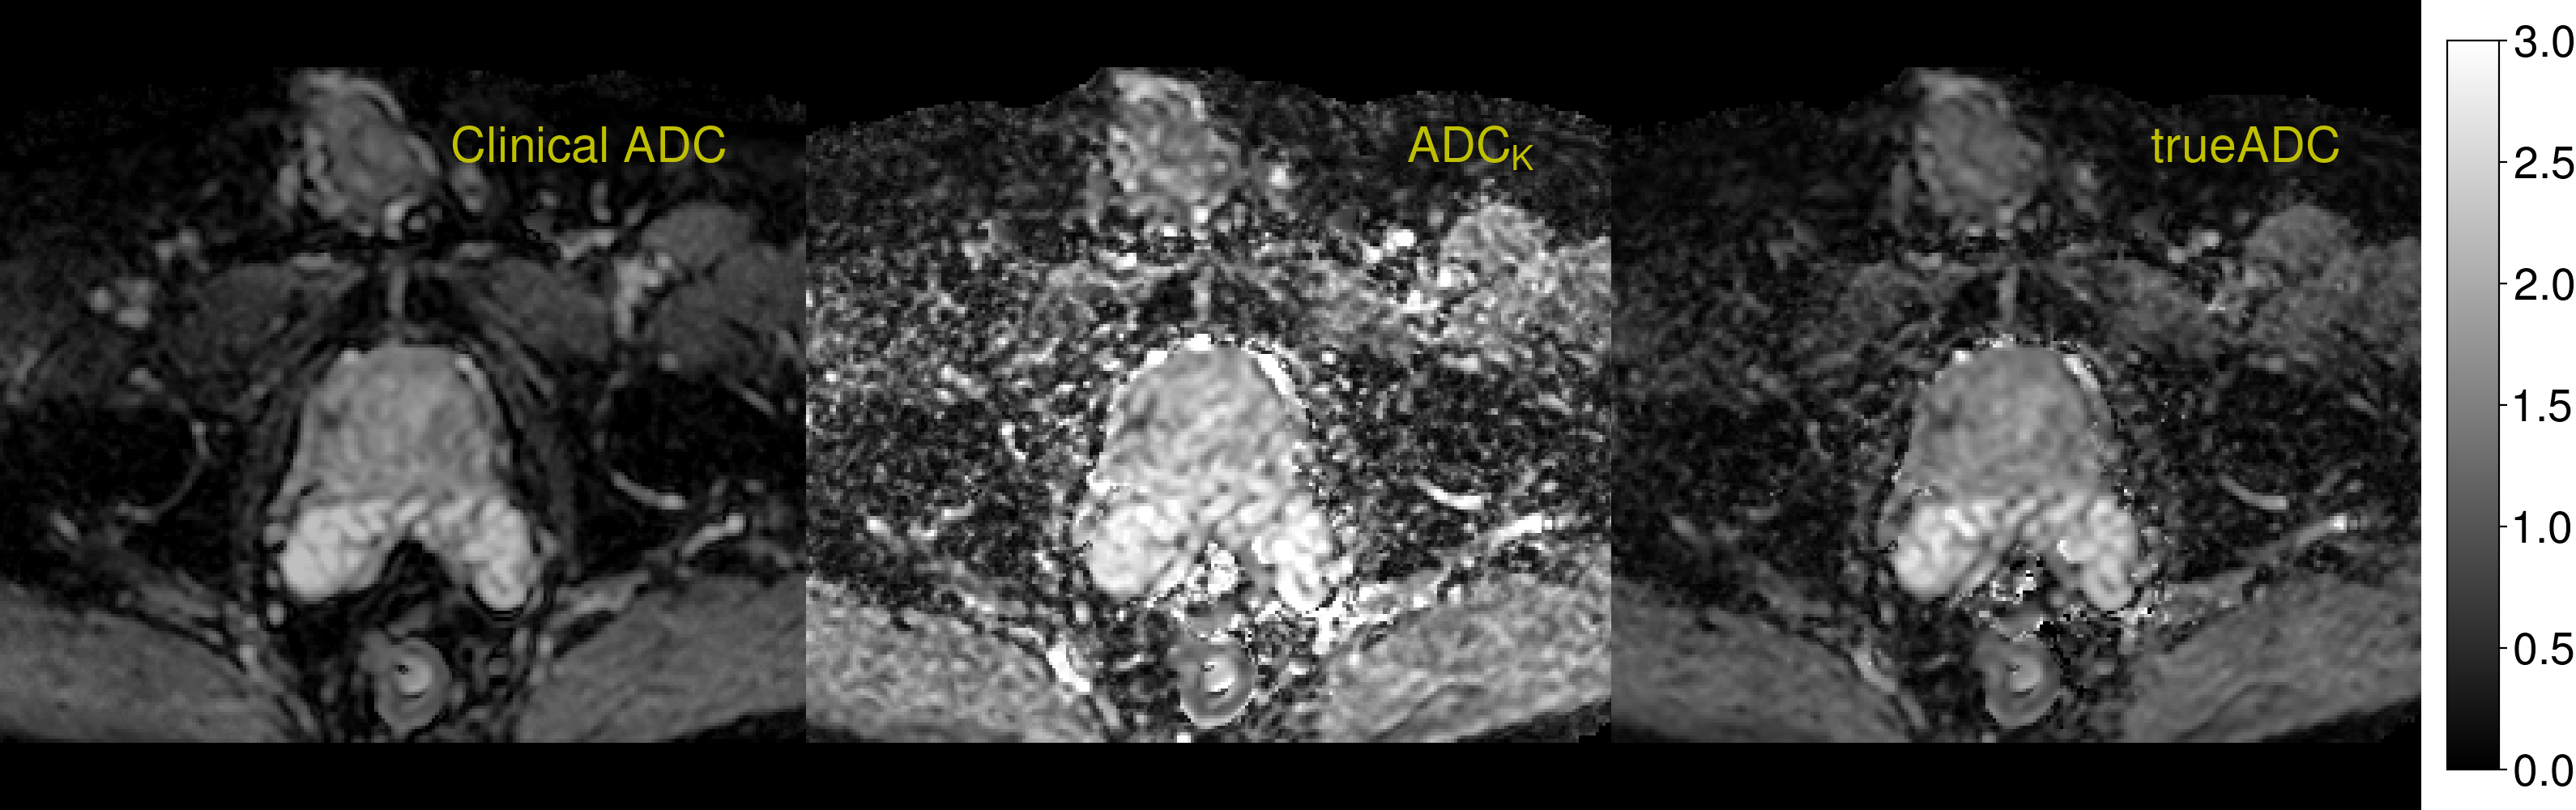
Figure 4: ADC maps computed by different procedures. Clinical ADC map is computed by the scanner software for b-values of 0, 100, 1000 and 1500 s/mm2 using linear regression. Kurtosis ADC map results from application of OBSIDIAN for the kurtosis model. trueADC is computed by linear regression of the synthesized images at same b-values of the clinical protocol.