1424
Voxelwise estimation of multiple response functions and fiber orientation distribution functions in diffusion MRI1Clinical Sciences Lund, Lund University, Lund, Sweden, 2University of Alberta, Edmonton, AB, Canada, 3Image Sciences Institute, UMC Utrecht, Utrecht, Netherlands
Synopsis
We present a framework to compute a response function for each voxel using a fingerprinting approach and a per voxel, per compartment estimation of the fiber orientation distribution (FOD) function for diffusion MRI. The method first matches the powder-averaged signal to a database of candidate signals and estimates a unique FOD from this matched signal for each compartment. This is done by turning the candidate signals into continuous Legendre polynomials, leading to a set of linear equations to estimate coefficients of the FODs, without requiring a prior segmentation or averaging multiple response functions.
Introduction
Diffusion MRI allows for non-invasive investigation of tissue microstructure by representing the signal in a voxel with a convolution between a fiber orientation distribution (FOD) and a symmetric kernel of diffusion. In the constrained spherical deconvolution (CSD) framework1,2, the same kernel (also called the response function (RF)) is used for every voxel by segmenting the main tissue types to estimate an average RF per tissue. In this work, we estimate multiple RFs and FODs in each voxel from any axially symmetric model of diffusion by matching the signal from a database of kernels to the powder-averaged data. The best matching RFs are then converted to a 1D Legendre polynomial for solving a simplified system of equations, which yields a unique set of RFs and FODs for each voxel.Datasets
We used a preprocessed dataset from the HCP project3 with b-values [40x0,64x1000,64x3000,128x5000,256x10000] s/mm2 and one dataset with tensor-valued diffusion encoding at b-values [12x100,6x1000,30x2000,45x2500,45x5000] s/mm2 and bdelta 0.63 and 1. This dataset was motion and gibbs ringing corrected as described previously4.Methods
A two compartment stick-and-zeppelin (resp. compartment C1 and C2) model purportedly capturing intra- and extra-axonal diffusion5 was used for the HCP dataset as defined by$$C_1=\exp(-b(D_{par}x^2))$$
$$C_2=\exp(-b((D_{par}-D_{perp})x^2+D_{perp}))$$
where b is the encoding strength, Dpar and Dperp the diffusivities and x=gTu is the cosine of the angle between the diffusion sensitizing gradient g and the principal axis of diffusion u. Note that x can only take values between [-1,1]. For the b-tensor encoded dataset, we have
$$C_{1,2}=\exp(-bD_{iso}(1+2b\Delta D\Delta L2(x))$$
with Diso the mean diffusivity, $$$D\Delta$$$ the diffusion anisotropy, $$$b\Delta$$$ the b-tensor anisotropy, and L2 the Legendre polynomial of order 2. For the stick compartment, $$$D\Delta$$$ is fixed to 1.
The database was built using the powder-averaged version of the compartments, discretizing Dpar and Dperp between [0, 3] um2/ms in steps of 0.1 um2/ms. The fractions were discretized between [0, 1] in steps of 0.01 and constrained such that f1 + f2 = 1. The parameters matching the powder averaged signal in a voxel and the database were found by maximizing the normalized inner product between the signal in each voxel and the database
$$\frac{<S,f_1C_1+f_2C_2>}{||S||_2||f_1C_1+f_2C_2||_2}$$
where $$$S$$$ is the signal measured in a voxel, <,> the inner product and ||.|| the euclidean norm as previously described6.
The best matching powder-averaged signal of each compartment was then fitted to a 1D Legendre polynomial along x, encoding continuously the orientation of the RFs since all other parameters are known at this point. Estimation of the FODs is done by converting the FODs to the spherical harmonics (SH) basis as follows
$$S(b,g)=\int_{S^2}(f_1K_1(b,g,u)+f_2K_2(b,g,u))\sum_{l=0}^L \sum_{m=-l}^l C_l^mY_l^m(u)d\Omega$$
where Ki is the RF for compartment i, $$$C_l^m$$$ the SH coefficients of even order l and degree m and $$$Y_l^m$$$ the real symmetric SH basis. The FODs of each compartment is found by converting the integral on the sphere to a 1D integral with the Funk-Hecke theorem7,8
$$S(b,g)=2\pi\sum_{l=0}^L\sum_{m=-l}^lC_l^mY_l^m(g)\int_{-1}^1[f_1K_1(b,t)+f_2K_2(b,t)]P_l(t)dt$$
Where Pl is the Legendre polynomial of even degree l. But since each RF is now a 1D Legendre polynomial with coefficients $$$C^n$$$, this simplifies to
$$S(b,g)=4\pi\sum_{l=0}^L\sum_{m=-l}^lC_l^mY_l^m(g)\sum_{n=0}^N(f_1C_1^n+f_2C_2^n)(\delta_{lm}/(2n+1))$$
by orthogonality of the Legendre polynomial. The dirac delta function $$$\delta_{lm}$$$ effectively cancels all odd order SH and Legendre polynomials $$$C_i^N$$$ of the RFs since we assume symmetry of the RF and FOD. The resulting system of linear equations is solved as a quadratic program2,8 to enforce positivity of the reconstructed FODs on the SH coefficients $$$C_l^m$$$. The FOD for the stick compartment was limited to order 6 and the FOD of the zeppelin compartment to order 2, yielding a system of equations with 34 unknown coefficients.
Results
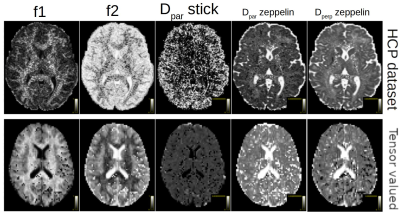
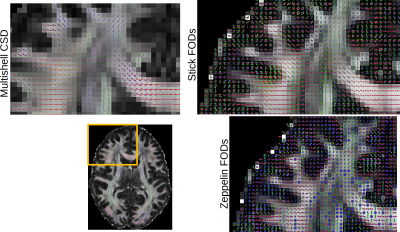
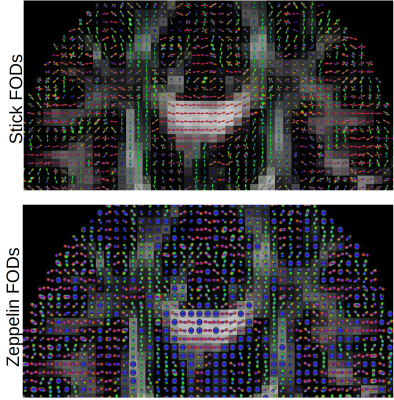
Figure 1 shows the parameters maps obtained from the powder-averaged datasets. Figure 2 shows FODs obtained on the HCP dataset. The proposed approach yields two FODs; one for the stick compartment and another for the zeppelin compartment, with a unique RF in each voxel. This separates the intra-axonal space from the extracellular space by design, providing contamination-free FODs and could potentially improve tractography in regions of partial voluming. Finally, figure 3 shows the FODs for the b-tensor encoded dataset, with the stick FODs once again capturing visually the main fiber pathways, while the zeppelin FOD captures diffusion perpendicular to these directions.Discussion & Conclusion
We have shown how to estimate a per voxel response function for each voxel by computing the correlation between the powder-averaged signal and a precomputed database of candidate compartments. The FOD associated with each individual RF can then be recovered by transforming these RFs into a continuous polynomial on the surface of the sphere. Although we used a stick (capturing the intra axonal space) and a zeppelin (capturing the extra axonal space) compartment, any other axisymmetric model could be used, providings specific FODs for a given compartment of choice. The behavior of the proposed method still needs to be assessed in diseased tissue or any other region where assuming a single canonical average RF might be inadequate. This could potentially enable new methods of analysis for the FODs as they can use a RF tuned to each voxel instead of being degenerated when the assumed RF is inadequate or segmentation of that tissue is difficult, such as in tumors.Acknowledgements
No acknowledgement found.References
1. Tournier et al. 2007 Neuroimage
2. Jeurissen et al. 2014 Neuroimage
3. Van Essen et al. 2012 Neuroimage
4. Lampinen et al. 2020 Magnetic Resonance in Medicine
5. Eriksson et al. 2015 The Journal of Chemical Physics
6. St-Jean et al. ISMRM 2021
7. Descoteaux et al. 2007 Magnetic Resonance in Medicine
8. Zucchelli et al. CDMRI 2018
Figures


