1423
Susceptibility corrected Proton Resonance Frequency Shift based MR Thermometry of hepatic Microwave Ablation in an in-vivo swine model
Marcel Gutberlet1,2, Enrico Pannicke2,3, Inga Bruesch4, Regina Rumpel4, Eva-Maria Wittauer4, Florian W. R. Vondran5, Frank Wacker1,2, and Bennet Hensen1,2
1Institute of Diagnostic and Interventional Radiology, Medical School Hannover, Hannover, Germany, 2STIMULATE-Solution Centre for Image Guided Local Therapies, Magdeburg, Germany, 3Department Biomedical Magnetic Resonance, Otto-von-Guericke University, Magdeburg, Germany, 4Institute for Laboratory Animal Science and Central Animal Facility, Medical School Hannover, Hannover, Germany, 5Clinic for General, Abdominal and Transplant Surgery, Medical School Hannover, Hannover, Germany
1Institute of Diagnostic and Interventional Radiology, Medical School Hannover, Hannover, Germany, 2STIMULATE-Solution Centre for Image Guided Local Therapies, Magdeburg, Germany, 3Department Biomedical Magnetic Resonance, Otto-von-Guericke University, Magdeburg, Germany, 4Institute for Laboratory Animal Science and Central Animal Facility, Medical School Hannover, Hannover, Germany, 5Clinic for General, Abdominal and Transplant Surgery, Medical School Hannover, Hannover, Germany
Synopsis
In microwave ablation (MWA), heat induced susceptibility changes impair the assessment of the ablation zones using proton resonance frequency shift based magnetic resonance (MR) thermometry. In this work, these heat related field changes were modelled to improve the accuracy of MR thermometry to monitor microwave ablation. In a study of hepatic MWA in an in-vivo swine model, the proposed method provided increased accuracy to assess the ablation zone compared to uncorrected MR thermometry.
Introduction
Microwave ablation (MWA) is a promising minimally invasive thermal treatment of hepatic malignancies (1-3): Since the insertion of the heat is robust against tissue properties like impedance, water content, perfusion and large vessels (heat sink effect), large, well-defined ablation zones may be produce within several minutes. Magnetic resonance (MR) thermometry allows monitoring and control of thermal ablation and may therefore reduce mortality, lower the rate of recurrence and shorten hospitalization of tumor patients. Temperature induced proton resonance frequency shift (PRFS) is the favored effect used in MR thermometry due to its tissue independent linear temperature dependency in the relevant range (4). However, PRFS based MR thermometry is impaired by any change of the image phase like motion or change of susceptibility (4-7). The increased heat deposition near the microwave applicator may ‘cook’ the tissue leading to low water content, tissue carbonization and gas formation (mainly nitrogen) (8). This finally changes magnetic susceptibility and therefore impairs MR thermometry (Figure 1). Purpose of this work was to improve MR thermometry of hepatic MWA by correction of head induced susceptibility changes near the microwave applicator.Methods
An in-vivo study of hepatic MWA in six swine was enrolled in accordance with the German law for animal protection and with approval by the local animal ethic committee. Intervention was performed on a 1.5 Tesla scanner (MAGNETOM Aera, Siemens Healthineers, Erlangen, Germany) using a commercial microwave generator (AveCure (MedWaves Inc., San Diego, USA), which was modified to switch into standy-by mode during MR acquisition to reduce electromagnetic interference. Microwave ablation was applied for 12 minutes with a target temperature of 120°C.PRFS-based MR thermometry was performed with a respiratory-triggered 2D spoiled gradient echo sequence (TE: 9.6ms, TR: 20ms, Flip Angle (FA): 12°, Field of View (FOV): 256x256mm², Matrix Size: 128x128, Slice Thickness (ST) 3mm, Bandwidth (BW): 260Hz/Pixel). Two parallel slices of the ablation zone perpendicular to the microwave applicator were acquired separately in consecutive breaths with a gap of 15 mm. To assess the shape of the ablation zone by MR thermometry, two different tissue damage models (52°C threshold (thresh52), Arrhenius damage integral (ADI)) were applied (9, 10).
To test for the accuracy of MR thermometry, in post-ablative 3D T1 weighted contrast-enhanced (T1w CE) spoiled gradient echo imaging (TE: 1.2ms, TR: 3.4ms, FA: 12°, FOV: 240x320mm², Matrix Size: 120x160, ST: 2mm, BW: 475Hz/Pixel) performed 1 minute after intravenous injection of 0.25mmol/kg of gadolinium ethoxybenzyl diethylenetriamine pentaacetic acid (Gd-EOB-DTPA) the ablation zone was manually segmented by an experienced radiologist.
Similar to Kickhefel et al. (11), to correct the temperature change $$$\Delta T_{PRFS}(t,x,y)$$$ assessed by MR thermometry for heat-induced susceptibility changes $$$\Delta \phi_{susc}$$$:
$$\Delta T_{cor}(t,x,y)=\Delta T_{PRFS}(t,x,y)+\frac{\Delta \phi_{susc}(t,x,y)}{\gamma \cdot B_0 \cdot TE \cdot \alpha}$$
near the microwave applicator (Figure 1) ($$$\gamma$$$ gyromagnetic ratio, $$$B_0$$$: static magnetic field, thermal coefficient: $$$\alpha=-0.01ppm/°C$$$), the corresponding field distortions were modelled by a cylinder of infinite length using the semi-automatically segmented signal void $$$S(t,x,y)$$$ in the 2D slices of MR imaging as base:
$$\Delta \phi_{susc} \approx \gamma \cdot H_0 \cdot TE \cdot \Delta \chi_{gas} \cdot FT^{(-1)}((\frac{1}{3}-\frac{k_z^2}{k^2})_{inf.cyl.} \cdot FT(S(t,x,y)-S(t_0,x,y))$$
($$$H_0$$$: unperturbed magnetic field strength, $$$\Delta \chi_{gas}$$$: susceptibility difference between tissue and gas formation). The Fourier transform of the cylinder was applied in the coordinate system with the axis of infinite length aligned in the z-direction. The function of the first factor in the brackets, where the z-axis is aligned with $$$B_0$$$, is transformed to the coordinate system of the cylinder and the product before inverse Fourier transform is applied over the non-zero k-space locations of the Fourier transform of the cylinder of infinite length. The accuracy of MR thermometry was evaluated by the Dice Coefficient (DC), the area and the minor and major axis lengths of the ablation zone in comparison to post-ablative T1w CE MR imaging.
Results
Exemplary, in Figure 2, temperature maps without and with the proposed susceptibility correction and temporal curves at four selected voxels are shown. The partially observed erroneous temperature decrease during ablation by uncorrected thermometry disappeared after susceptibility correction. Correspondingly, the ablation zones derived by susceptibility corrected MR thermometry provided a significantly better agreement with post-ablative T1w CE MR imaging than uncorrected thermometry (Figure 3): Dice coefficients of the ablation zones were significantly increased using susceptibility corrected MR thermometry (Table 1). The bias of the area of the ablation zone and the major and minor axis length were lower for susceptibility corrected MR thermometry than for uncorrected using post-ablative T1w CE MR imaging as reference (Table 2). Significant differences were only found for the major and minor axis of uncorrected MR thermometry compared to post-ablative T1w CE MR imaging.Discussion
Heat induced susceptibility changes reduce the accuracy of PRFS-based MR thermometry to assess the ablation zone in hepatic MWA. Modelling the susceptibility change in 2D MR thermometry with slices aligned perpendicular to the microwave applicator by a cylinder of infinite length significantly improved MR thermometry and the assessment of the ablation zone. Using 3D MR thermometry covering the total ablation zone may further improve correction of the heat related susceptibility changes near the microwave applicator.Conclusion
Reliable monitoring of hepatic MWA using PRFS-based MR thermometry requires correction of heat induced susceptibility changes.Acknowledgements
The work of this paper is funded by the Federal Ministry of Education and Research within the Research Campus STIMULATE under the numbers ‘13GW0473A’ and ‘13GW0473B’.References
- Vogl TJ, Nour-Eldin NA, Hammerstingl RM, Panahi B, Naguib NNN. Microwave Ablation (MWA): Basics, Technique and Results in Primary and Metastatic Liver Neoplasms - Review Article. Rofo 2017;189(11):1055-1066.
- Izzo F, Granata V, Grassi R, et al. Radiofrequency Ablation and Microwave Ablation in Liver Tumors: An Update. Oncologist 2019;24(10):e990-e1005.
- Lubner MG, Brace CL, Hinshaw JL, Lee FT, Jr. Microwave tumor ablation: mechanism of action, clinical results, and devices. J Vasc Interv Radiol 2010;21(8 Suppl):S192-203.
- Rieke V, Butts Pauly K. MR thermometry. J Magn Reson Imaging 2008;27(2):376-390.
- Graham SJ, Stanisz GJ, Kecojevic A, Bronskill MJ, Henkelman RM. Analysis of changes in MR properties of tissues after heat treatment. Magn Reson Med 1999;42(6):1061–71.
- Sprinkhuizen SM, Konings MK, van der Bom MJ, Viergever MA, Bakker CJ, Bartels LW. Temperature-induced tissue susceptibility changes lead to significant temperature errors in PRFS-based MR thermometry during thermal interventions. Magn Reson Med 2010;64(5):1360–72.
- Mingming Wu, Hendrik T. Mulder, Paul Baron, Eduardo Coello, Marion I. Menzel, Gerard C. van Rhoon, Axel Haase. Correction of motion-induced susceptibility artifacts and B0 drift during proton resonance frequency shift-based MR thermometry in the pelvis with background field removal methods. Magn Reson Med 2020;84:2495–2511
- Madore B. MR Thermometry. Advances in Magnetic Resonance Technology and Applications 2020;1:885-905
- Kickhefel A, Rosenberg C, Weiss CR, et al. Clinical evaluation of MR temperature monitoring of laser-induced thermotherapy in human liver using the proton-resonance-frequency method and predictive models of cell death. J Magn Reson Imaging 2011;33(3):704-712.
- Whitney J, Carswell W, Rylander N. Arrhenius parameter determination as a function of heating method and cellular microenvironment based on spatial cell viability analysis. Int J Hyperthermia 2013;29(4):281-295.
- Kickhefel A, Weiss C, Roland J, Gross P, Schick F, Salomir R. Correction of susceptibility-induced GRE phase shift for accurate PRFS thermometry proximal to cryoablation iceball. MAGMA 2012;25(1):23-31.
Figures
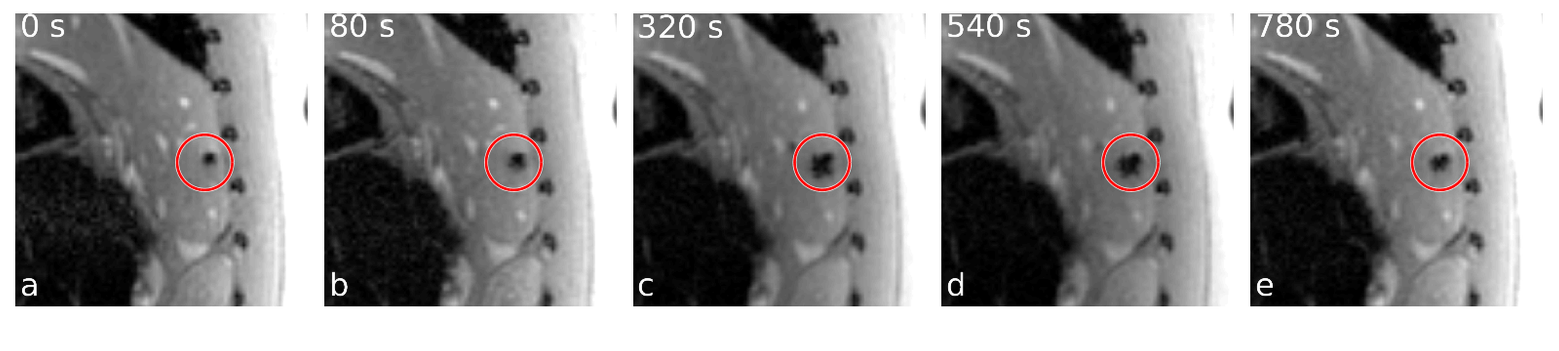
Figure 1: The area of the signal void surrounding the
microwave applicator, aligned perpendicular to the imaging plane, increases
during ablation due to reduced water content, tissue carbonization and gas
formation.
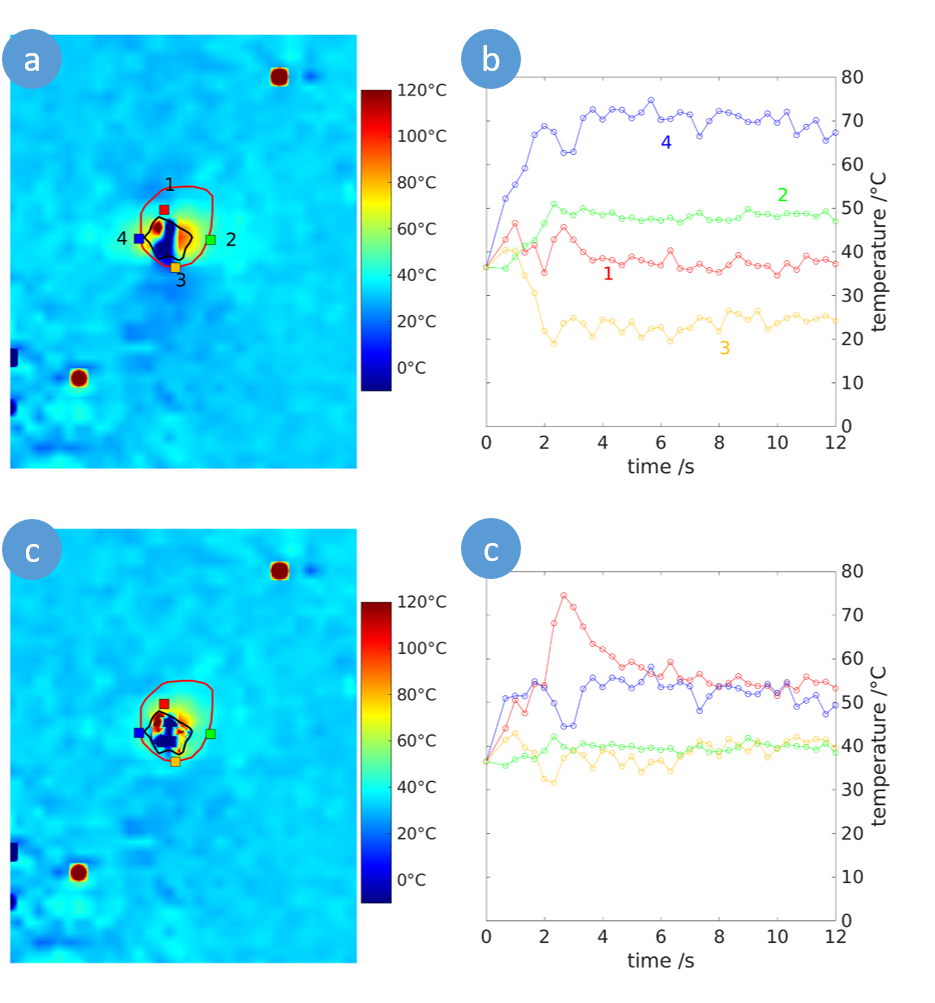
Figure 2: Temperature map of the ablation zone
perpendicular to the microwave applicator for uncorrected (a) and susceptibility
corrected MR thermometry. The ablation zone assessed by T1 weighted
post-ablative contrast-enhanced MR imaging is indicated by the red line and the
zone of the signal void is marked by the black line. Correspondingly, at four
selected voxels (red, blue, green and orange squares) the temporal temperature
curves during ablation are given without (b) and with (c) susceptibility
correction.
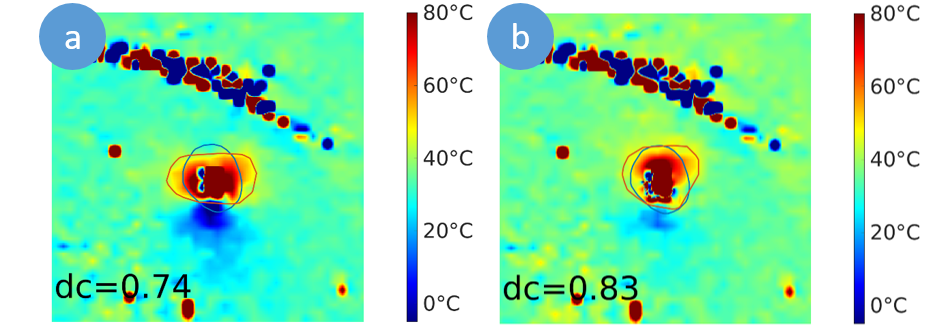
Figure 3: Temperature maps and ablation zones (red line)
of uncorrected (a) and susceptibility corrected (b) MR thermometry modelled by
the 52° threshold model in comparison to post-ablative T1 weighted
contrast-enhanced MR imaging (blue line) with the corresponding dice
coefficients (dc).
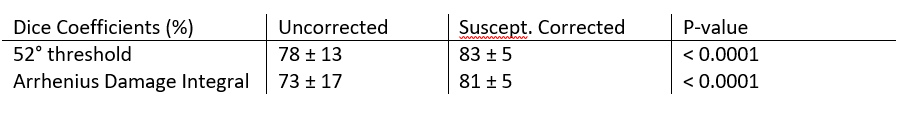
Table 1: Dice coefficients (median and interquartile
range) of ablations zones assessed by uncorrected and susceptibility corrected
MR thermometry compared to T1 weighted post-ablative contrast-enhance MR
imaging. Significantly increased dice coefficients were found for susceptibility
corrected thermometry (P-values from one-sided Wilcoxon signed rank test).
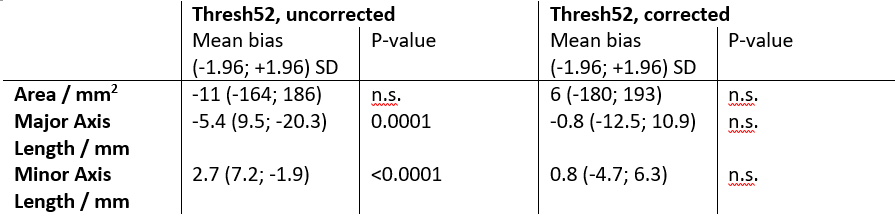
Table 2: Mean bias (with 1.96 standard deviation (SD) of
the difference) and test for significant difference (Wilcoxon signed rank test,
n.s.: not significant) of the area and major and minor axis of the ablation
zones assessed by uncorrected and susceptibility corrected MR thermometry using
52° threshold as tumor damage model in comparison to T1 weighted post-ablative
contrast-enhanced MR imaging.
DOI: https://doi.org/10.58530/2022/1423