1422
Quantitative T1D assessment in lipid membranes: Jeener-Broekaert NMR vs. ihMT MRI1Aix Marseille Univ, CNRS, CRMBM, Marseille, France, 2APHM, Hôpital Universitaire Timone, CEMEREM, Marseille, France, 3CBMN UMR 5248, CNRS, University of Bordeaux, Bordeaux INP, Pessac, France, 4Division of MR Research, Radiology, Beth Israel Deaconess Medical Center, Harvard Medical School, Boston, MA, United States
Synopsis
Introduction
Slow collective membrane motional processes (1 to 107 Hz) are the main driving mechanisms of dipolar relaxation1. The dipolar relaxation time (T1D) could thus serve as a probe to further understand the myelin membrane dynamics and the relationship with its biological function. Inhomogeneous Magnetization Transfer (ihMT)2 data are amenable to quantitative analyses (qihMT) and provide access to various parameters of interest3–5. In particular, variations of the switching time (Δt) between the application of RF pulses at positive and negative offset frequencies in the dual saturation were previously used to estimate T1D in clinical4 and preclinical studies6 in healthy Central Nervous System tissues. However, T1D values derived from ihMT have yet to be validated. In this study, we propose to compare the T1D values estimated with qihMT and the gold-standard NMR Jeener-Broekaert (JB) sequence7 on a synthetic model of lipid membrane mimicking myelin.Methods
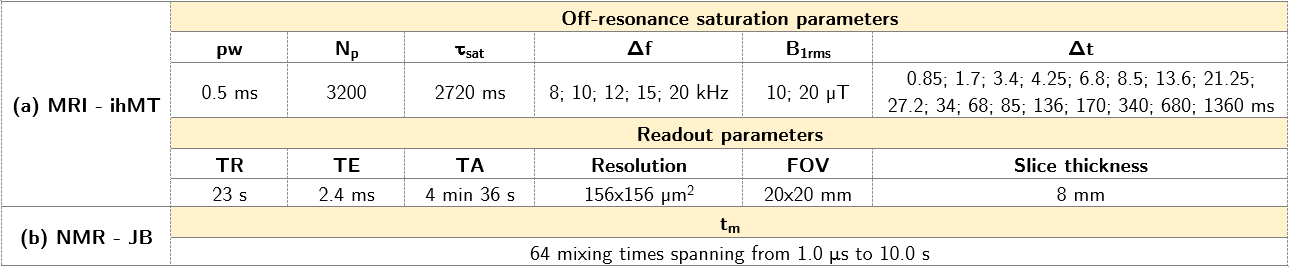
Synthetic membrane: Three types of lipids were weighted to obtain a molar ratio of 40%/40%/20% (POPC/Cholesterol/Cerebrosides) for a total mass of 25 mg. The powder blend was dissolved in an organic solvent to assure a homogeneous mixture. After removal of the solvent, the resultant dry lipid film was hydrated in 100 µL of D2O for the NMR experiments or in 100 µL of H2O for the MRI experiments. After three liposome formation cycles (vortex/freeze/thaw) the multilamellar vesicle suspension was transferred into test tubes for experimentation.Data acquisition and processing: All experiments were carried out at 500 MHz (NMR: Bruker Avance III spectrometer equipped with a 1H-X CP/MAS probe for 4-mm rotors; MRI: Bruker Avance, 89-mm wide bore vertical imager) with a sample’s temperature maintained at 298 K.
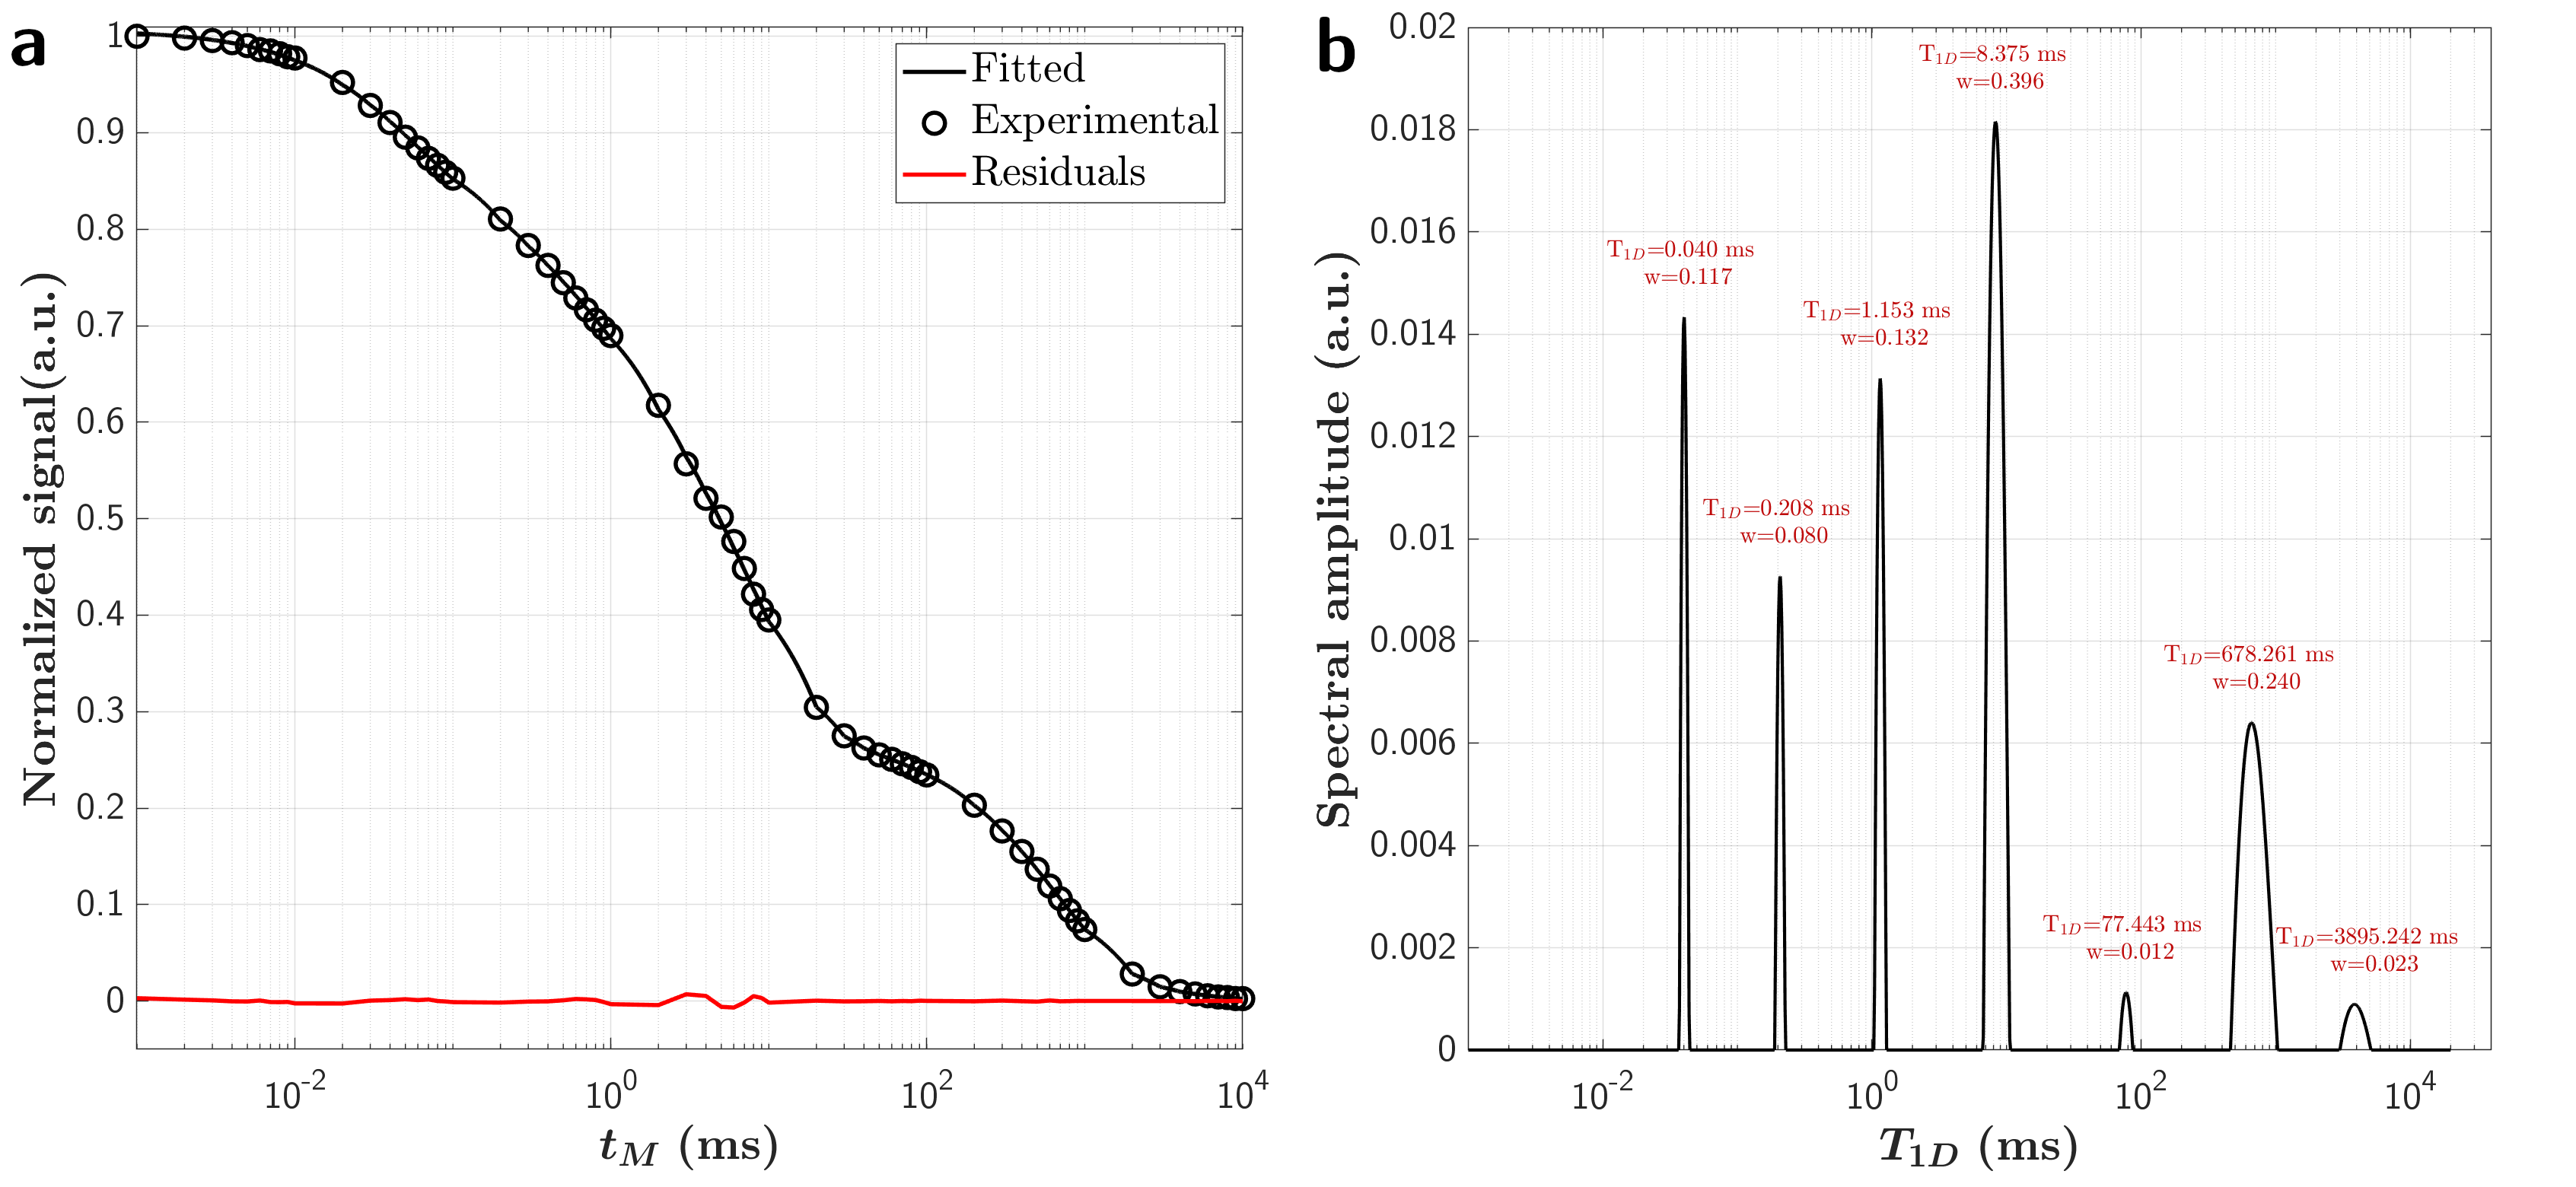
NMR: Jeener-Broekaert experiments were performed at various mixing time values (tm; Table 1). The signal decay, normalized to that of the first tm, follows a multi-exponential decay (equation 1):
$$ S_\text{JB}(t_m) = \sum_{i=1}^N \alpha_i e^{-t_m/T_{1D,i}} $$
A Non-Negative Least-Square algorithm was used to decompose the decay curve into multiple T1Ds from a distribution of 1280 logarithmically spaced T1D values ranging from 1.0 μs to 40.0 s. For each detected lobe within the estimated distribution, the associated geometric mean and weight (area under the curve) are reported.
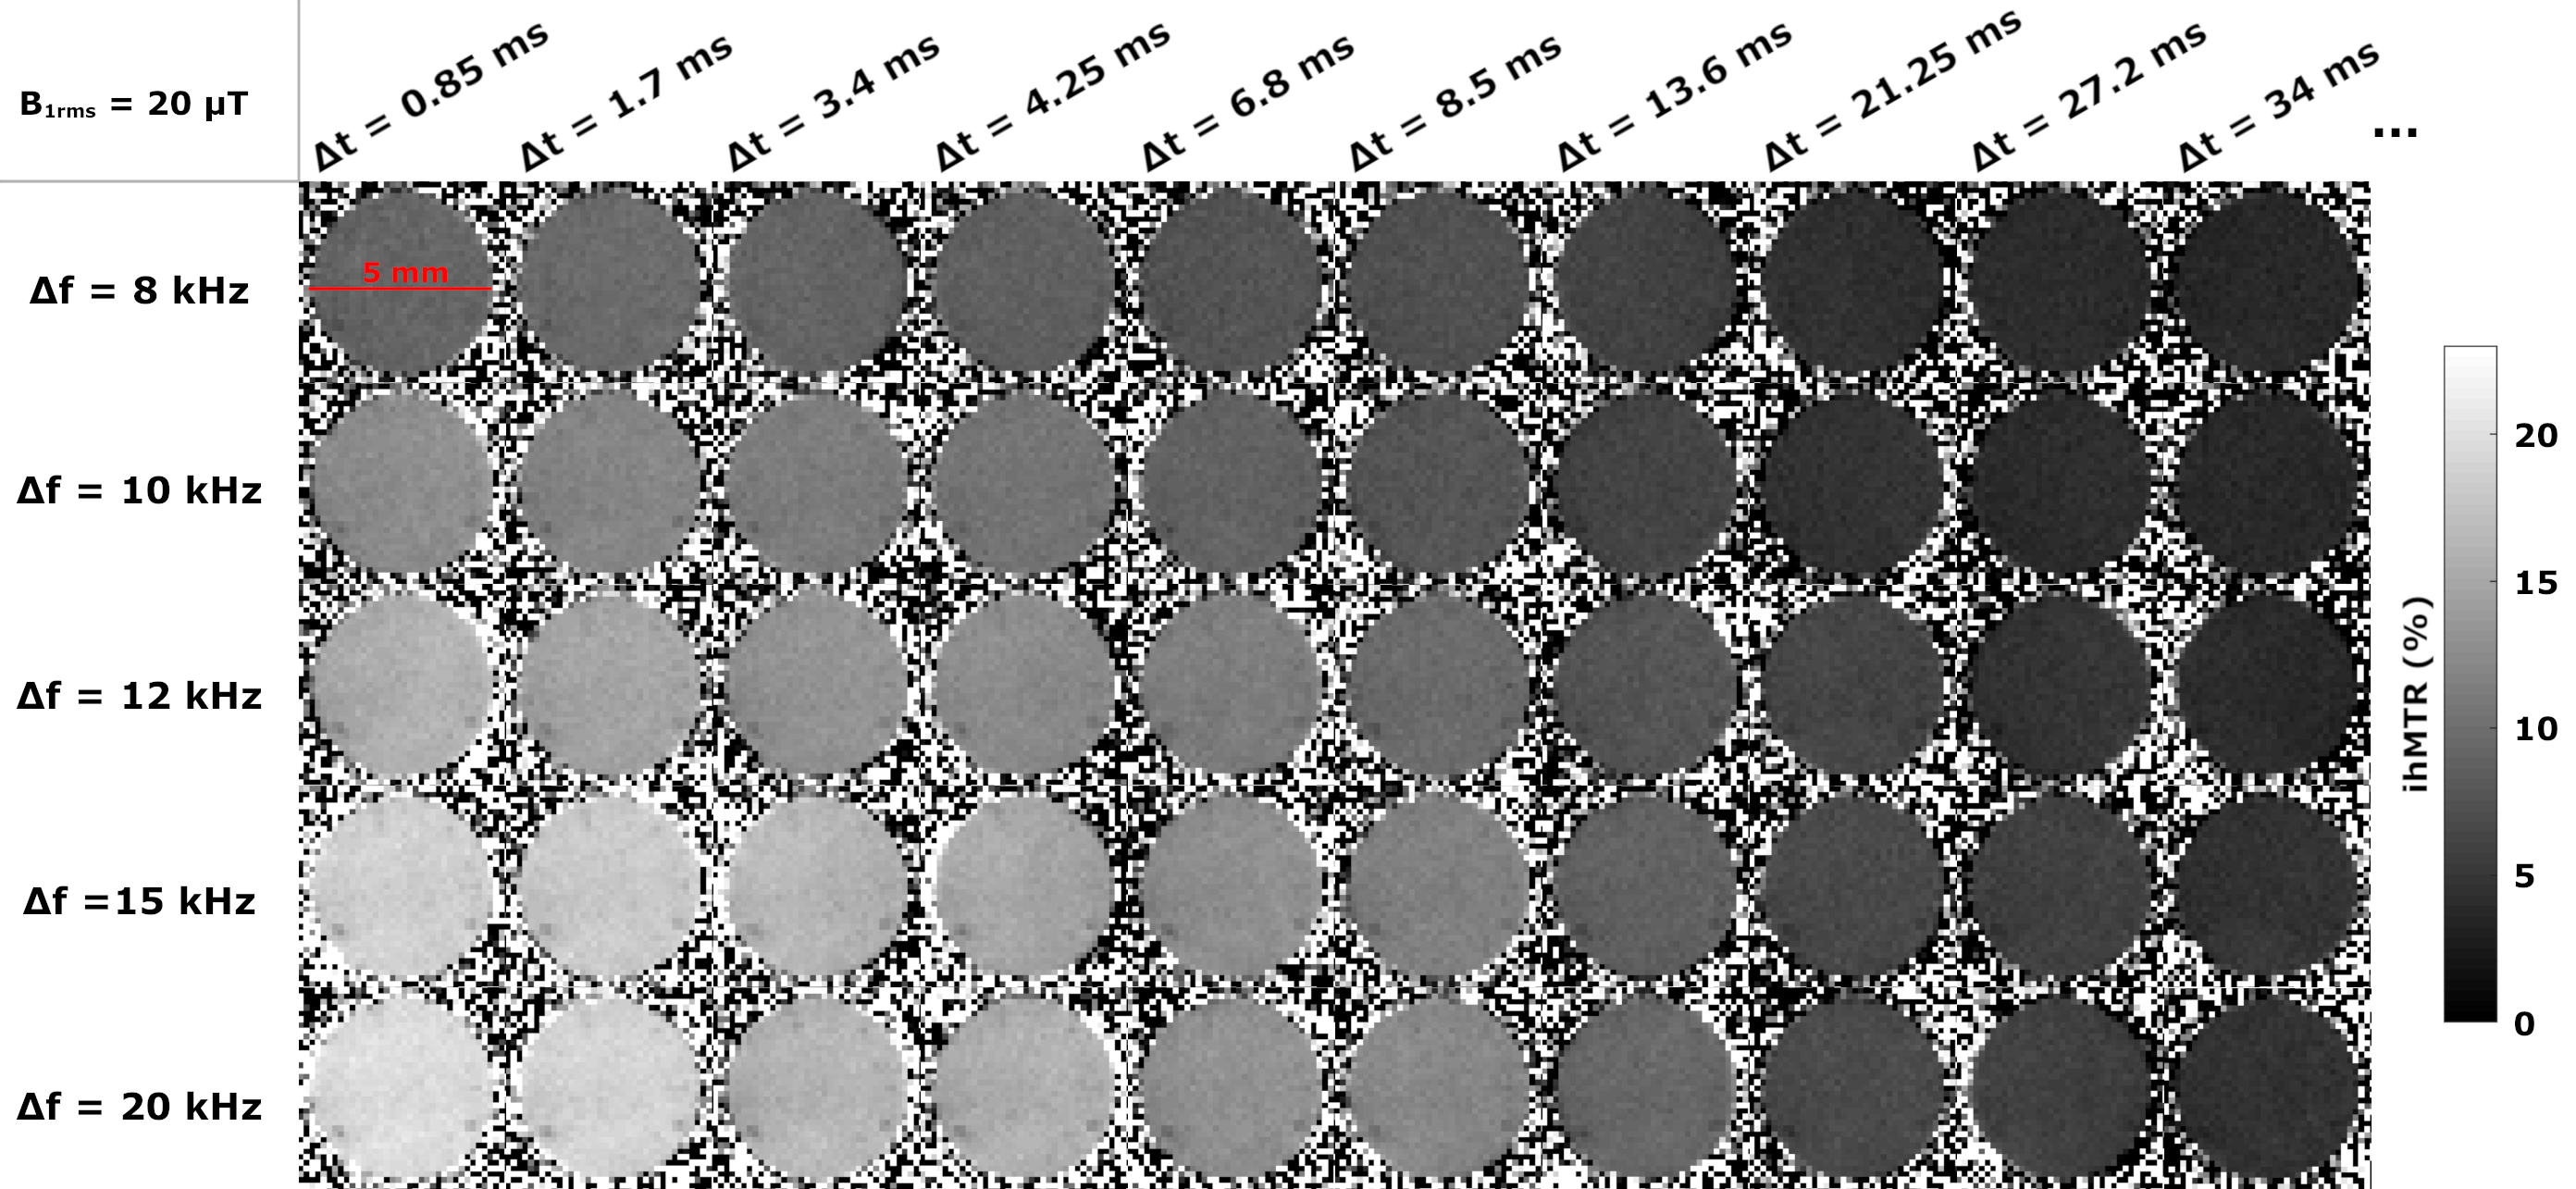
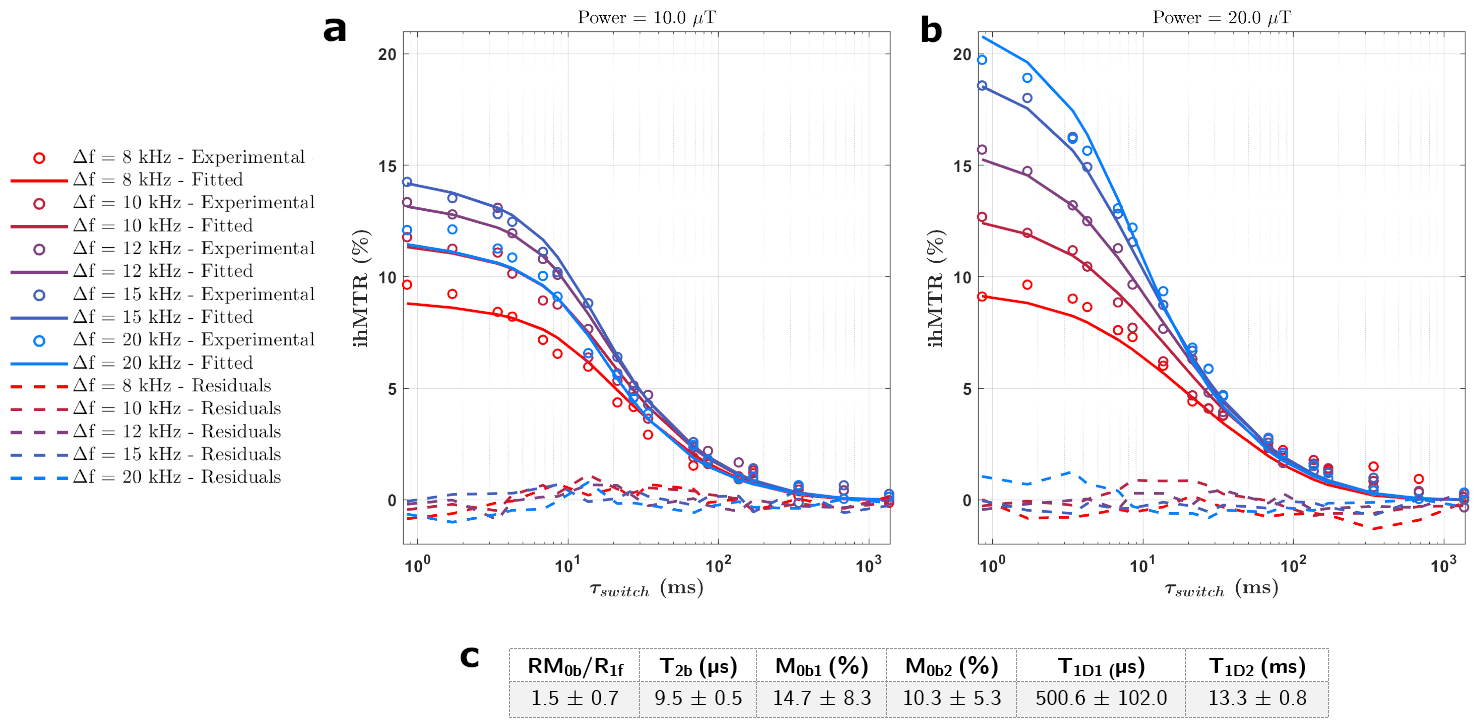
MRI: IhMT experiments were performed using an ihMT-prepared RARE sequence8. The experimental design included the variation of saturation parameters across three experimental dimensions: frequency offset Δf, pulse power B1rms, and switching time Δt (Table 1), for 170 total experimental data points. A quantitative multi-T1D ihMT model6 was used to estimate the qihMT parameters. All macromolecular pools associated with various T1Ds were assumed to share the same exchange rate (R) and transverse relaxation time (T2b). R1b, the longitudinal relaxation rate of the Zeeman macromolecular pools was fixed to 1 s-1 and T2f, the transverse relaxation time of the water pool, was fixed to 100 ms.
Processing: To evaluate the feasibility of estimating multiple T1D components with ihMT, Cramér-Rao Lower Bounds (CRLB)9 for a multi-compartment qihMT framework were estimated from the experimental design (Table 1), using the T1D values and associated M0bs equivalent to the values and weights estimated from the JB analyses.
Results
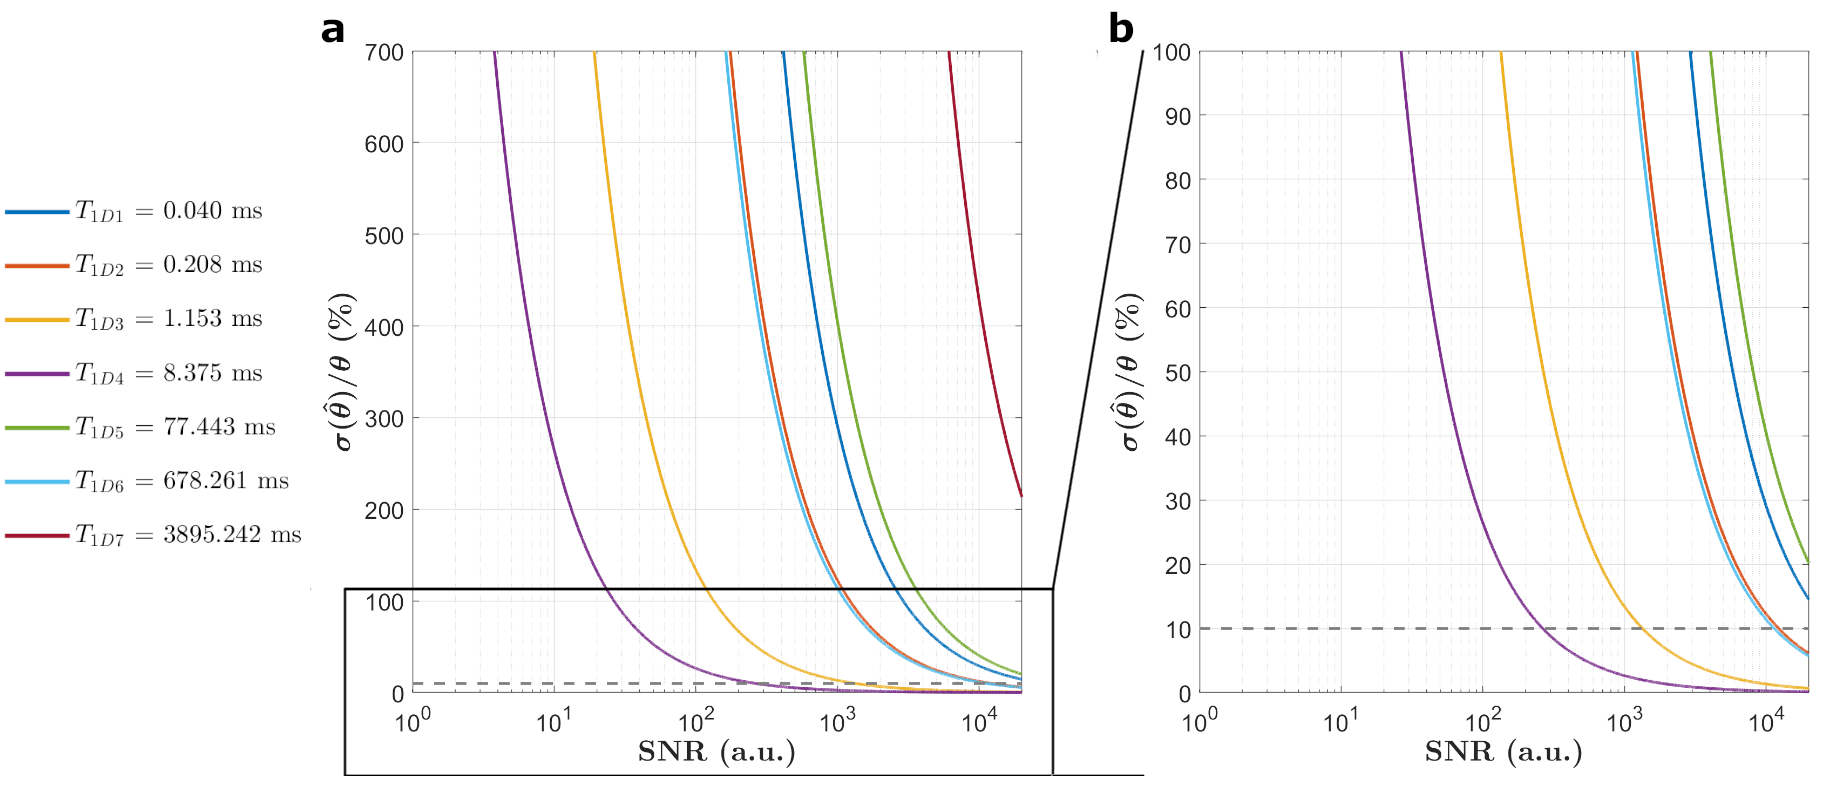
Figure 1 presents the T1D spectrum estimated from the JB experiments. A total of seven components were estimated (T1D values of 40.0 µs, 208.0 µs, 1.2 ms, 8.4 ms, 678.3 ms for weights>8%). Figure 2 shows representative ihMT ratio images along the Δt and Δf dimensions at B1rms=20 µT. The qihMT fitting curves for a bi-T1D model applied to experimental data points are illustrated in Figure 3. The estimated T1Ds were 500.6±102.0 µs and 13.3±0.8 ms (associated M0bs 14.7±8.3% and 10.3±5.3%, respectively). Including more T1D components in the qihMT model failed to estimate parameters with reasonable standard errors (not shown). As such, a CRLB analysis was performed in our experimental framework for the seven JB-T1D components and assuming RM0b/R1f=1.5, T2b=9.5 µs (Figure 3). Figure 4 shows the normalized CRLB standard deviation of each T1D component as a function of the signal-to-noise ratio (SNR). These results demonstrate that the experimental design does not allow to resolve more than two T1D components (T1D of 1.2 ms and 8.4 ms from the JB spectrum) with a suitable error (<10%) given our experimental SNR of 2000.Discussion and Conclusions
Of the seven components revealed by JB and putatively characterizing the synthetic membrane, qihMT and the proposed experimental design revealed up to two T1Ds in the range of the expected ones. The SNR is one identified cause of not being able to quantify the remaining components given the current acquisition protocol. A one-to-one comparison between T1Ds estimated by JB and qihMT is not straightforward. While JB experiments directly interrogate the semisolid pool, the ihMT signal relies on the exchange between the semisolid and the free water pools which may not occur for all components. As such, some of the components estimated by JB might not exchange and the estimated spectrum using MRI would contain less T1Ds. Exchange can also impact the underlying T1Ds, thus comparing T1Ds measured in D2O by JB to those with ihMT in H2O may be an error source. Nonetheless, these interesting results call for a more optimized experimental design, which will be performed in future investigations using CRLB.Acknowledgements
This work was supported by the French National Research Agency, ANR [ANR‐17‐CE18‐0030] and ARSEP 2020.References
1. Dufourc, E. J.; Mayer, C.; Stohrer, J.; Althoff, G.; Kothe, G. Dynamics of Phosphate Head Groups in Biomembranes. Comprehensive Analysis Using Phosphorus-31 Nuclear Magnetic Resonance Lineshape and Relaxation Time Measurements. Biophys. J. 1992, 61 (1), 42–57. https://doi.org/10.1016/S0006-3495(92)81814-3.
2. Varma, G.; Duhamel, G.; de Bazelaire, C.; Alsop, D. C. Magnetization Transfer from Inhomogeneously Broadened Lines: A Potential Marker for Myelin: Magnetization Transfer from Inhomogeneously Broadened Lines. Magn. Reson. Med. 2015, 73 (2), 614–622. https://doi.org/10.1002/mrm.25174.
3. Varma, G.; Girard, O. M.; Prevost, V. H.; Grant, A. K.; Duhamel, G.; Alsop, D. C. Interpretation of Magnetization Transfer from Inhomogeneously Broadened Lines (IhMT) in Tissues as a Dipolar Order Effect within Motion Restricted Molecules. J. Magn. Reson. 2015, 260, 67–76. https://doi.org/10.1016/j.jmr.2015.08.024.
4. Varma, G.; Girard, O. M.; Prevost, V. H.; Grant, A. K.; Duhamel, G.; Alsop, D. C. In Vivo Measurement of a New Source of Contrast, the Dipolar Relaxation Time, T 1 D , Using a Modified Inhomogeneous Magnetization Transfer (IhMT) Sequence: In Vivo Measurement of T 1D Using IhMT. Magn. Reson. Med. 2017, 78 (4), 1362–1372. https://doi.org/10.1002/mrm.26523.
5. Varma, G.; Girard, O. M.; Mchinda, S.; Prevost, V. H.; Grant, A. K.; Duhamel, G.; Alsop, D. C. Low Duty-Cycle Pulsed Irradiation Reduces Magnetization Transfer and Increases the Inhomogeneous Magnetization Transfer Effect. J. Magn. Reson. 2018, 296, 60–71. https://doi.org/10.1016/j.jmr.2018.08.004.
6. Carvalho, V. N. D.; Hertanu, A.; Grélard, A.; Mchinda, S.; Soustelle, L.; Loquet, A.; Varma, G.; Alsop, D. C.; Thureau, P.; Girard, O. M.; Duhamel, G. MRI Assessment of Multiple Dipolar Relaxation Time ( T 1 D ) Components in Biological Tissues Interpreted with a Generalized Inhomogeneous Magnetization Transfer (IhMT) Model. J. Magn. Reson. 2019, 106668. https://doi.org/10.1016/j.jmr.2019.106668.
7. Jeener, J.; Broekaert, P. Nuclear Magnetic Resonance in Solids: Thermodynamic Effects of a Pair of Rf Pulses. Phys. Rev. 1967, 157 (2), 232–240. https://doi.org/10.1103/PhysRev.157.232.
8. Prevost, V. H.; Girard, O. M.; Varma, G.; Alsop, D. C.; Duhamel, G. Minimizing the Effects of Magnetization Transfer Asymmetry on Inhomogeneous Magnetization Transfer (IhMT) at Ultra-High Magnetic Field (11.75 T). Magn. Reson. Mater. Phys. Biol. Med. 2016, 29 (4), 699–709. https://doi.org/10.1007/s10334-015-0523-2.
9. Bouhrara, M.; Spencer, R. G. Fisher Information and Cramér-Rao Lower Bound for Experimental Design in Parallel Imaging. Magn. Reson. Med. 2018, 79 (6), 3249–3255. https://doi.org/10.1002/mrm.26984.
Figures