1420
A personalized-NODDI (pNODDI) pipeline increases sensitivity to microstructural alterations in temporal lobe epilepsy1Department of Brain and Behavioural Sciences, University of Pavia, Pavia, Italy, 2NMR Research Unit, Queen Square Multiple Sclerosis Centre, Department of Neuroinflammation, UCL Queen Square Institute of Neurology, UCL, London, United Kingdom, 3Brain Connectivity Centre Research Unit, IRCCS Mondino Foundation, Pavia, Italy, 4Radiology, IRCCS Policlinico San Donato, San Donato Milanese, Italy
Synopsis
Several mesoscopic multi-compartment diffusion MRI models have been developed to describe the complexity of water molecules diffusion in the brain by making assumptions. One frequently used model is Neurite Orientation Dispersion and Density Imaging (NODDI). Here, the aim is to propose a personalized-NODDI (pNODDI) by making NODDI assumptions subject-specific. Our findings show that NODDI assumptions impact on output metrics depending on brain region and that these metrics are able to discriminate between healthy and temporal lobe epilepsy subjects. pNODDI provides a mean to personalize a successful and clinically feasible model as NODDI, increasing metrics sensitivity to pathological alterations.
INTRODUCTION
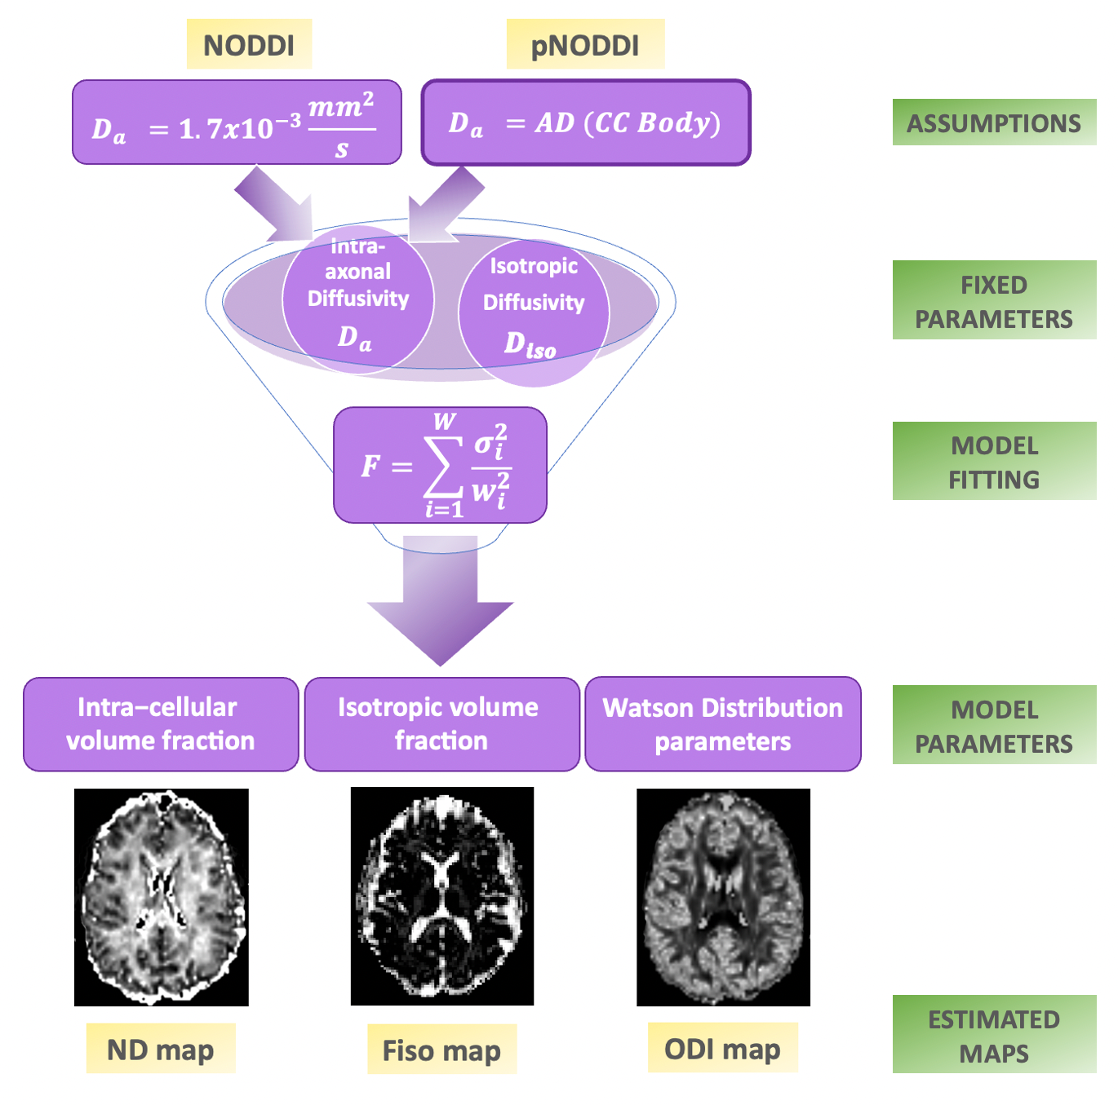
Several mesoscopic multi-compartment diffusion MRI models have been developed to describe the complexity of water molecules diffusion in brain tissue by making assumptions that could impact on the estimated results1 .Neurite Orientation Dispersion and Density Imaging (NODDI) is one of the most widely used multi-compartment models, also applied in clinical settings2. The most relevant criticisms to NODDI assumptions are that parallel intra-axonal diffusivity (Da) is fixed at 1.7x10⁻³ mm2/s, and that extra-cellular and intra-cellular compartments have the same Da. In particular, the default Da value was determined once and for all by the value of the axial diffusivity (AD) within the body of the corpus callosum (CC) in healthy controls (HC). The CC was chosen as the brain region with the most coherent axonal fibers alignment. Recently, it was demonstrated that Da varies across subjects and brain regions depending, for example, on gray matter content3.In light of these considerations we developed a personalized-NODDI (pNODDI) approach by substituting NODDI assumptions with a subject-specific pipeline. To test accuracy and sensitivity of pNODDI with respect to NODDI, Orientation Dispersion Index (ODI) and Neurite Density Index (NDI) of several brain regions were used to compare (i) differences between the standard and newly proposed approach; (ii) differences between HC and Temporal Lobe Epilepsy (TLE) patients with hippocampal sclerosis (HS); (iii) the discriminative power of the two NODDI approaches.METHODS
Subjects11 TLE subjects (6 females; 42±8y) and 10 HC (5 females; 37±10y) were considered from those recruited into a multicenter study (3TLE). Histopathology confirmed that all patients presented HS with the epileptogenic zone in the left (6 patients; 3 females; 38±9y) or in the right hemisphere (5 patients; 3 females; 46±5y). MRI data were acquired with a 3T MR Siemens Skyra scanner, including diffusion-weighted (DW) images (twice-refocused SE-EPI, TR/TE=8400/93ms, 70 axial slices, 2.24x2.24x2.2mm3 voxel size, 48 DW-directions/shell, b=1000/2000s/mm2, 13 b0 images) and a 3DT1-weighted (T1w) scan (first echo of a multi-echo FLASH, TR/TE=19/2.46 ms, flip angle 23°, 176 sagittal slices, 1x1x1mm3 voxel size).
Preprocessing
Preprocessing of DW images was done using a combination of MRtrix3 (https://www.mrtrix.org/)4 and FSL (https://fsl.fmrib.ox.ac.uk/fsl/fslwiki)5 commands to correct for Gibb’s artifacts, background noise, susceptibility-induced and eddy currents distortions. The diffusion tensor (DT) was fitted to extract each subject’s axial diffusivity (AD) voxelwise. T1w images were aligned to DW space and used to segment white matter (WM), grey matter (GM) and other anatomical regions of interest such as genu, body, and splenium of CC, thalami, and hippocampi.
NODDI analysis
NODDI metrics were calculated with the NODDI toolbox (Matlab). A pNODDI pipeline was developed by replacing the fixed Da value with a variable input equal to the subject-specific mean AD of the body of CC (Fig.1). Mean ODI and NDI from NODDI and pNODDI were evaluated in thalami, CC (genu, body, splenium), hippocampi, WM and GM.
Statistics
Statistical analysis was performed with SPSS6.ODI and NDI of all brain regions were compared between NODDI and pNODDI: (i) to assess differences in the accuracy of the two approaches, using all subjects in a repeated multivariate general linear model (GLM); (ii) to identify microstructural alterations in TLE patients compared to HC, using a GLM with age, gender and laterality of the epileptogenic zone as covariates. Discriminant analyses were performed using groups as dependent variables and considering, as independent variables: (i) NDI (or ODI) of all brain regions together; (ii) NDI (or ODI) of each specific brain region separately.
RESULTS
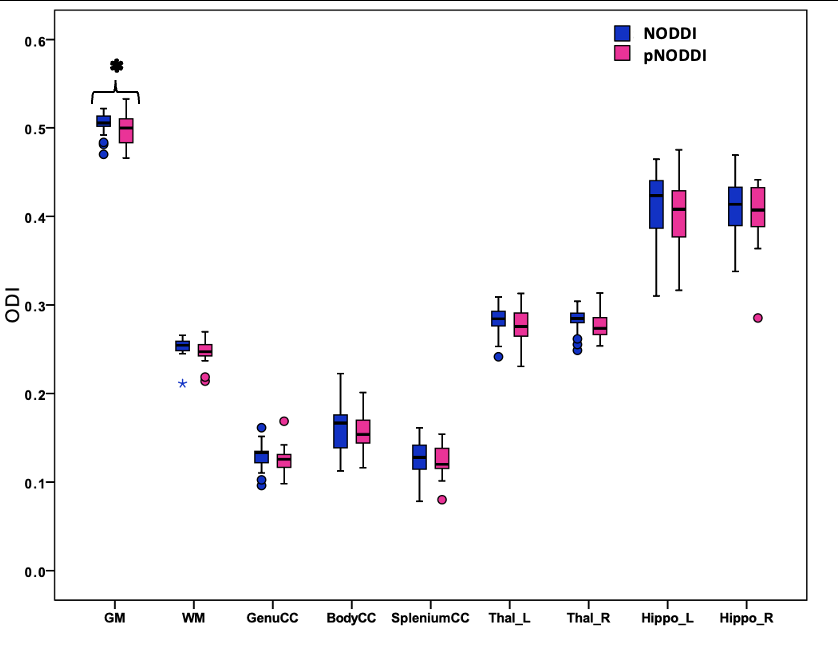
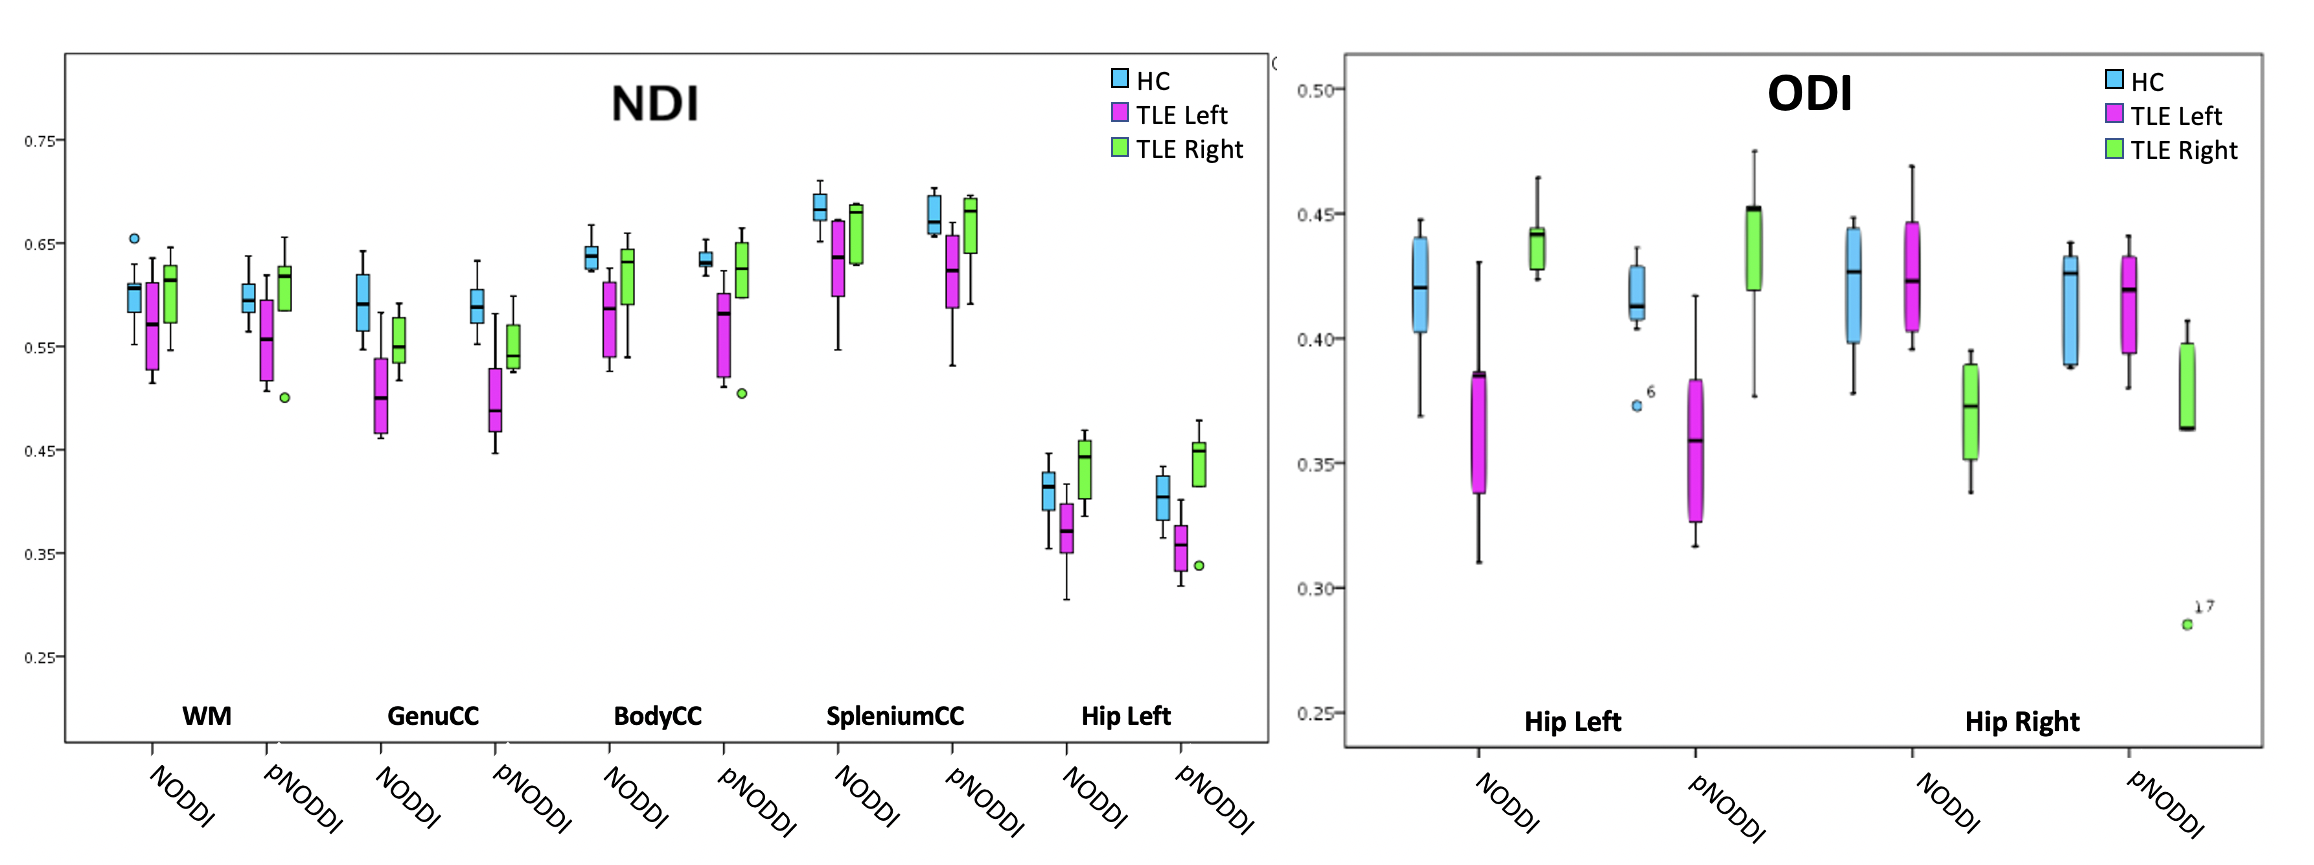
GM ODI was significantly different between the two NODDI approaches (Fig.2) while a trend (p<0.059) was observed for ODI of WM and genu CC.NODDI and pNODDI identified the same differences between HC and TLE patients: NDI was decreased in TLE in all CC parts, in WM and in left hippocampus, while ODI was decreased in TLE in left hippocampus and increased in right hippocampus (Fig.3).
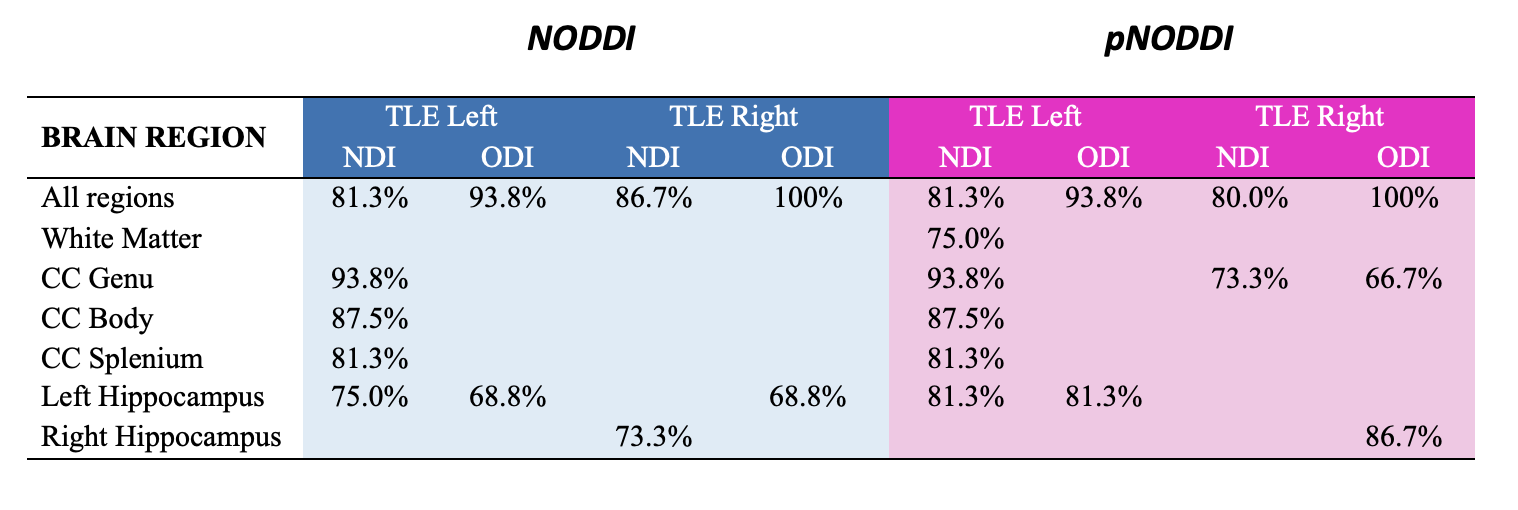
Discriminant analyses with NODDI and pNODDI metrics provided similar significant results (Fig.4) but some metrics calculated with pNODDI discriminated, alone, between HC and left HS (NDI WM, accuracy=75.0%) and between HC and right HS (NDI genu CC, accuracy=73.3%; ODI genu CC, accuracy=66.7%; ODI right hippocampus, accuracy=86.7%).
DISCUSSION and CONCLUSIONS
Here we have successfully implemented a personalized pipeline for calculating metrics of NDI and ODI using the NODDI model, i.e. pNODDI. pNODDI uses the mean AD of the body of the CC to capture pathological alterations that are subject-specific, and uses this value as input to the NODDI pipeline for Da. NODDI and pNODDI identified alterations in the same brain regions of TLE patients for all metrics other than GM ODI. While it could be argued that pNODDI approach relies on the CC representing the entire subject's pathological state, it provides a mean to personalize a successful and clinically feasible model such as NODDI, increasing the sensitivity of NDI and ODI to pathological alterations. Evidence of this different sensitivity is given by the fact that pNODDI metrics of specific brain regions were able to significantly discriminate, alone, either left or right TLE from HC. Future studies are warranted to validate these results in larger cohorts and determine whether pNODDI could be suggested to identify microstructural changes in pathological conditions.Acknowledgements
Data were collected within the 3TLE multicentric research project (Italian Ministry of Health, NET-2013-02355313). ED and FP receive funding from H2020 Research and Innovation Action Grants Human Brain Project (#785907, SGA2 and #945539, SGA3). ED receives funding from the MNL Project “Local Neuronal Microcircuits” of the Centro Fermi (Rome, Italy). CGWK receives funding from the MS Society (#77), Wings for Life (#169111), Horizon2020 (CDS-QUAMRI, #634541), BRC (#BRC704/CAP/CGW), MRC (#MR/S026088/1). CGWK is a shareholder in Queen Square Analytics Ltd.References
[1] Novikov, Dmitry S., et al. "Quantifying brain microstructure with diffusion MRI: Theory and parameter estimation." NMR in Biomedicine 32.4 (2019): e3998.
[2] Zhang, Hui, et al. "NODDI: practical in vivo neurite orientation dispersion and density imaging of the human brain." Neuroimage61.4 (2012): 1000-1016.
[3] Guerrero, Jose M., et al. "Optimizing the intrinsic parallel diffusivity in NODDI: an extensive empirical evaluation." PloS one 14.9 (2019): e0217118.
[4] J. D. Tournier et al., “MRtrix3: A fast, flexible and open software framework for medical image processing and visualisation,” NeuroImage, vol. 202. Academic Press Inc., Nov. 15, 2019, doi: 10.1016/j.neuroimage.2019.116137.
[5] M. Jenkinson, C. F. Beckmann, T. E. J. Behrens, M. W. Woolrich, and S. M. Smith, “FSL,” Neuroimage, vol. 62, pp. 782–790, 2012, doi: 10.1016/j.neuroimage.2011.09.015.
[6] IBM Corp. Released 2013, IBM SPSS Statistics for Linux, Version 22.0 Armonk, NY: IBM Corp
Figures