1419
Evaluation of SS3T-CSD for the analysis of diffusion MRI data - a simulation study1Department of Medical Engineering and Physics, School of Biomedical Engineering and Imaging Sciences, Faculty of Life Sciences and Medicine, King's College London, London, United Kingdom, 2Centre for the Developing Brain, School of Biomedical Engineering and Imaging Sciences, King's College London, London, United Kingdom, 3MRC Centre for Neurodevelopmental Disorders, King's College London, London, United Kingdom, 4Biomedical Engineering Department, School of Biomedical Engineering and Imaging Sciences, King's College London, London, United Kingdom
Synopsis
Single-shell three-tissue constrained spherical deconvolution (SS3T-CSD) has been proposed to decompose the dMRI signal into three different tissue types from single-shell data. Here, we evaluate the SS3T-CSD method over a range of different situations using real data and simulations, varying parameters including SNR, partial volume effect, b-value, number of iterations, and tissue response functions. We evaluate their effect on results by comparing with the ground truth and the results estimated from MSMT-CSD. Our results indicate that while SS3T-CSD performs well, it is sensitive to some of these factors and shows some deficiencies in certain situations.
Introduction
Diffusion MRI is widely used to report on the microstructure and orientation of tissue in vivo non-invasively[1]. Multi-shell multi-tissue constrained spherical deconvolution (MSMT-CSD) is commonly used to decompose the dMRI signal into distinct tissue compartments, along with their orientation information, based on multi-shell data[2]. More recently, single-shell three-tissue constrained spherical deconvolution (SS3T-CSD) has been proposed, aiming to deliver results similar to MSMT-CSD to decompose single-shell data into white matter (WM), gray matter (GM) and cerebrospinal fluid (CSF)[3]. Here, we evaluate SS3T-CSD using real data and simulations.Method
Data Acquisition and Processing: Data involved in this work was acquired on a Siemens 3T Prisma MRI scanner using a multi-shell acquisition scheme (b = 0, 700, 1200, 2800 s/mm² with 6, 25, 45, 75 directions respectively, TE/TR = 72.6/3560 ms, voxel size = 2mm isotropic, multiband factor 2, in-plane parallel imaging factor 2). The data pre-processing consisted of denoising[4, 5], removal of Gibbs-ringing artifacts[6], motion and distortion correction[7-10], and bias field correction[11]. Single-shell data sets were extracted from the multi-shell input data for each of the three non-zero b-values. The WM, GM, and CSF response functions were estimated using the dhollander heuristic[12].Simulation: The estimated three-tissue orientation distribution functions (ODFs) obtained using MSMT-CSD were used as the ground truth tissue densities to generate simulated DW signal by forward spherical convolution with varying SNR. Furthermore, to simulate partial volume effect (PVE), the ground truth WM ODF $$$O_{\text{WM}}$$$ was convolved with different tissue response functions and mixed in different amounts. For example, to simulate WM-CSF PVE, a fraction α of the ground truth WM ODF was convolved with the WM response, while 1 - α was convolved with the (isotropic) CSF response:$$\begin{align}S_{\mathrm{simulated}} = P\left ( \alpha O_{\mathrm{WM}} \circledast \mathrm{response}_{\mathrm{WM}} + (1-\alpha) O_{\mathrm{WM}} \circledast \mathrm{response}_{\mathrm{CSF}}\right)\tag{1}\end{align}$$ where $$$P$$$ projects from spherical harmonics to DW signal amplitudes. To simplify the three-tissue PVE simulation, a constant 30% of the WM ODF was convolved with the GM response, while the remaining 70% was simulated using equation (1). Different levels of magnitude noise were simulated via:$$\begin{align}S_{\mathrm{noisy}} = \lvert S_{\mathrm{simulated}} + \sigma (A + i B) \rvert\tag{2}\end{align}$$ where $$$A,B$$$ represent independent standard normally distributed random variables and $$$\sigma$$$ controls the SNR. Finally, to recover the three-tissue ODFs, SS3T-CSD with different numbers of iterations and MSMT-CSD were performed using response functions used in the forward simulations (‘ground truth’), or re-estimated from simulated data at that SNR. Unless otherwise stated, all experiments were performed with the default number of iterations (3).
Evaluation: To assess the resulting tissue density maps, error maps were calculated by subtracting the re-estimated ODFs from the ground truth ODFs, normalised to unit density by scaling with $$$2\sqrt{\pi}$$$. Linear regression analyses were performed to quantitatively analyse the relationships between the estimated fibre density (dependent variable) and the ground truth fibre density (independent variable).
Results and Discussion
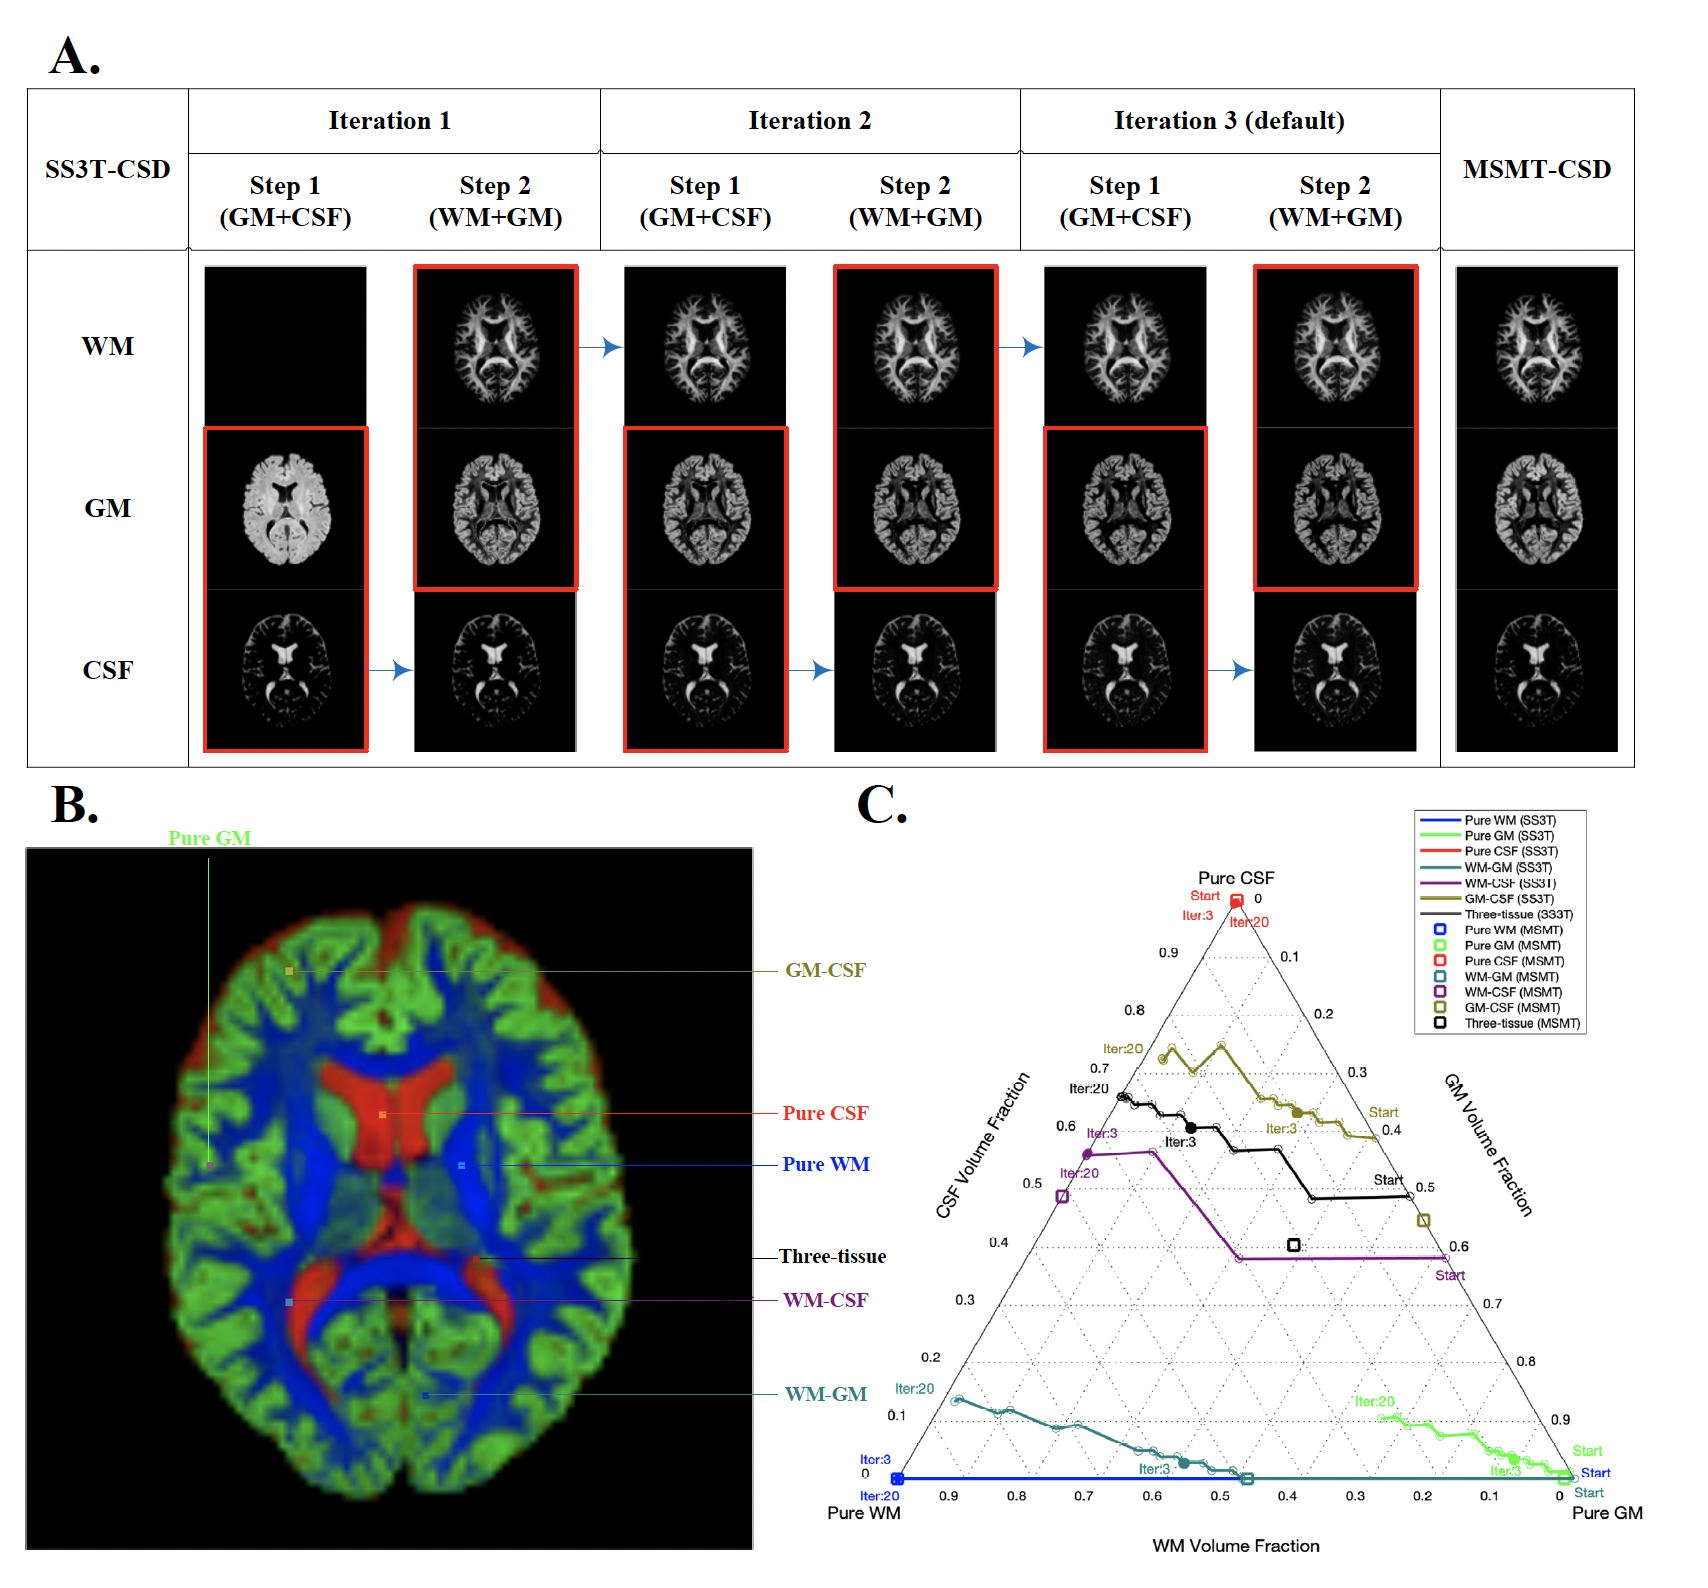
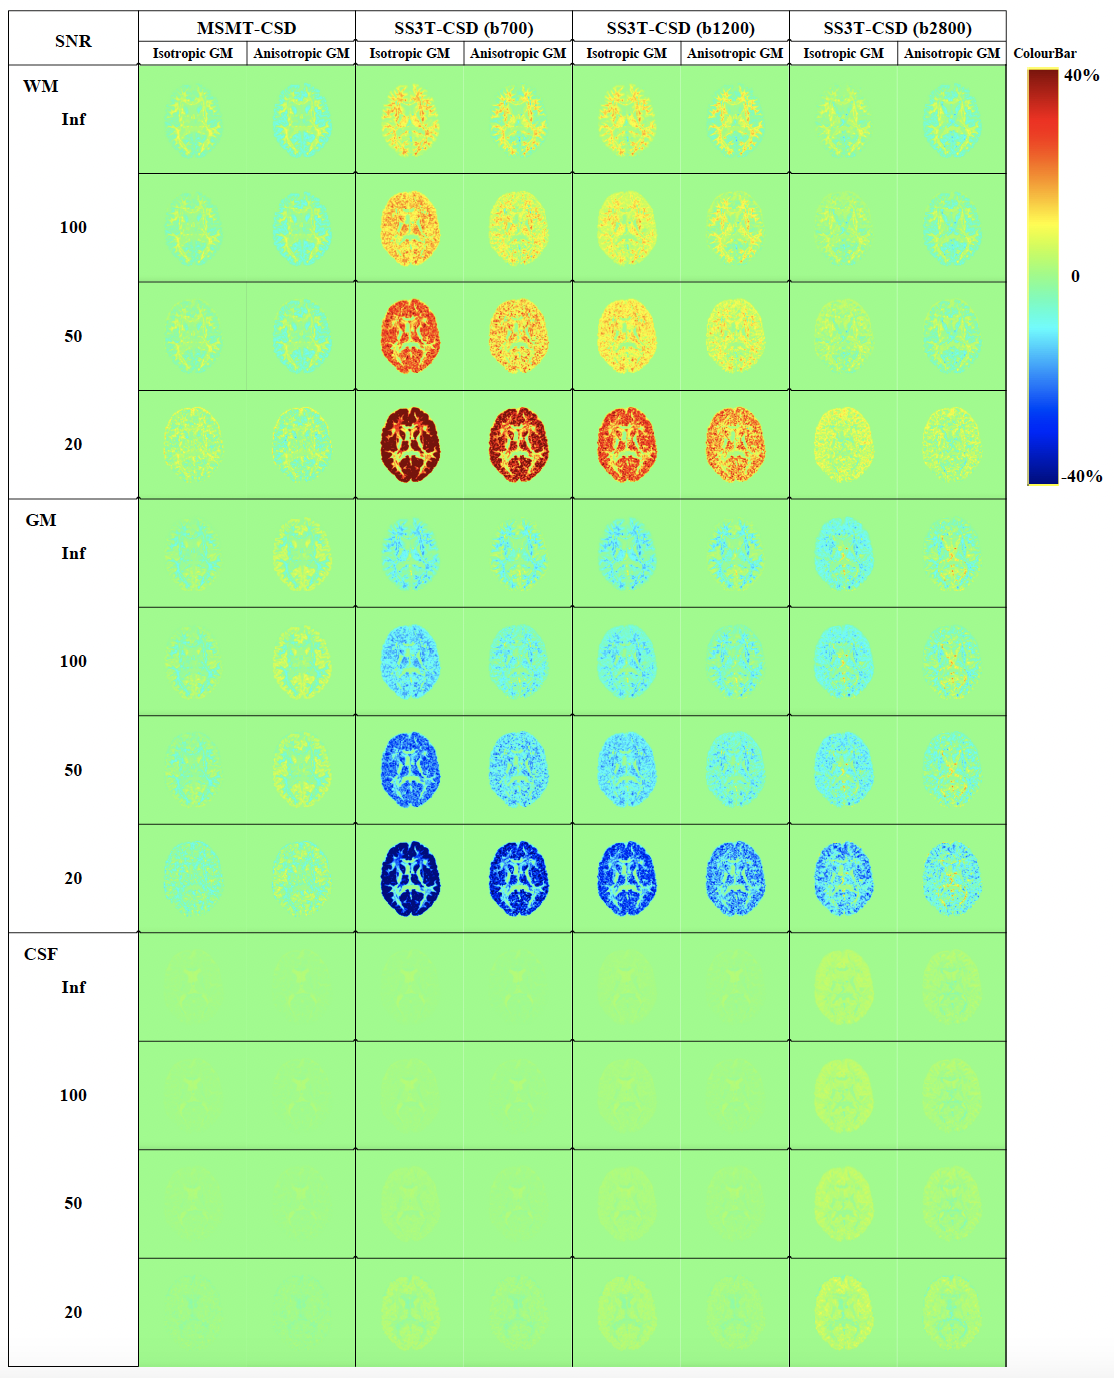
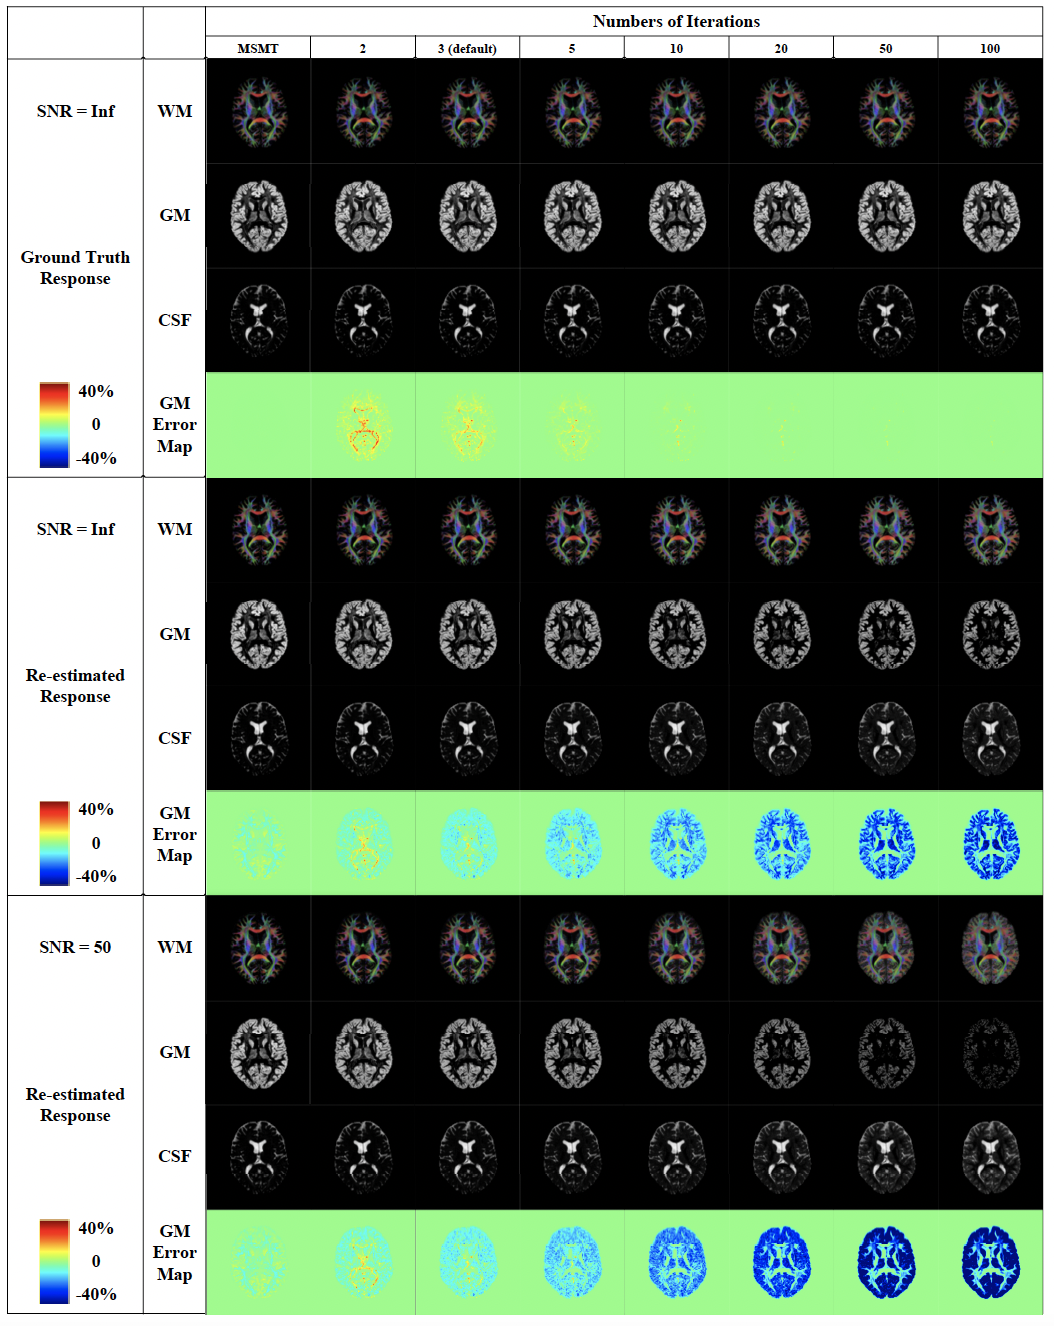
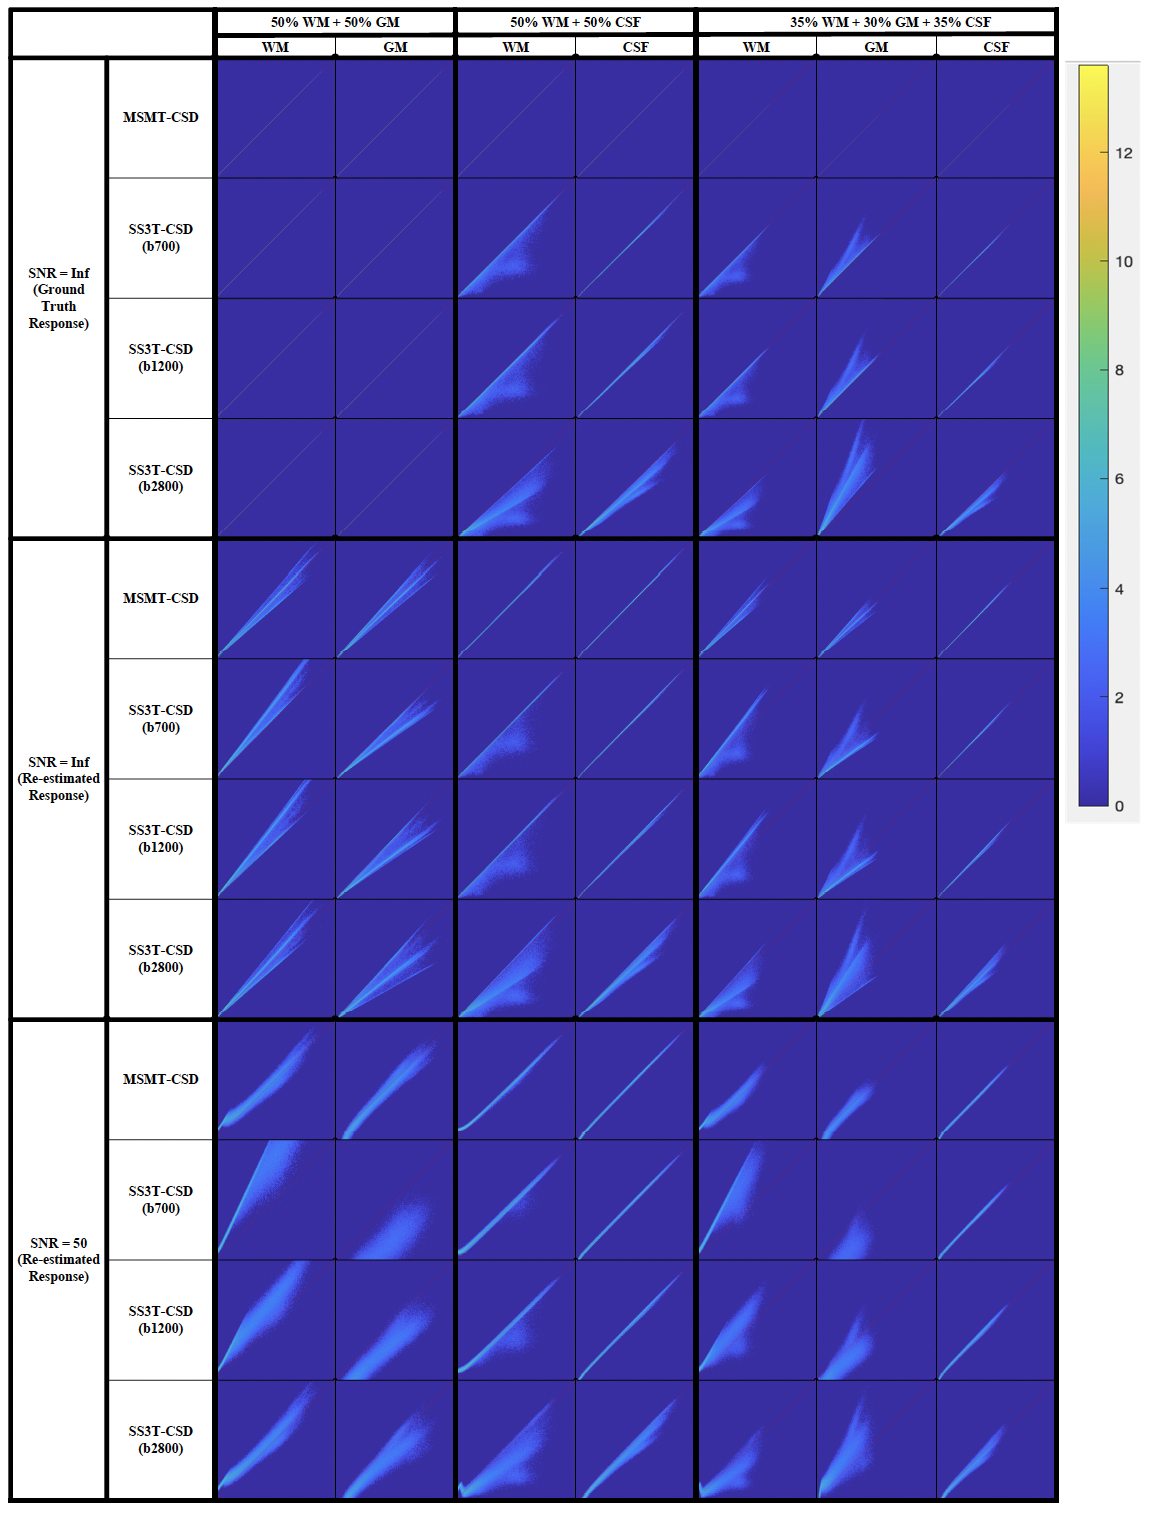
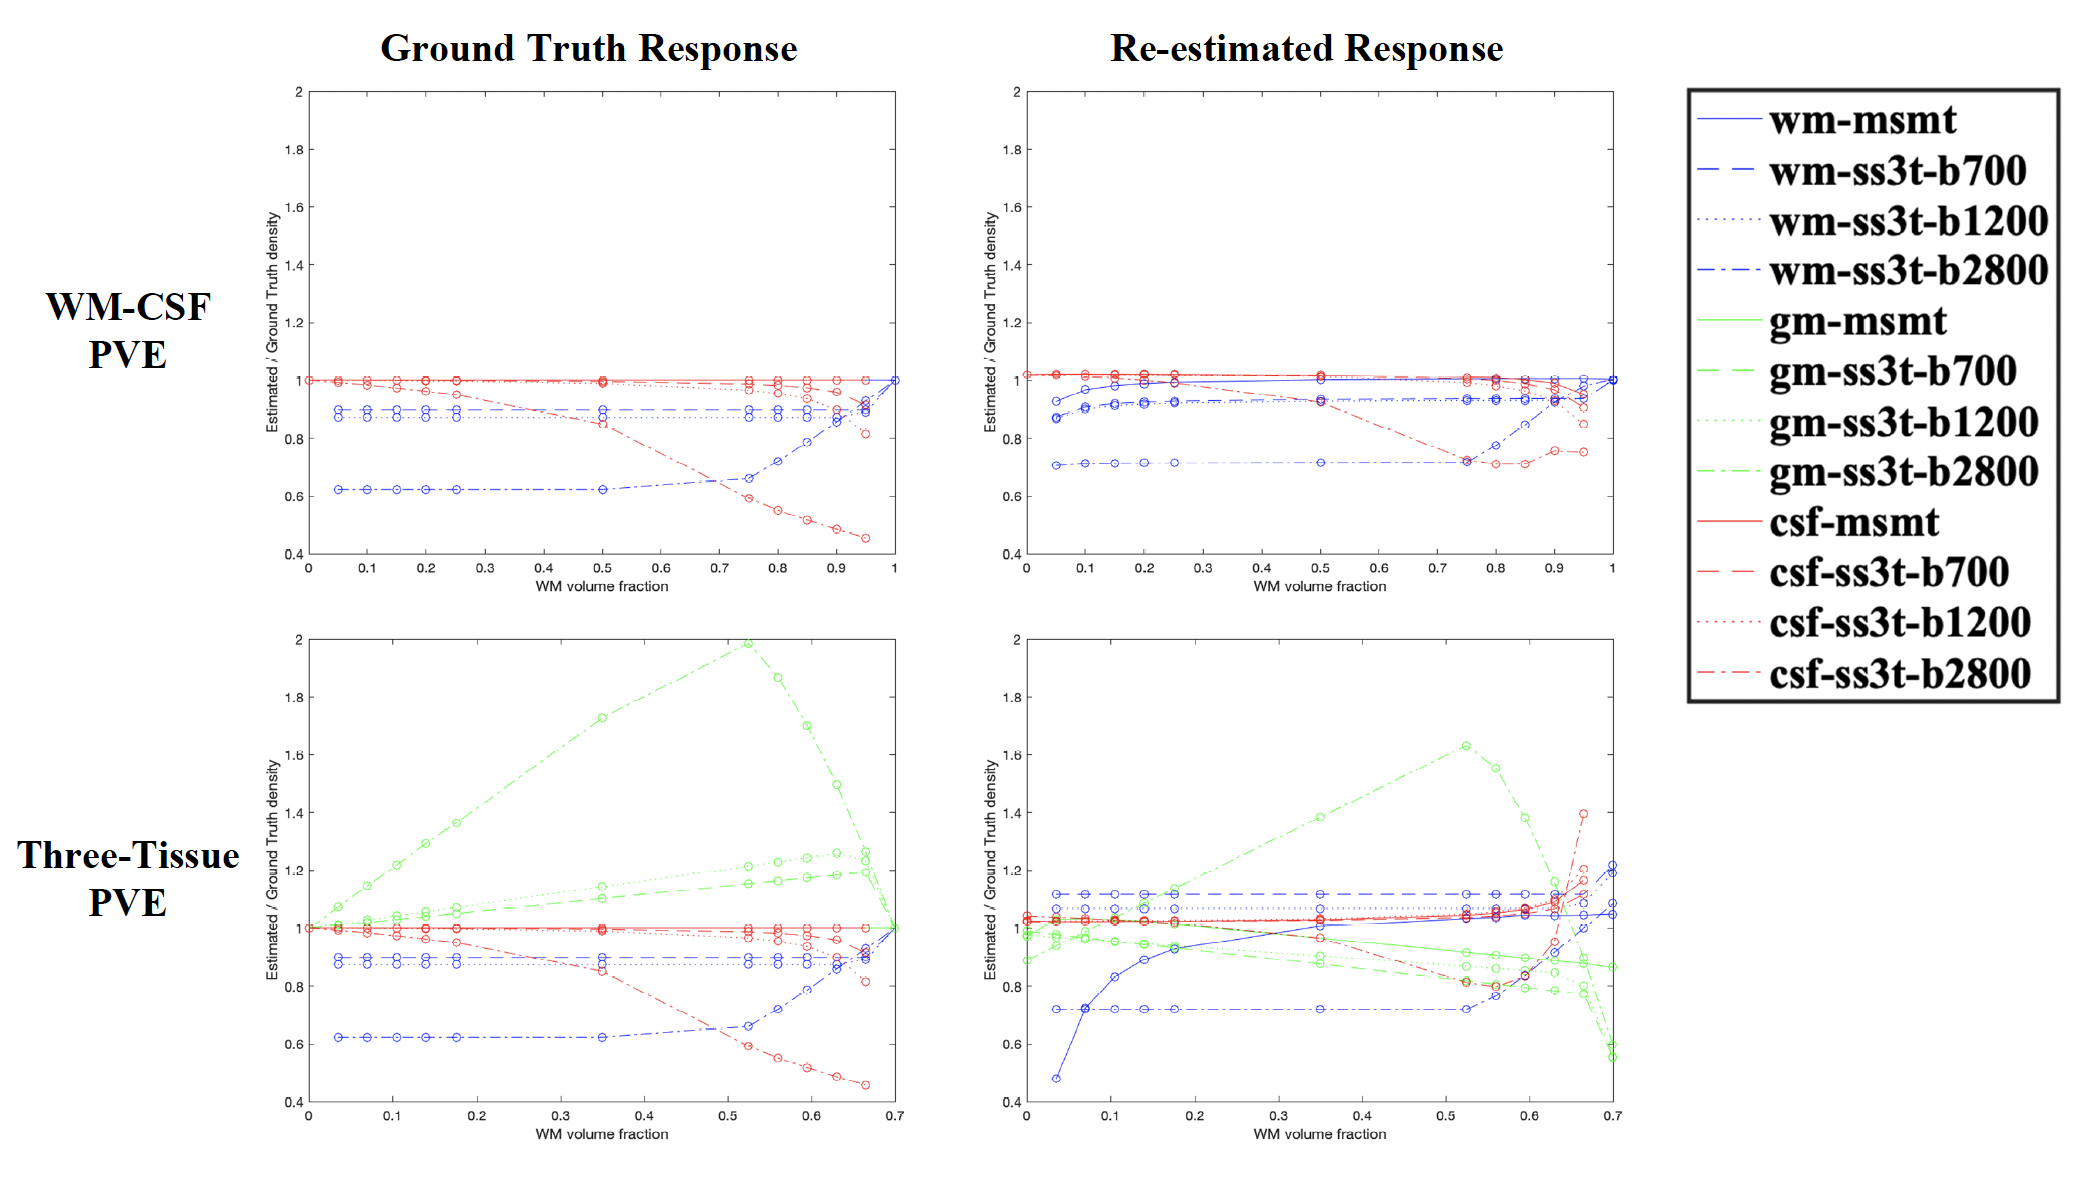
Fig. 1 presents the SS3T-CSD optimisation procedure. As shown in the ternary plot, as the algorithm iterates, the WM and CSF volume fractions are increased while the GM fraction is decreased, eventually converging to a solution with zero GM density. In the reference implementation, the default number of iterations is 3, but in some cases this does not provide the closest results to MSMT-CSD. Fig. 2 shows that the presence of noise induces an overestimation of WM fibre density and an underestimation of GM density, probably because only the (anisotropic) WM response can explain the higher-order angular harmonic components in the noise. This is also demonstrated by including an anisotropic GM response in the decomposition: the results show a suppression of the noise effect. Both noise and inaccuracies in the response functions seem to induce more rapid decay of the GM density over iterations (Fig. 3); SS3T-CSD converges to the ground truth and the MSMT-CSD results only in the case of noiseless data with perfect response functions. Fig. 4 shows that in WM-CSF and three-tissue scenarios, the WM and CSF density are underestimated (below the diagonal line) and misinterpreted as GM; this is because in single-shell data, the GM signal is indistinguishable from a linear combination of (isotropic) WM and CSF. SNR, b-value, and volume fractions all influence PVE-related errors (Fig. 4, 5). In noiseless data, higher b-values result in larger errors due to PVE (Fig. 5), we observed up to 40% underestimation of the average WM density at the highest b-value with low to moderate WM volume fractions. In noisy data, lower b-values lead to worse overestimation of WM in GM areas but better estimation of WM when mixed with CSF (Fig. 2, 4). However, the most problematic case is when WM : CSF volume fraction is about 3 : 1, particularly when GM is also present: we observe a two-fold overestimation of the GM fraction in the case simulated here (Fig 5, second row, left).Conclusion
In this work, we evaluated the SS3T-CSD method using real data and simulations with varying SNR, PVE, b-values, number of iterations, and response functions. Our results indicate that all of these factors will influence the quality of SS3T-CSD results to varying degrees. We conclude that while SS3T-CSD performs well on this data, quantification may be confounded to some extent by noise and partial volume effects.Acknowledgements
This work is supported by core funding from the Wellcome/EPSRC Centre for Medical Engineering [WT203148/Z/16/Z] and by the National Institute for Health Research (NIHR) Biomedical Research Centre based at Guy’s and St Thomas’ NHS Foundation Trust and King’s College London and/or the NIHR Clinical Research Facility. The views expressed are those of the author(s) and not necessarily those of the NHS, the NIHR or the Department of Health and Social Care.
This work is funded in part by the Bill & Melinda Gates Foundation (INV-005774).
References
1. Tournier J-D, Mori S, Leemans A. Diffusion tensor imaging and beyond. Magnetic resonance in medicine. 2011;65(6):1532.
2. Jeurissen B, Tournier J-D, Dhollander T, Connelly A, Sijbers J. Multi-tissue constrained spherical deconvolution for improved analysis of multi-shell diffusion MRI data. NeuroImage. 2014;103:411-426.
3. Dhollander T, Connelly A. A novel iterative approach to reap the benefits of multi-tissue CSD from just single-shell (+ b= 0) diffusion MRI data. Proc. Intl. Soc. Mag. Reson. Med, 2016.
4. Veraart J, Fieremans E, Novikov DS. Diffusion MRI noise mapping using random matrix theory. Magnetic resonance in medicine. 2016;76(5):1582-1593.
5. Veraart J, Novikov DS, Christiaens D, Ades-Aron B, Sijbers J, Fieremans E. Denoising of diffusion MRI using random matrix theory. Neuroimage. 2016;142:394-406.
6. Kellner E, Dhital B, Kiselev VG, Reisert M. Gibbs‐ringing artifact removal based on local subvoxel‐shifts. Magnetic resonance in medicine. 2016;76(5):1574-1581.
7. Holland D, Kuperman JM, Dale AM. Efficient correction of inhomogeneous static magnetic field-induced distortion in Echo Planar Imaging. Neuroimage. 2010;50(1):175-183.
8. Andersson JL, Skare S, Ashburner J. How to correct susceptibility distortions in spin-echo echo-planar images: application to diffusion tensor imaging. Neuroimage. 2003;20(2):870-888.
9. Smith SM, Jenkinson M, Woolrich MW, Beckmann CF, Behrens TE, Johansen-Berg H, Bannister PR, De Luca M, Drobnjak I, Flitney DE. Advances in functional and structural MR image analysis and implementation as FSL. Neuroimage. 2004;23:S208-S219.
10. Andersson JL, Sotiropoulos SN. An integrated approach to correction for off-resonance effects and subject movement in diffusion MR imaging. Neuroimage. 2016;125:1063-1078.
11. Tustison NJ, Avants BB, Cook PA, Zheng Y, Egan A, Yushkevich PA, Gee JC. N4ITK: improved N3 bias correction. IEEE transactions on medical imaging. 2010;29(6):1310-1320.
12. Dhollander T, Mito R, Raffelt D, Connelly A. Improved white matter response function estimation for 3-tissue constrained spherical deconvolution. Proc. Intl. Soc. Mag. Reson. Med, 2019.
Figures