1418
GRL-MF: The first lego-brick of a cerebellar Mean-Field Model for BOLD signal simulations1Department of Brain and Behavioural Sciences, University of Pavia, Pavia, Italy, 2NMR Research Unit, Queen Square Multiple Sclerosis Centre, Department of Neuroinflammation, UCL Queen Square Institute of Neurology, UCL, London, United Kingdom, 3Brain Connectivity Center, IRCCS Mondino Foundation, Pavia, Italy
Synopsis
Following MRI recordings, the connectome can be reconstructed and BOLD-signals simulated extracting relevant parameters on brain organization and dynamics. This requires mathematical models of neural activity in specific brain regions. However, models of the cerebellar circuit are still missing. We present here a biologically-driven mean-field (MF) model summarising the main statistical moments of cerebellar granular layer activity as the first “lego-brick” toward full cerebellar network reconstruction. Once integrated into brain simulators, like Dynamic Causal Modelling and The Virtual Brain, the cerebellar MF models will improve the investigation of neuronal functions at the origin of hemodynamic responses captured by BOLD fMRI.
Introduction
Simulating brain activity is opening new frontiers for experimental and clinical research toward personalized medicine. Brain function models are currently being developed, both at the micro and macroscale. Arguably, an increased regional fidelity can improve the accuracy of whole-brain dynamics simulations and of Blood Oxygenation Level Dependent (BOLD) signals. Current brain simulators incorporate functional connectivity with nodes usually expressing identical average neural properties irrespective of the specific brain region, either as mean-fields (MF) or neural masses1–3. Initial attempts to differentiate such models in specific cortical and subcortical regions have been proposed in the Dynamic Causal Modelling (DCM) framework4,5. Nonetheless, a specific model of the cerebellum is missing, despite the structural and functional specificity of its microcircuit. Granule Cells(GrC), Golgi Cells(GoC), Molecular Layer Interneuron(MLI) and Purkinje Cells(PC) constitute the cerebellar cortex multi-layer circuit, which receives input from mossy fibres and sends outputs towards the Deep Cerebellar Nuclei(Fig.1B). All these cells have been already characterised by electrophysiology experiments and their salient features captured by bottom-up validated single-neuron computational models6,7. The remarkable impact of the cerebellum on resting state and task-dependent fMRI, and its connectivity with cerebral cortex, prompts for cerebellar models generation to enhance whole-brain simulations8,9. Here, we report the granular layer MF model(GRL-MF), i.e. the cerebellar input stage and the first lego-brick to build up a complete cerebellar MF model, which maintains the salient properties of inter-wired GoC and GrC.The perspective is to extend the strategy to a whole-cerebellar network MF, including also MLI and PC, that will be integrated in whole-brain dynamics macroscale models, e.g. DCM or The Virtual Brain(TVB)10, to study the cerebellar contribution in normal and pathological conditions.Methods
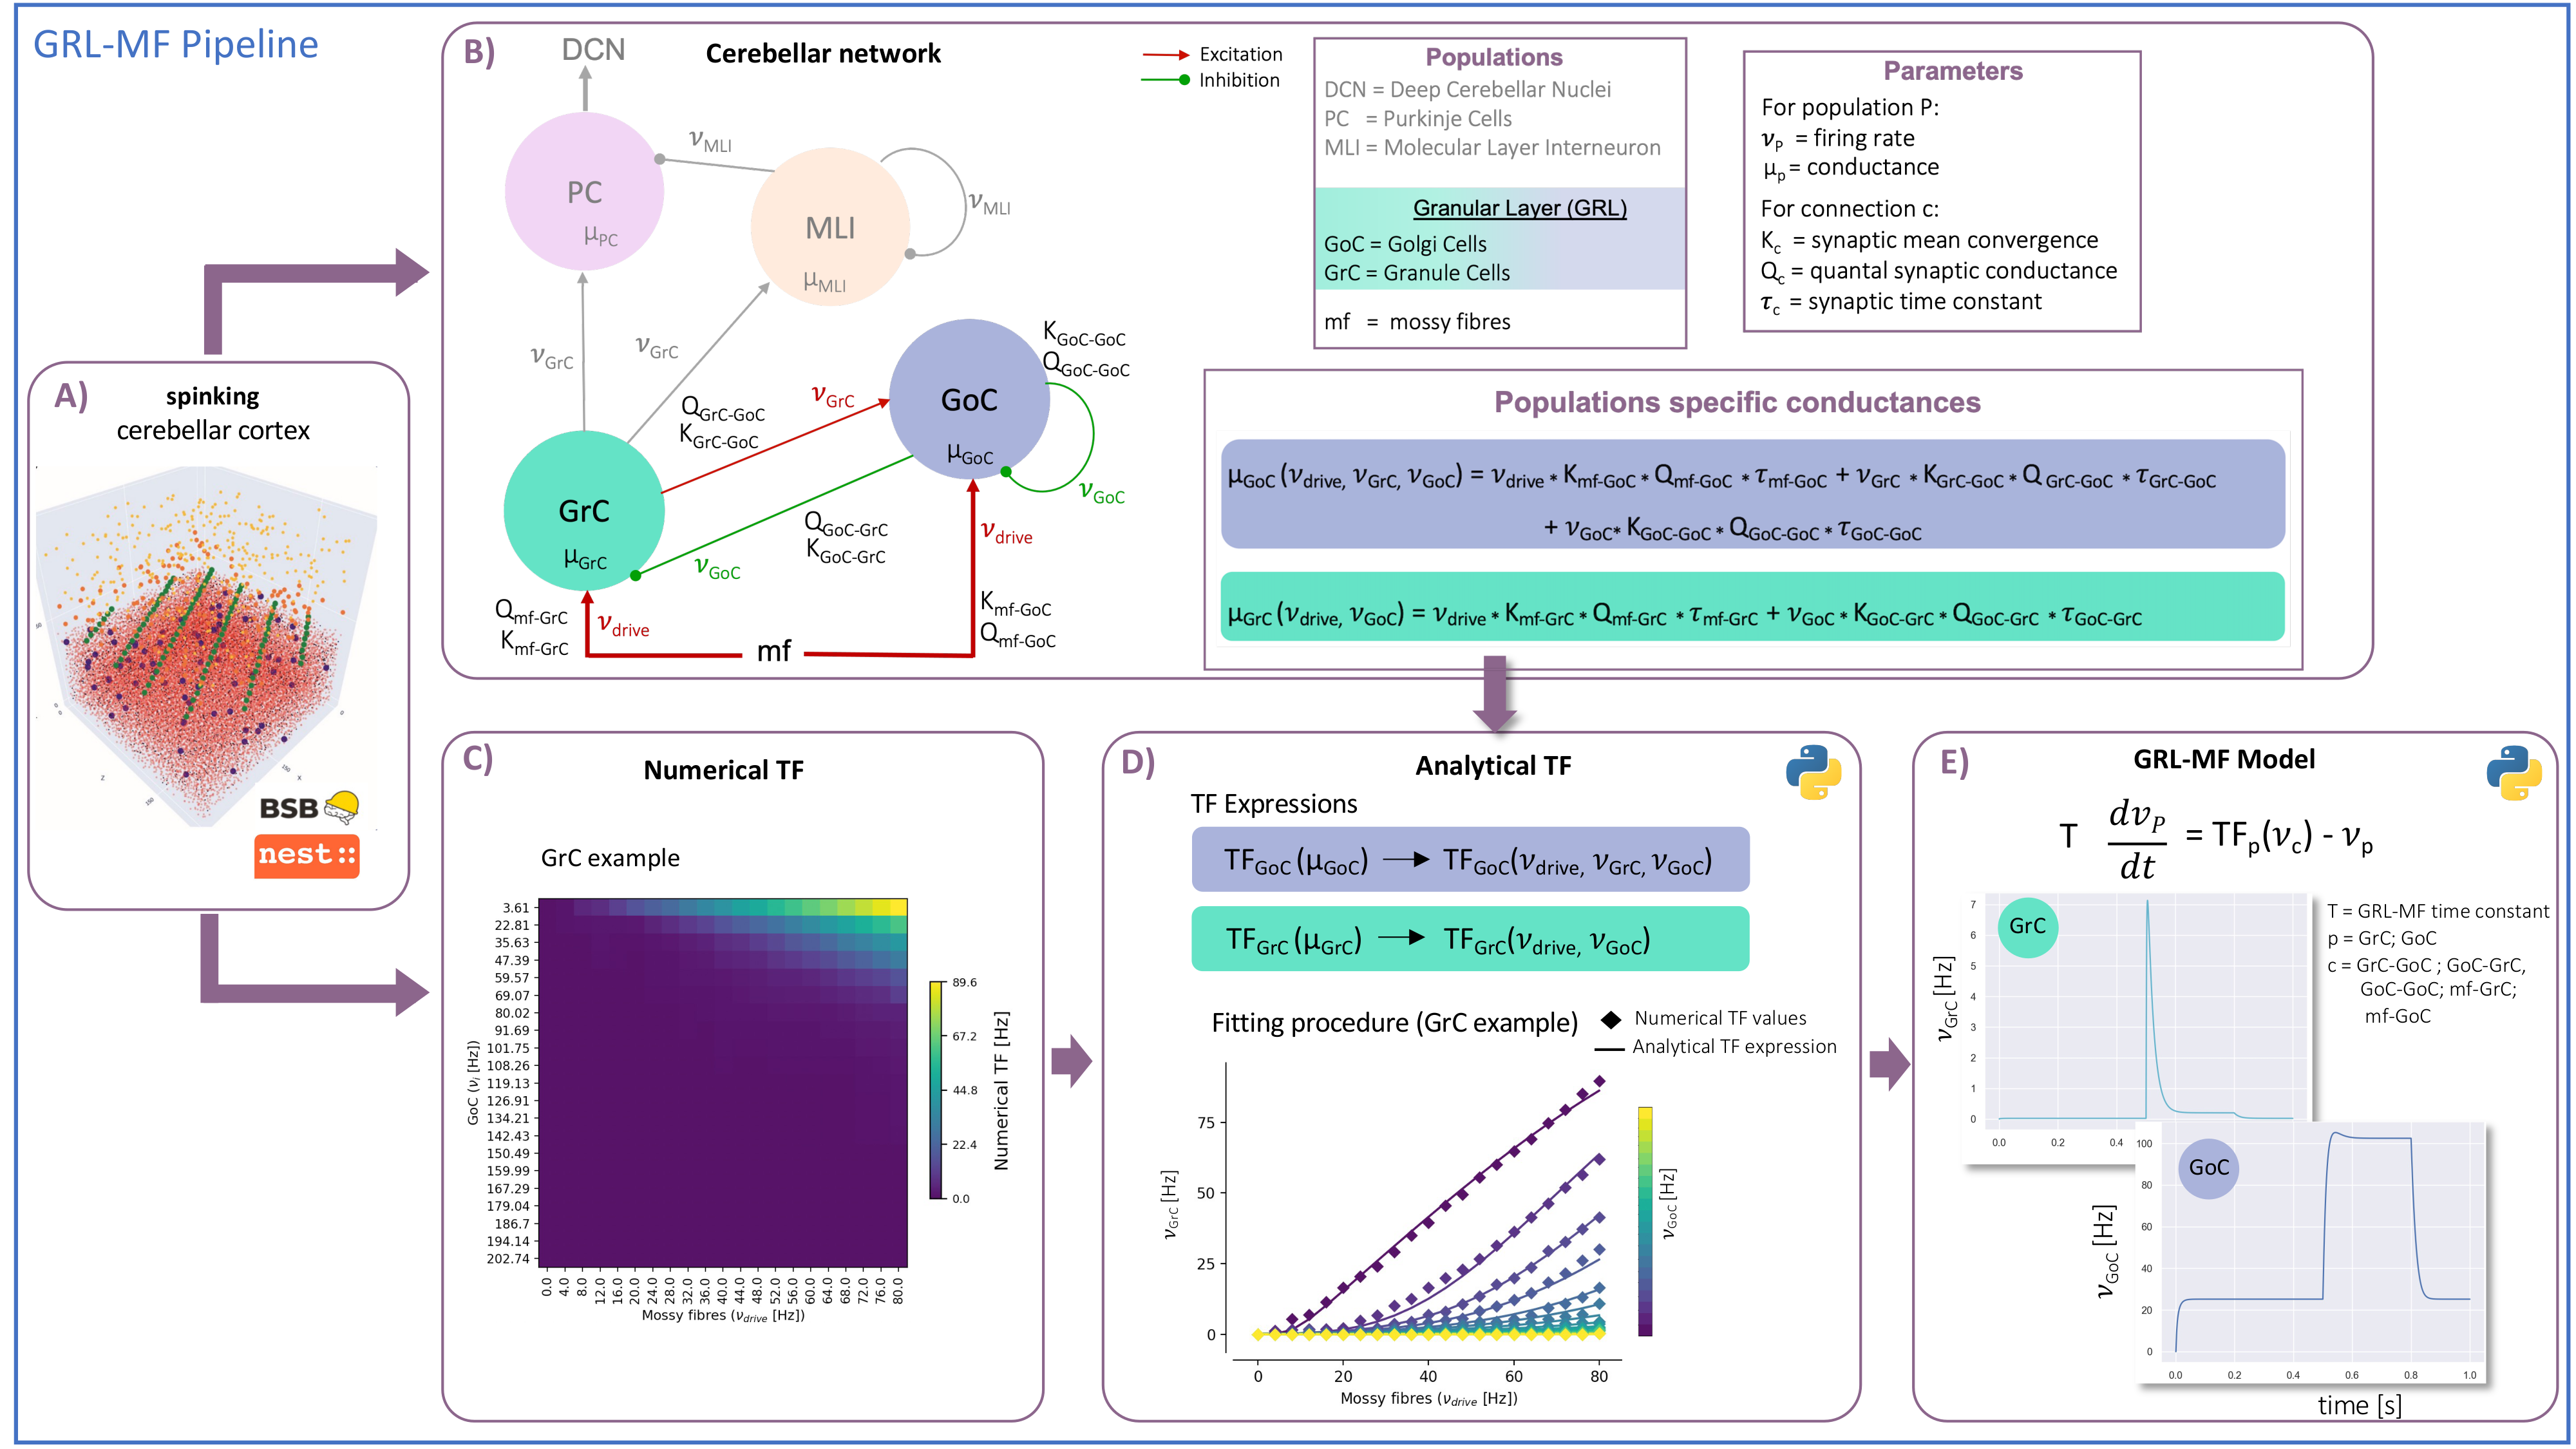
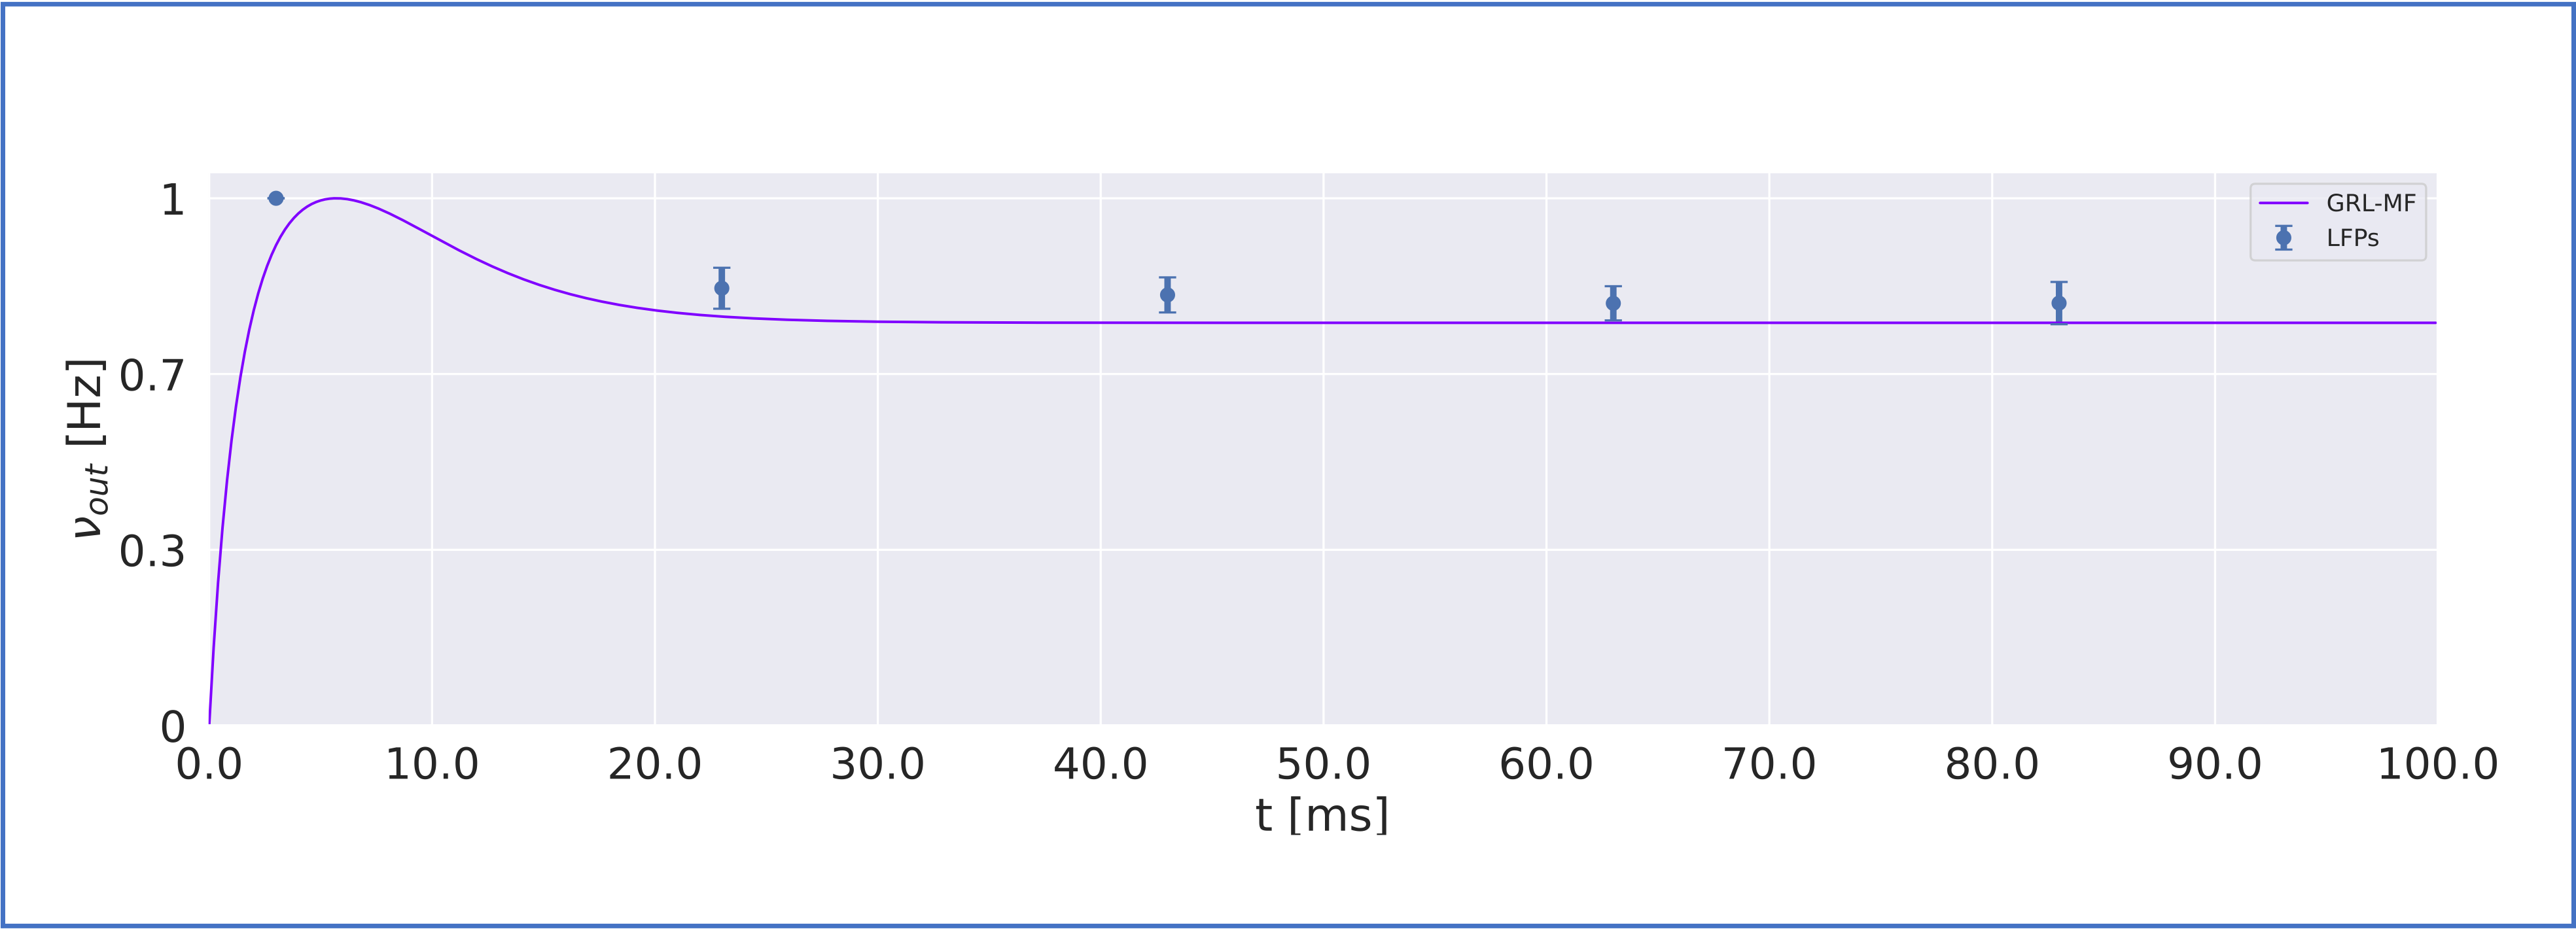
MF models made of excitatory and inhibitory neurons have initially been developed for isocortical microcircuits11. These models use a Transfer Function (TF) formalism that takes neuron conductances as input providing an average population activity signal as output (in practice this procedure yields a numerical table containing the firing-frequency of the neuronal population, called numerical TF, which is then used to obtain the analytical TF by fitting-Fig.1A). The MF model summarizes the first two statistical moments of a neural population activity (mean and variance), which are computed as a function of the average population conductances. These, in turn, depend on biological parameters estimated experimentally allowing us to transfer physiological properties into the MF mathematical construct.The GRL-MF developed here (Fig.1) relies on the TF formalism, introducing GrC and GoC biological parameters and the topological properties of cerebellar microcircuits that were formalized and reported quantitatively in validated spiking neuron models6,7,12,13. Connection probabilities, synaptic decay times and quantal conductances (K,Q,τ) were used to extract population-specific (GrC and GoC) conductances from the relevant equations(Fig.1B). These conductances were used to define the statistical moments of the analytical TFs that were computed by fitting the numerical TFs (Fig.1C-1D). Given the different synaptic connections of GrC and GoC, the shape of their respective TF was either 2D for GrC (excitation from mossy fibres, inhibition from GoC) or 3D for GoC (excitation from GrC and mossy, and self-inhibition).The GRL-MF equations were written capturing the interdependence of the specific population TFs (Fig.1E). The model prediction of GRL activity was tested for different inputs from mossy fibres (𝜈drive). The MF time-constant (T) was optimized according to Local Field Potential (LFP) measurements obtained with high-density microelectrode arrays in cerebellar slices14.Results and Discussion
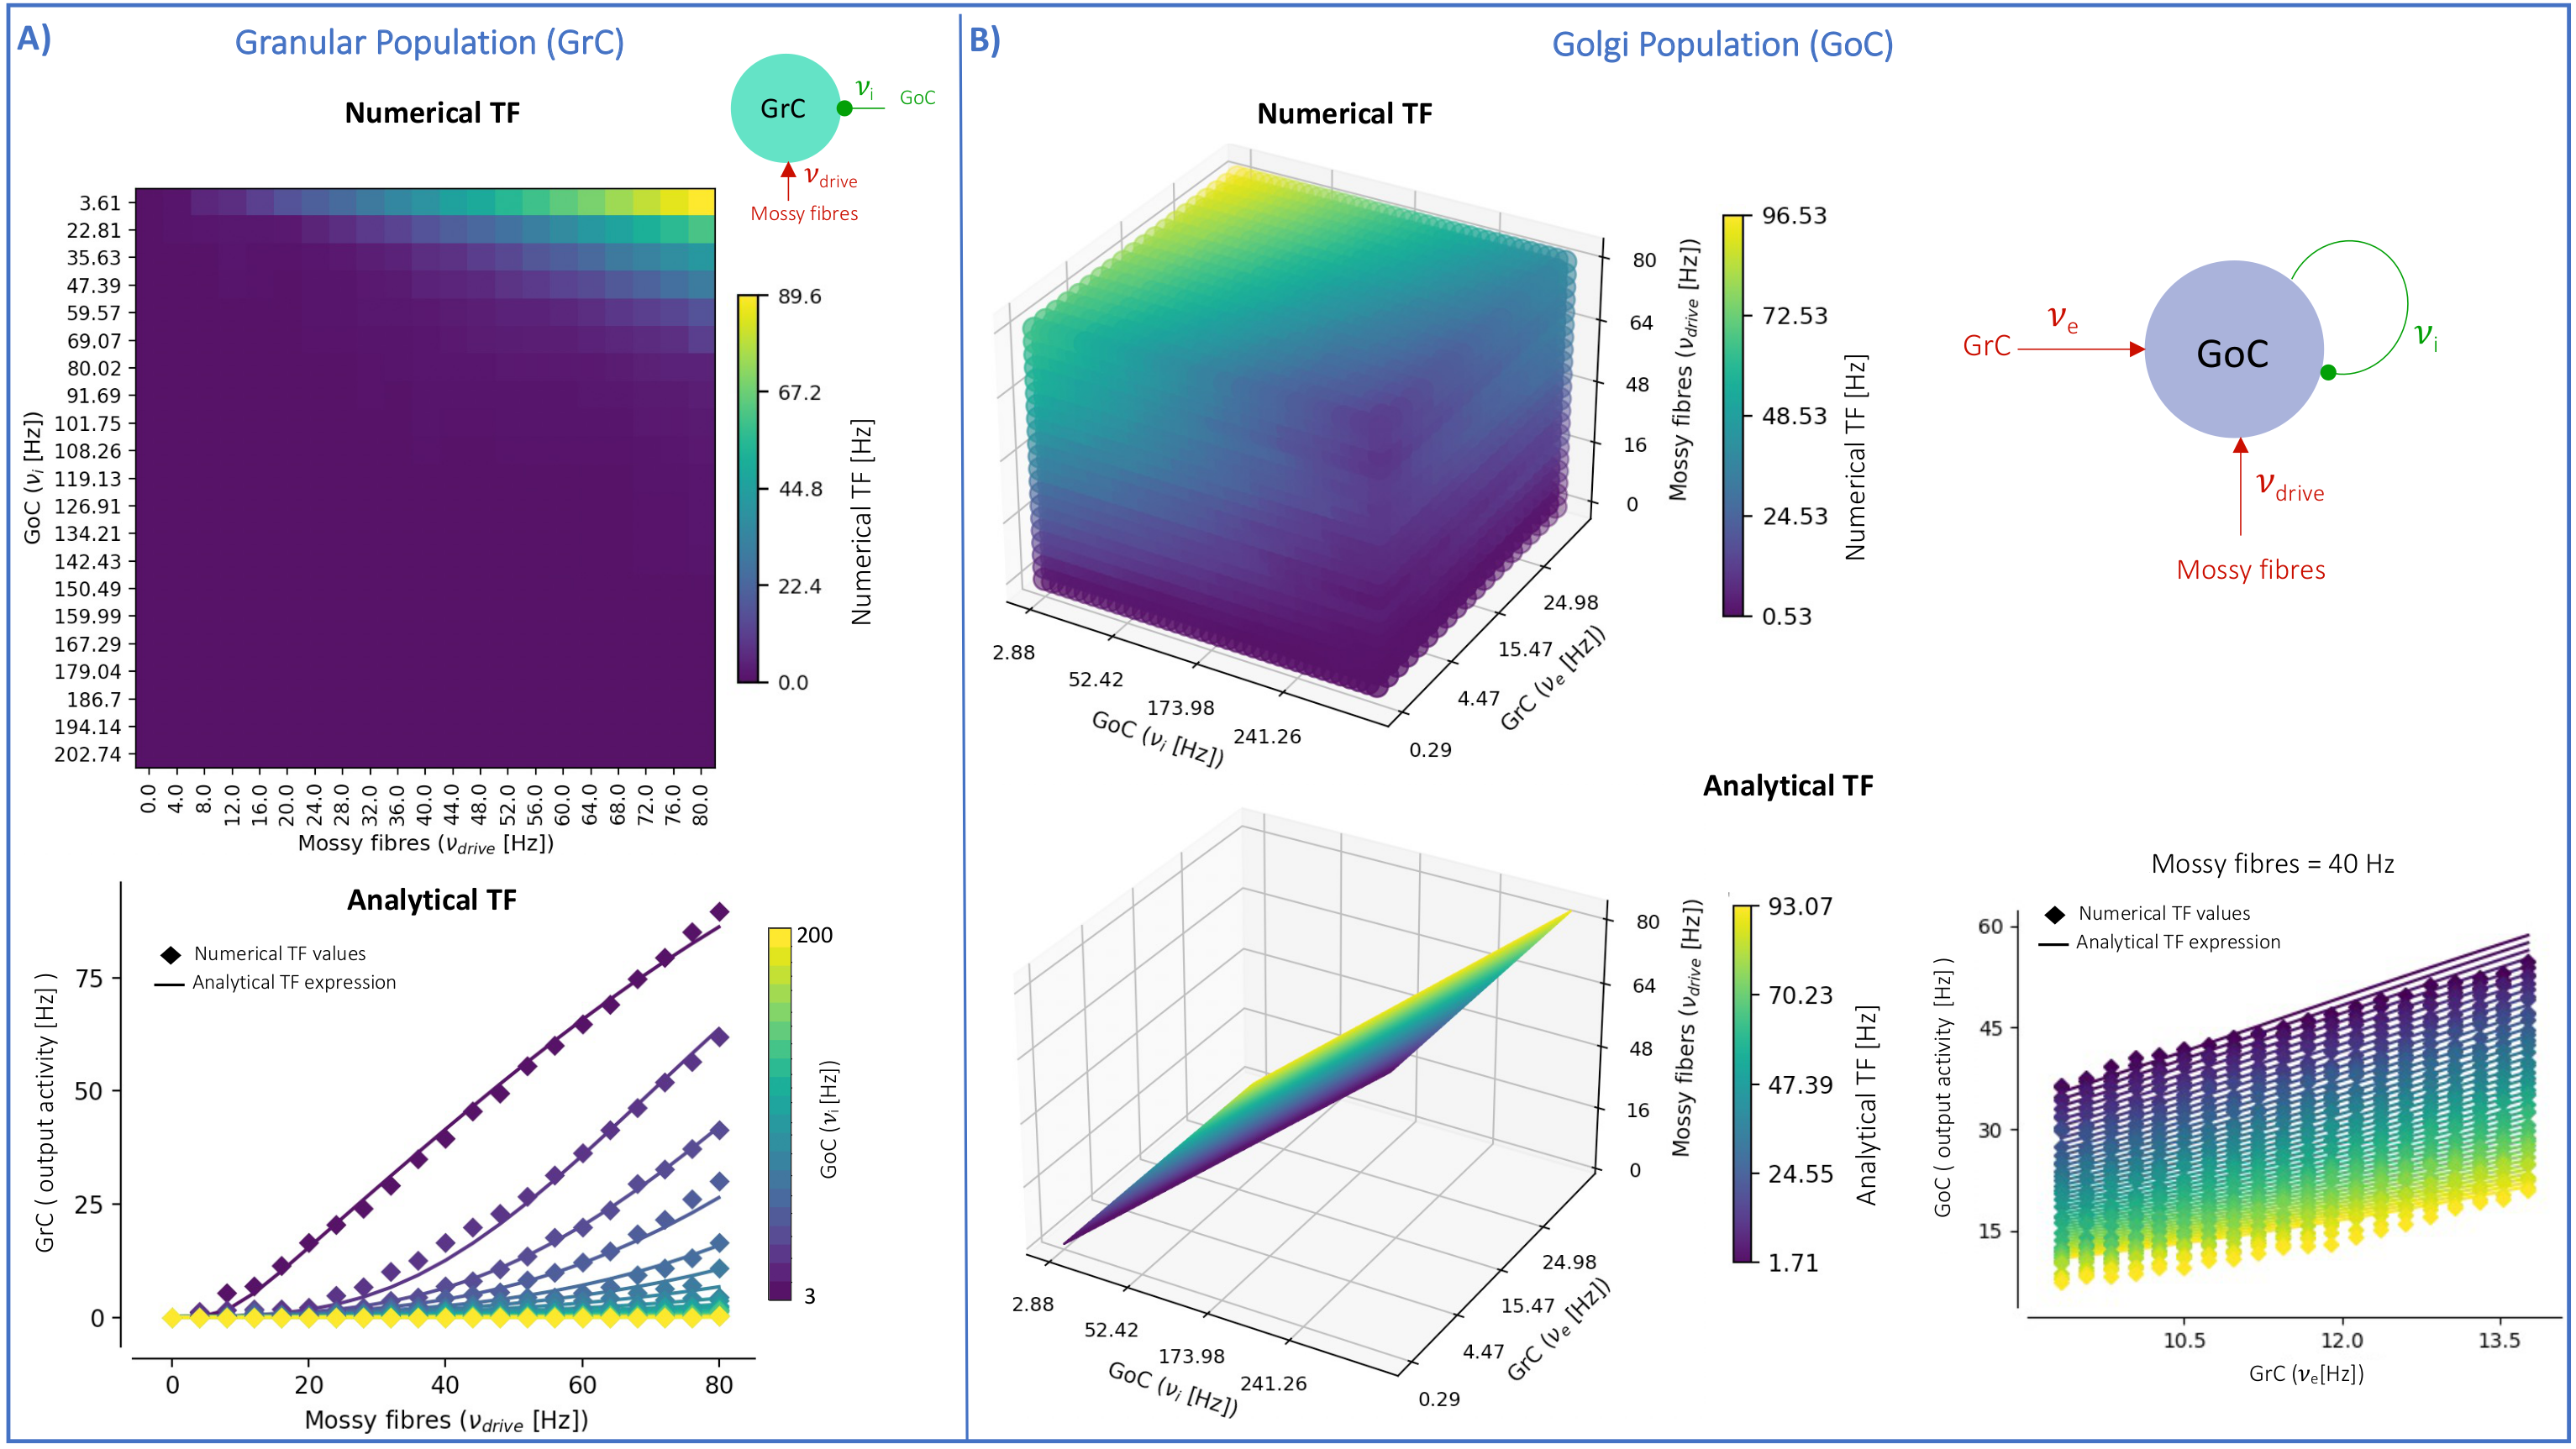
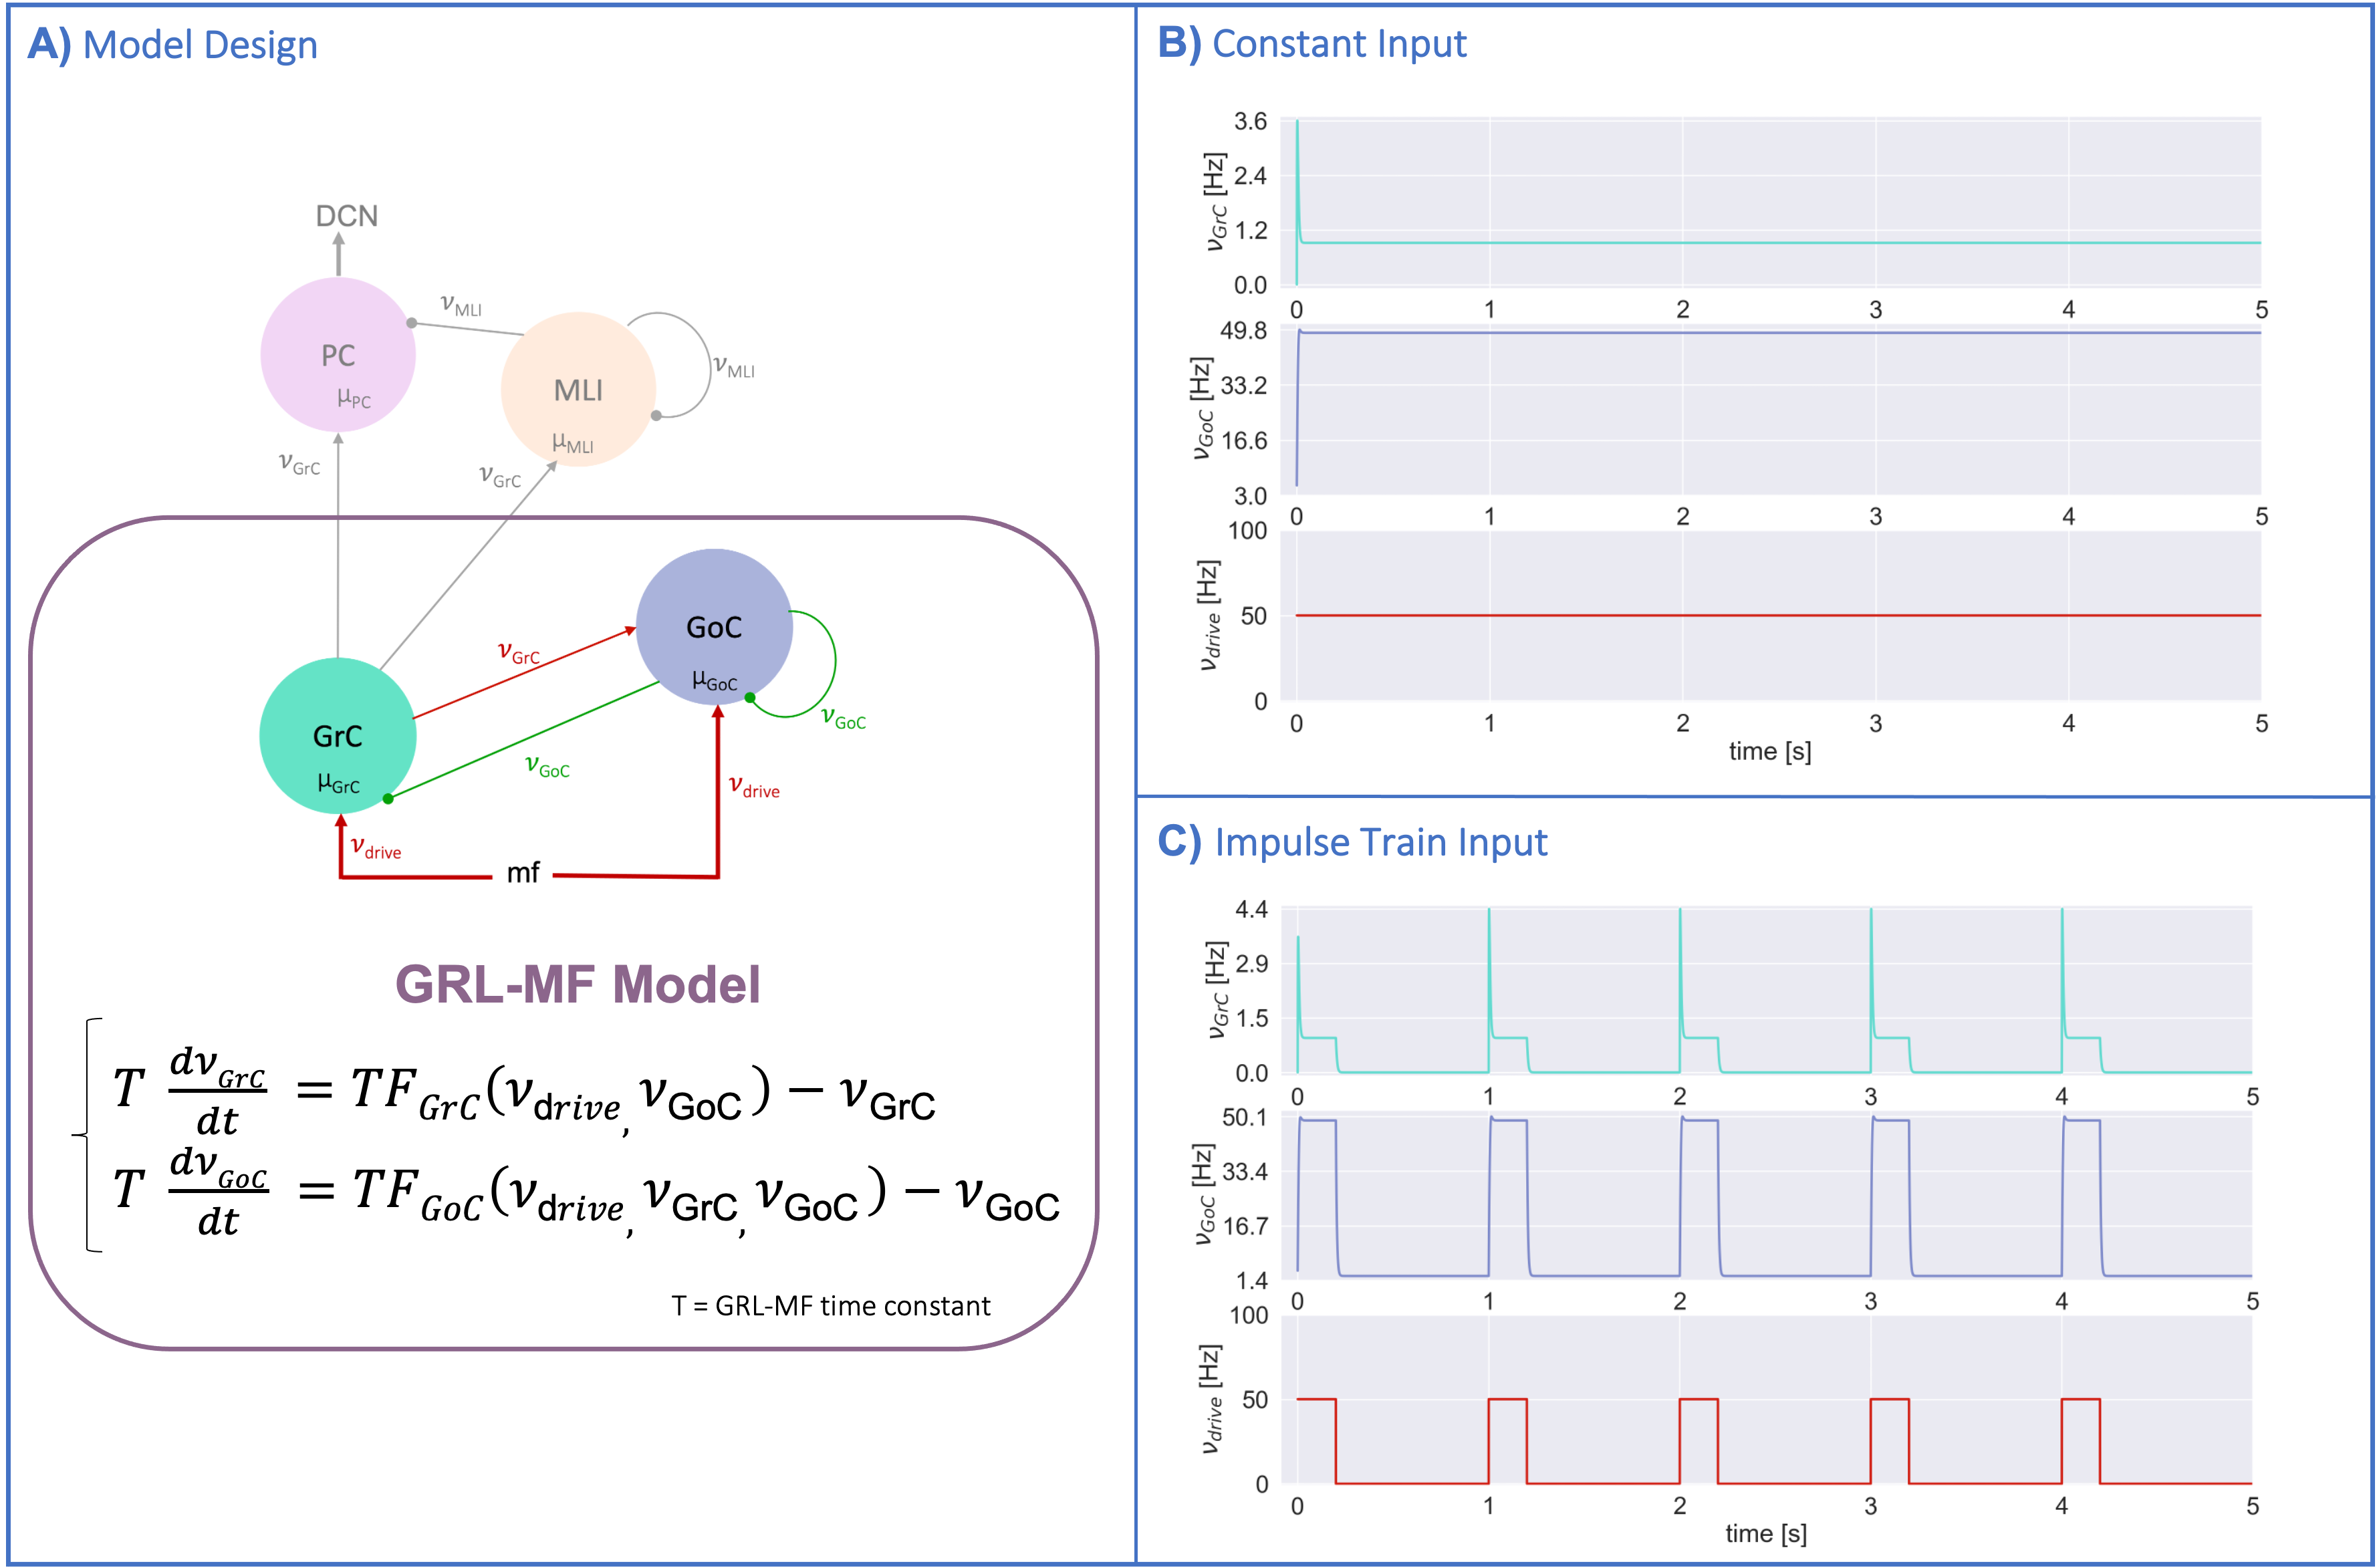
The MF model elaborated here is based on the GRL biological properties. The numerical TFs and the analytical TFs fitting for GrCs and GoCs are reported in Fig.2. The GrC analytical TF trend (Fig.2A) follows the numerical simulations output, reproducing the GoC inhibition high-impact on the GrC activity15. GoC 3D numerical TF (Fig.2B) considers the effect of mossy fibres driving input, GrC excitation and self-inhibition, enabling to investigate the impact of each of these inputs on GoC activity. It is worth noting that the GoC analytical TF was fitted considering only physiological input combinations computed from single-neuron computational models6,7. By fixing the excitatory mossy fibres driving input, we assessed the analytical TF power in reproducing spiking network simulated activity (Fig.2B:mossy=40Hz). For the first time we achieved TFs that are specific to GrC and GoC neuronal populations and GRL-MF equations with these interdependent TFs (Fig.3A). The model predictions, representing the GRL average activity, are reported for different stimuli patterns(Fig.3B-3C). GRL-MF outputs were compared to LFPs signal to approximate the time-constant T (Fig.4). A value of T=5 ms provided an adequate prediction with an error of 5% compared to LFPs data.The next lego-brick for a complete cerebellar MF model is the molecular layer. Once completed, the cerebellar MF model will be inserted into whole-brain simulators. As far as this MF model is a proxy of the biological network, it can be used to investigate the impact of the specific cerebellar neuronal mechanisms and network organization on brain dynamics. This approach represents a definite step ahead compared to the classical one that adopts the same neural mass models for the whole-brain, including the cerebellum10,16,17,18, and will contribute to understanding the origin of macroscopic hemodynamic changes captured by BOLD fMRI in health and disease.Acknowledgements
We thank Robin De Schepper for useful discussions about the Brain Scaffold Builder framework ( https://github.com/dbbs-lab/bsb). ED and FP receive funding from H2020 Research and Innovation Action Grants Human Brain Project (#785907, SGA2 and #945539, SGA3). ED receives funding from the MNL Project “Local Neuronal Microcircuits” of the Centro Fermi (Rome, Italy). CGWK receives funding from the MS Society (#77), Wings for Life (#169111), Horizon2020 (CDS-QUAMRI, #634541), BRC (#BRC704/CAP/CGW), UCL Global Challenges Research Fund (GCRF), MRC (#MR/S026088/1). CGWK is a shareholder in Queen Square Analytics Ltd.References
1. Van Wijk BCM, Cagnan H, Litvak V, et al. Generic dynamic causal modelling: An illustrative application to Parkinson’s disease. Neuroimage 2018;181(January):818–830.Available from: https://doi.org/10.1016/j.neuroimage.2018.08.039
2. Pinotsis D, Robinson P, Graben PB, Friston K. Neural masses and fields: Modeling the dynamics of brain activity. Front. Comput. Neurosci. 2014;8(NOV):2013–2015.
3. Ritter P, Schirner M, Mcintosh AR, Jirsa VK. The Virtual Brain Integrates Computational Modeling and Multimodal Neuroimaging. Brain Connect. 2013;3(2):121–145
4. Friston KJ, Harrison L, Penny W. Dynamic causal modelling. Neuroimage 2003;19(4):1273–1302.Available from: https://linkinghub.elsevier.com/retrieve/pii/S1053811903002027
5. Friston KJ, Preller KH, Mathys C, et al. Dynamic causal modelling revisited. Neuroimage 2019;199(February 2017):730–744.Available from: https://doi.org/10.1016/j.neuroimage.2017.02.045
6. Geminiani A, Casellato C, Locatelli F, et al. Complex dynamics in simplified neuronal models: Reproducing golgi cell electroresponsiveness. Front. Neuroinform. 2018;12(December):1–19
7. Geminiani A, Casellato C, D’Angelo E, Pedrocchi A. Complex Electroresponsive Dynamics in Olivocerebellar Neurons Represented With Extended-Generalized Leaky Integrate and Fire Models. Front. Comput. Neurosci. 2019;13(June):1–12.Available from: https://www.frontiersin.org/article/10.3389/fncom.2019.00035/full
8. Casiraghi L, Alahmadi AAS, Monteverdi A, et al. I See Your Effort: Force-Related BOLD Effects in an Extended Action Execution–Observation Network Involving the Cerebellum. Cereb. Cortex 2019;29(3):1351–1368
9. Castellazzi G, Palesi F, Casali S, et al. A comprehensive assessment of resting state networks: Bidirectional modification of functional integrity in cerebro-cerebellar networks in dementia. Front. Neurosci. 2014;8(8 JUL):1–18
10. Sanz-Leon P, Knock SA, Woodman MM, et al. The virtual brain: A simulator of primate brain network dynamics. Front. Neuroinform. 2013;7(MAY)
11. Zerlaut Y, Chemla S, Chavane F, Destexhe A. Modeling mesoscopic cortical dynamics using a mean-field model of conductance-based networks of adaptive exponential integrate-and-fire neurons. J. Comput. Neurosci. 2018;44(1):45–61
12. Casali S, Marenzi E, Medini C, et al. Reconstruction and simulation of a scaffold model of the cerebellar network. Front. Neuroinform. 2019;13(May):1–19
13. Schepper R De, Geminiani A, Masoli S, et al. Scaffold modelling captures the structure-function-dynamics relationship in brain microcircuits [Internet]. bioRxiv 2021;2021.07.30.454314.Available from: https://www.biorxiv.org/content/10.1101/2021.07.30.454314v1
14. Gagliano G, Monteverdi A, Casali S, et al. Non-linear frequency-dependence of neurovascular coupling in the cerebellar cortex implies vasodilation-vasoconstriction competition. bioRxiv 2021;2021.07.30.454430.Available from: https://www.biorxiv.org/content/10.1101/2021.07.30.454430v1
15. Maffei A, Prestori F, Rossi P, et al. Presynaptic current changes at the mossy fiber-granule cell synapse of cerebellum during LTP. J. Neurophysiol. 2002;88(2):627–638
16. Palesi F, Lorenzi RM, Casellato C, et al. The Importance of Cerebellar Connectivity on Simulated Brain Dynamics. Front. Cell. Neurosci. 2020;14(July):1–11
17. Sanz-Leon P, Knock SA, Spiegler A, Jirsa VK. Mathematical framework for large-scale brain network modeling in The Virtual Brain. Neuroimage 2015;111:385–430.Available from: http://dx.doi.org/10.1016/j.neuroimage.2015.01.002
18. Lorenzi RM, Casiraghi L, Alahmadi A, et al. Cerebellum integration in motor network improves Dynamic Causal Modeling performance. ISMRM Congress 2021.
Figures