1417
Improved Modelling of ADC Distributions makes Therapeutic co-clinical Trials possible with very small animal numbers1Cancer, University of Manchester, Manchester, United Kingdom, 2University of Manchester, Manchester, United Kingdom
Synopsis
In oncology, preclinical experiments using MRI often evaluate spatially complex and heterogeneous tumor micro-environments which have non-Gaussian data and small sample sizes, with cohorts typically of 10 animals or less. As a consequence, conventional use of t-tests that evaluate distribution parameters such as means and percentiles can be ineffective. Further, the cohort-level nature of such analyses also limits investigations to groups of tumors rather than identifying individually responding tumors. In contrast, Linear Poisson Modelling (LPM) enables quantitative analysis of complex data, can operate in small data domains and can also provide per-tumor assessments 2.ideal for co-clinical trials.
Introduction
Biomarkers derived from medical imaging are used in drug development to identify and quantify therapeutic response. In oncology, preclinical experiments using MRI often evaluate spatially complex and heterogeneous tumor micro-environments which have non-Gaussian data and small sample sizes, with cohorts typically of 10 animals or less. As a consequence, conventional use of t-tests that evaluate distribution parameters such as means and percentiles can be ineffective. Further, the cohort-level nature of such analyses also limits investigations to groups of tumors rather than identifying individually responding tumors [1]. In contrast, Linear Poisson Modelling (LPM) enables quantitative analysis of complex data, can operate in small data domains and can also provide per-tumor assessments [2].Using diffusion-weighted imaging (DWI), we sought to evaluate the ability of LPM to identify responding tumor habitats across a range of xenograft tumor models and a range of radiation and targeted therapies. We investigated if this method could identify differential biological response rates between xenograft models and therapies. Finally, we performed a co-clinical trial3 using small data to test if LPM could detect multiple therapeutics with both improved power and reduced animal numbers.
Methods and results
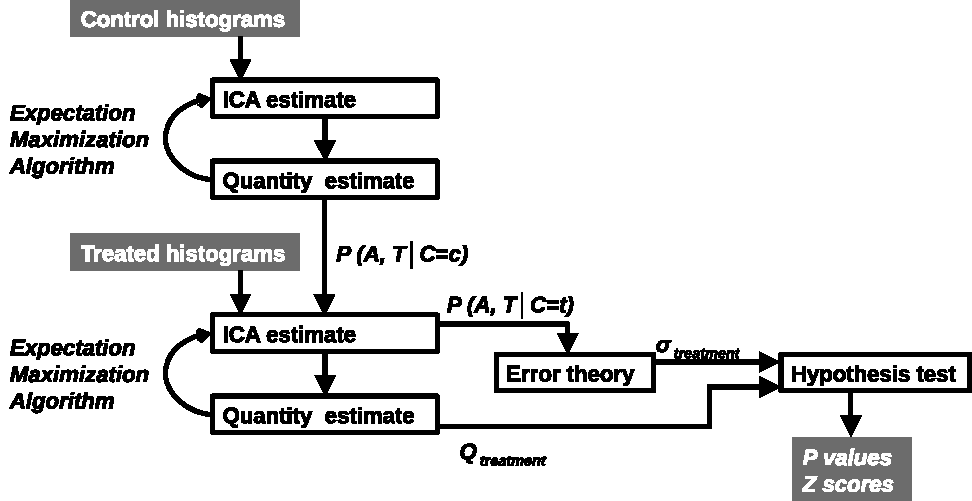
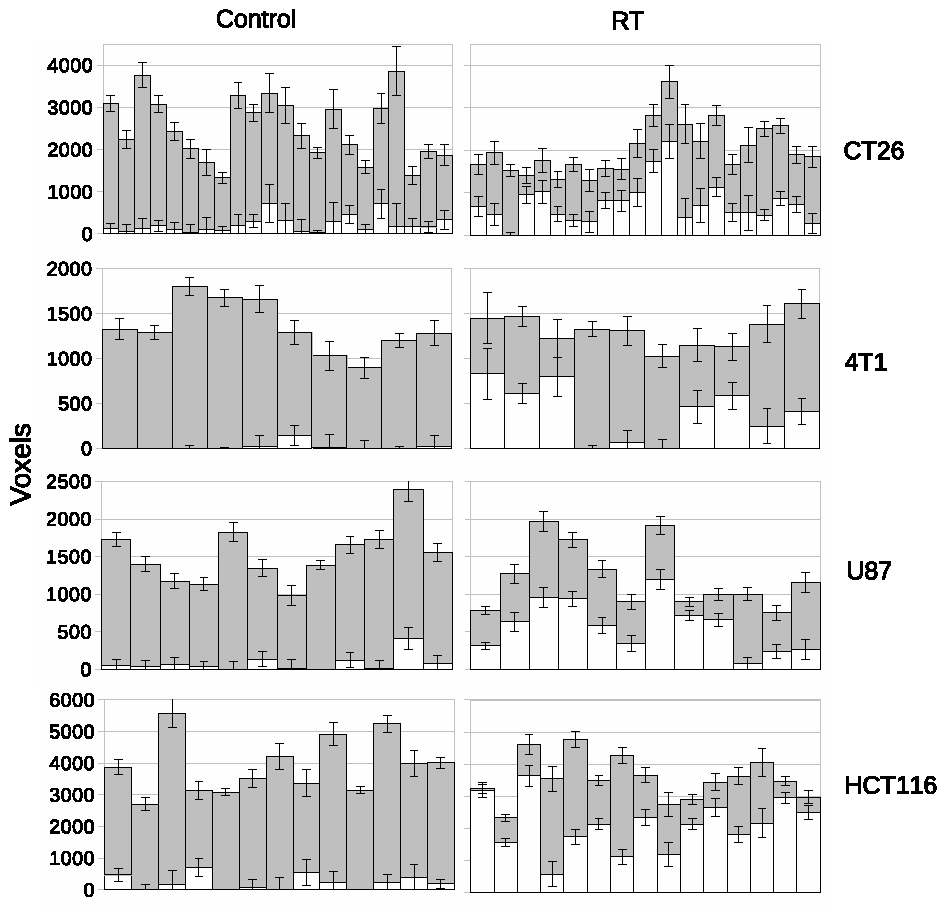
LPM is a data density modelling technique with the addition of a comprehensive theory of uncertainty that facilitates the estimation of statistical significances. Cohorts of histograms are modelled as a linear combination of probability mass functions, with Likelihood estimates of parameters computed using Expectation Maximization. Parameter uncertainties are estimated using error propagation. In the context of therapeutic trials, histograms of biomarkers (here, ADC) are prepared for control and treatment cohorts. An LPM is trained to recognise the differences between these two groups and also model variability caused by different tumor micro-environments. When fitted to individual tumors, LPM provides a lower-bound on treatment response and a Z-score (or p-value) specifying the significance of the result [2] (Figure 1).All experiments were performed on a 7T Bruker system. DWI (TR/TE = 2250/20ms; α= 90°; b values 150, 500 and 1000 s/mm2) data enabled voxel-wise calculation of ADC across the tumor using standard methods [3]. Using control and treatment cohorts of N between 8 and 12, LPM distinguished biological response rates between subcutaneous implanted non-small cell lung cancer Calu6 xenograft tumors treated with three different therapies (radiotherapy (RT), fractionated chemoradiotherapy (FCRT) and atovaquone (ATV); see Figure 2). Next, we compared biological response rates in Calu6 tumors and those from five other xenograft models (Lovo, HCT116, U87 and the syngeneic models CT26 and 4T1) all treated with 10Gy single fraction RT (Figure 3). These cohort sizes are in line with those commonly used with t-test. However, LPM provided per-tumor response estimates and each at very high levels of significance in the order of 1 in 1,000 to 1 in 1,000,000.
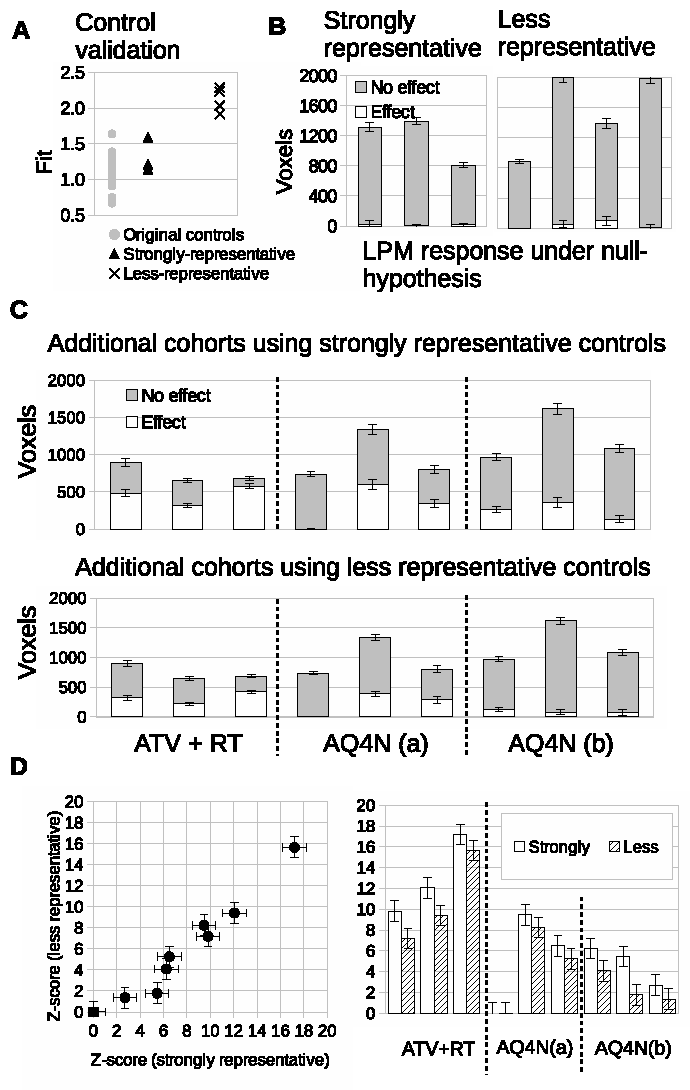
Finally, we acquired data in a new cohorts of Calu6 tumors for control mice with N=3 and three new treatment groups each of just N=3, to simulate a mock co-clinical trial. We evaluated the prospective control data and compared it to the original control cohort. The fit of the 3 prospective control tumors was comparable to the original cohort controls (Figure 4A). Responding volumes were computed for these 3 controls and were shown to be compatible with original controls and the null hypothesis of there being no treatment effects (Figure 4B). LPM identified the relative response rates of the 3 new therapies. There were 3/3 biological responders in mice treated with combined atovaquone and radiotherapy (ATV-RT); 2/3 biological responders in the AQ4N 60mg/kg single dose group and 3/3 biological responders in the banoxantrone 20mg/kg daily group (Figure 4C). Z scores were highly significant (Figure 4D).
Discussion
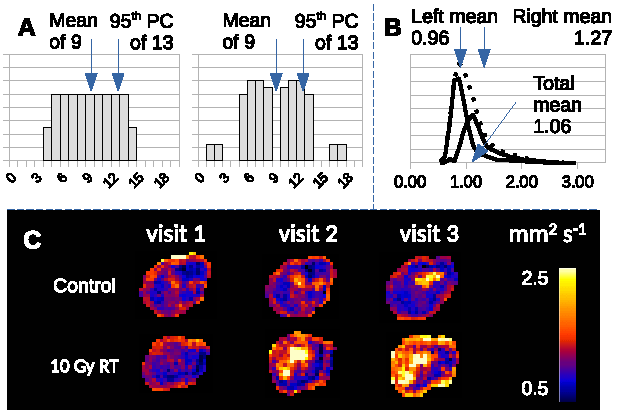
Conventional statistical approaches tend to evaluate preclinical MRI data at the cohort level in oncology and use cohorts of approximately 8-12 animals per group. Tumor heterogeneity can make it difficult to detect effects using this design as simple distribution parameters can be ambiguous (Figure 5 A), and distributions are non-Gaussian (Figure 5 B and C). LPM provides an alternative approach and these data show how this method can detect biological response in individual tumors. This output can be used to identify differential response rates across different therapies and different tumor models. Further, the power of LPM is sufficient to enable prospective evaluation of new therapies in very small N (here, just N=3) once a control model has been built. Collectively, this analysis method makes MRI an option for high throughput screening of single agent and combination therapies across a range of preclinical models, using a reduced number of animals [4].Acknowledgements
No acknowledgement found.References
[1] O’Connor JPB et al., 2015 Clin Cancer Res 21: 249-257
[2] Tar P et al., 2018 Bioinformatics 34: 2625-2633
[3] Clohessy JG, Pandolfi PP, 2015 Nat Rev Clin Oncol 12: 491-508
[4] Workman P, 2012 Br J Cancer 102: 1555-7
Figures