1415
Correlating neurite density and synaptic density in the human brain in vivo with diffusion-weighted PET-MR
Daan Christiaens1,2, Thomas Vande Casteele2,3,4, Maarten Laroy2,4, Margot Van Cauwenberge2,3,4, Jan Van den Stock3,4, Filip Boeckaert3,4, Stefan Sunaert2,5,6, Mathieu Vandenbulcke3,4, Frederik Maes1,2, and Louise Emsell2,3,4,5
1Department of Electrical Engineering, ESAT/PSI, KU Leuven, Leuven, Belgium, 2Medical Imaging Research Center, University Hospitals Leuven, Leuven, Belgium, 3Geriatric Psychiatry, UPC KU Leuven, Leuven, Belgium, 4Leuven Brain Institute, Department of Neurosciences, Neuropsychiatry, KU Leuven, Leuven, Belgium, 5Department of Imaging & Pathology, Translational MRI, KU Leuven, Leuven, Belgium, 6Radiology, University Hospitals Leuven, Leuven, Belgium
1Department of Electrical Engineering, ESAT/PSI, KU Leuven, Leuven, Belgium, 2Medical Imaging Research Center, University Hospitals Leuven, Leuven, Belgium, 3Geriatric Psychiatry, UPC KU Leuven, Leuven, Belgium, 4Leuven Brain Institute, Department of Neurosciences, Neuropsychiatry, KU Leuven, Leuven, Belgium, 5Department of Imaging & Pathology, Translational MRI, KU Leuven, Leuven, Belgium, 6Radiology, University Hospitals Leuven, Leuven, Belgium
Synopsis
11C-UCB-J PET offers a unique imaging modality to map synaptic density in the human brain in vivo with high specificity. Here, we investigate its correlation with several diffusion MRI metrics and microstructure model parameters in diffusion-weighted PET-MR. We report moderate negative correlation of 11C-UCB-J uptake with measures of anisotropy, consistent with a hypothesis that higher synaptic density is associated with a more disorganised neurite configuration. We also find weak positive correlation to the intra-axonal signal fraction in cortical grey matter. As such, 11C-UCB-J PET-MR can further the interpretation and in vivo validation of more advanced microstructure models of grey matter.
Introduction
Microstructure modelling with diffusion MRI (dMRI) can probe measures of neural and glial microstructure in the brain, based on models of tissue compartments and their contribution to the dMRI signal. However, the interpretation of current dMRI metrics and model parameters in relation to underlying biological effects often remains in question. Independent imaging modalities with higher specificity can aid our understanding of microstructure model parameters and offer a potential path toward their in vivo validation.The 11C-UCB-J radiotracer is a novel PET imaging tracer that binds with high specificity to the synaptic vesicle glycoprotein 2A 1, a protein that is expressed ubiquitously in presynaptic vesicles. 11C-UCB-J PET imaging therefore can serve as a proxy for synaptic density in the human brain 2. Synaptic density may, in turn, be expected to correlate with neurite (axon and dendrite) density in grey matter.
Here, we explore to what extent conventional and more advanced dMRI metrics, including model estimates of neurite density, correlate regionally with 11C-UCB-J uptake in multi-shell diffusion-weighted PET-MR imaging data acquired in vivo.
Materials and Methods
Data. We retrospectively selected imaging data of 8 healthy controls (4 male, 4 female; age 61-73y) with good quality data that were originally scanned for a clinical study on a GE Signa 3T PET-MR system. dMRI data were acquired with 2.5 x 2.5 x 2.5 mm resolution; TE = 87ms; TR = 6600ms; multiband (hyperband) factor 2; GRAPPA (ARC) factor 2; b-values 0, 700, 1000 and 2000 s/mm2 with 12, 20, 32 and 60 isotropically distributed gradient directions respectively. dMRI data were preprocessed with denoising 3, Gibbs ringing suppression 4, motion and distortion correction 5,6, and bias field correction 7 using MRtrix3 8. 11C-UCB-J PET imaging was simultaneously acquired with spatial resolution of 4 x 4 x 4 mm; Standardized Uptake Value Ratio (SUVR) images were calculated relative to the centrum semiovale. A T1w image with 1mm isotropic resolution was segmented into white matter (WM), cortical grey matter (CGM), and deep grey matter (DGM) using FSL FAST 9.dMRI metrics. We calculated 4 sets of dMRI parameters, shown in Figure 1:
- Signal metrics: The mean dMRI signal in each shell and the generalised fractional anisotropy (GFA) in each shell, defined as the standard deviation of the signal intensity divided by the root mean square signal intensity.
- DTI metrics: mean diffusivity (MD) and fractional anisotropy (FA) of the diffusion tensor 10, fitted to the b ≤ 1000 s/mm2 data.
- MT-CSD metrics: the total apparent fibre density (AFD), defined as the integral of the WM fibre orientation distribution function (ODF), which was estimated using multi-shell multi-tissue constrained spherical deconvolution (MT-CSD) 11.
- Microstructure metrics: parameters of the standard 2-compartment model of WM microstructure, which consists of an intra-axonal stick compartment with fraction f and axial diffusivity Di, and an extracellular zeppelin compartment with axial and radial diffusivity De∥ and De⟂ (parametrized by the trace De = De∥ + 2De⟂ and difference ΔDe = De∥ - De⟂), and which also models fibre crossings and dispersion in a ODF 12,13. The microstructure parameters and the ODF spectral power pL, L=0,2,4,... are jointly estimated in Bayesian fashion using Monte Carlo integration based on rotation-invariant signal features 14.
Results
Figure 2 shows boxplots of the correlation coefficients in each of the dMRI contrasts. We find moderate (|R| > 0.5) negative correlation with measures of tissue anisotropy (GFA, FA, and the spectral power ratio p2/p0) in most tissues, with high consistency across subjects.In CGM, where 11C-UCB-J uptake is highest, we also find a weak positive correlation with the intra-axonal fraction f (R = 0.35), the intra-axonal diffusivity Di (R = 0.45), and the anisotropy of the extra-axonal compartment ΔDe (R = 0.47).
The correlation with signal-level GFA measures exceeds model-based metrics. These correlations were also the most consistent across tissues and subjects.
Joint histograms of 11C-UCB-J uptake and the dMRI metrics, shown in Figure 3 for signal, DTI and MT-CSD metrics and in Figure 4 for standard model parameters, reveal nonlinear codependencies but also confirm the correlation with dMRI measures of anisotropy.
Discussion and Conclusion
The moderate correlation with dMRI anisotropy is consistent with a hypothesis that higher synaptic density is associated with a more disorganised neurite configuration (dendritic branching etc.). Evidence of a positive correlation with neurite density in grey matter, measured indirectly by the intra-axonal fraction f or AFD, is weak or inconclusive.Due to the low spatial resolution of PET and dMRI relative to cortical thickness, partial volume effects are a limiting factor in the analysis. Furthermore, the standard WM model does not account for additional signal contributions in grey matter, notably due to soma presence 15 and inter-compartmental exchange 16. Future work can explore these and other more advanced microstructure models for grey matter with bespoke dMRI acquisition strategies.
Acknowledgements
DC is supported by the Flemish Research Foundation (FWO), grant number 12ZV420N. ML is supported by the FWO grant number 1168821N. FB, MV and LE are supported by the FWO grant G0C0319N, and along with JVdS by KU Leuven grant C24/18/095 and The Sequoia Fund.References
- Nabulsi NB, Mercier J, Holden D, et al. Synthesis and Preclinical Evaluation of 11C-UCB-J as a PET Tracer for Imaging the Synaptic Vesicle Glycoprotein 2A in the Brain. J Nucl Med. 2016;57(5):777-784. doi:10.2967/jnumed.115.168179
- Finnema SJ, Nabulsi NB, Eid T, Detyniecki K, Lin SF, Chen MK, Dhaher R, Matuskey D, Baum E, Holden D, Spencer DD, Mercier J, Hannestad J, Huang Y, Carson RE. Imaging synaptic density in the living human brain. Sci Transl Med. 2016 Jul 20;8(348):348ra96. doi: 10.1126/scitranslmed.aaf6667
- Veraart J, Novikov DS, Christiaens D, Ades-Aron B, Sijbers J, Fieremans E. Denoising of diffusion MRI using random matrix theory. Neuroimage. 2016;142:394-406. doi:10.1016/j.neuroimage.2016.08.016
- Kellner E, Dhital B, Kiselev VG, Reisert M. Gibbs-ringing artifact removal based on local subvoxel-shifts. Magn Reson Med. 2016;76(5):1574-1581. doi:10.1002/mrm.26054
- Andersson JL, Skare S, Ashburner J. How to correct susceptibility distortions in spin-echo echo-planar images: application to diffusion tensor imaging. Neuroimage. 2003;20(2):870-888. doi:10.1016/S1053-8119(03)00336-7
- Andersson JLR, Sotiropoulos SN. An integrated approach to correction for off-resonance effects and subject movement in diffusion MR imaging. Neuroimage. 2016;125:1063-1078. doi:10.1016/j.neuroimage.2015.10.019
- Tustison NJ, Avants BB, Cook PA, et al. N4ITK: improved N3 bias correction. IEEE Trans Med Imaging. 2010;29(6):1310-1320. doi:10.1109/TMI.2010.2046908
- Tournier JD, Smith R, Raffelt D, et al. MRtrix3: A fast, flexible and open software framework for medical image processing and visualisation. Neuroimage. 2019;202:116137. doi:10.1016/j.neuroimage.2019.116137
- Zhang Y, Brady M, Smith S. Segmentation of brain MR images through a hidden Markov random field model and the expectation-maximization algorithm. IEEE Trans Med Imaging. 2001;20(1):45-57. doi:10.1109/42.906424
- Basser PJ, Mattiello J, LeBihan D. MR diffusion tensor spectroscopy and imaging. Biophys J. 1994;66(1):259-267. doi:10.1016/S0006-3495(94)80775-1
- Jeurissen B, Tournier JD, Dhollander T, Connelly A, Sijbers J. Multi-tissue constrained spherical deconvolution for improved analysis of multi-shell diffusion MRI data. Neuroimage. 2014;103:411-426. doi:10.1016/j.neuroimage.2014.07.061
- Novikov DS, Veraart J, Jelescu IO, Fieremans E. Rotationally-invariant mapping of scalar and orientational metrics of neuronal microstructure with diffusion MRI. Neuroimage. 2018;174:518-538. doi:10.1016/j.neuroimage.2018.03.006
- Reisert M, Kellner E, Dhital B, Hennig J, Kiselev VG. Disentangling micro from mesostructure by diffusion MRI: A Bayesian approach. Neuroimage. 2017;147:964-975. doi:10.1016/j.neuroimage.2016.09.058
- Christiaens D, Veraart J, Cordero-Grande L, et al. On the need for bundle-specific microstructure kernels in diffusion MRI. Neuroimage. 2020;208:116460. doi:10.1016/j.neuroimage.2019.116460
- Palombo M, Ianus A, Guerreri M, et al. SANDI: A compartment-based model for non-invasive apparent soma and neurite imaging by diffusion MRI. Neuroimage. 2020;215:116835. doi:10.1016/j.neuroimage.2020.116835
- Jelescu IO, de Skowronski A, Palombo M, Novikov DS. Neurite Exchange Imaging (NEXI): A minimal model of diffusion in gray matter with inter-compartment water exchange. arXiv. 2021;2108.06121
Figures
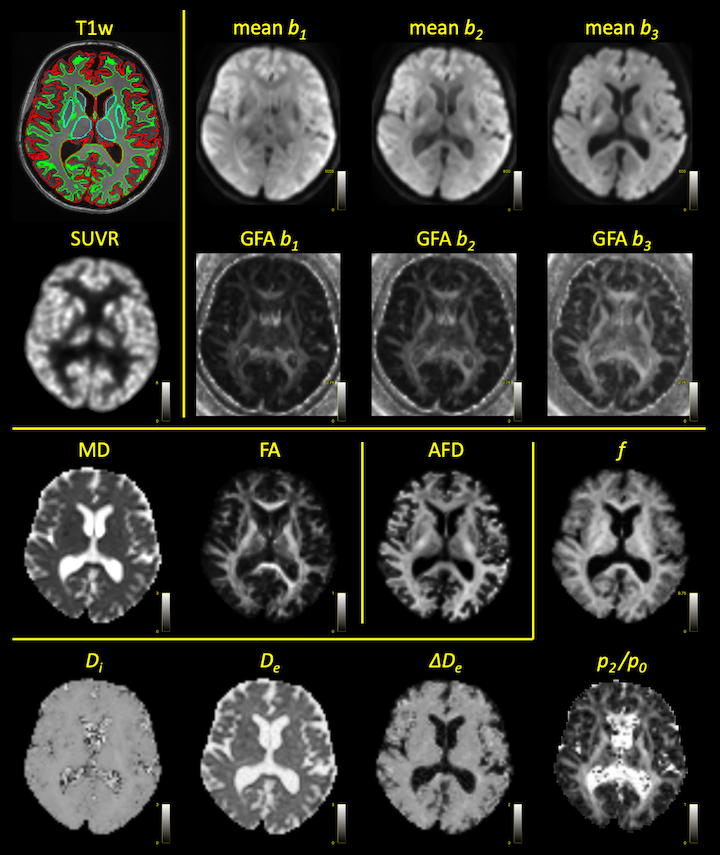
Figure 1: Overview of the PET-MR parameter maps in a single subject: segmented T1w (WM, CGM & DGM); SUVR map of UCB-J uptake; mean and GFA of each shell of the dMRI data; DTI parameters mean diffusivity (MD) and fractional anisotropy (FA); apparent fibre density (AFD) estimated with MT-CSD; and the standard model parameters intra-axonal volume fraction f and diffusivity Di, extra-axonal diffusivity De and ΔDe, and the ODF spectral power ratio p2/p0.
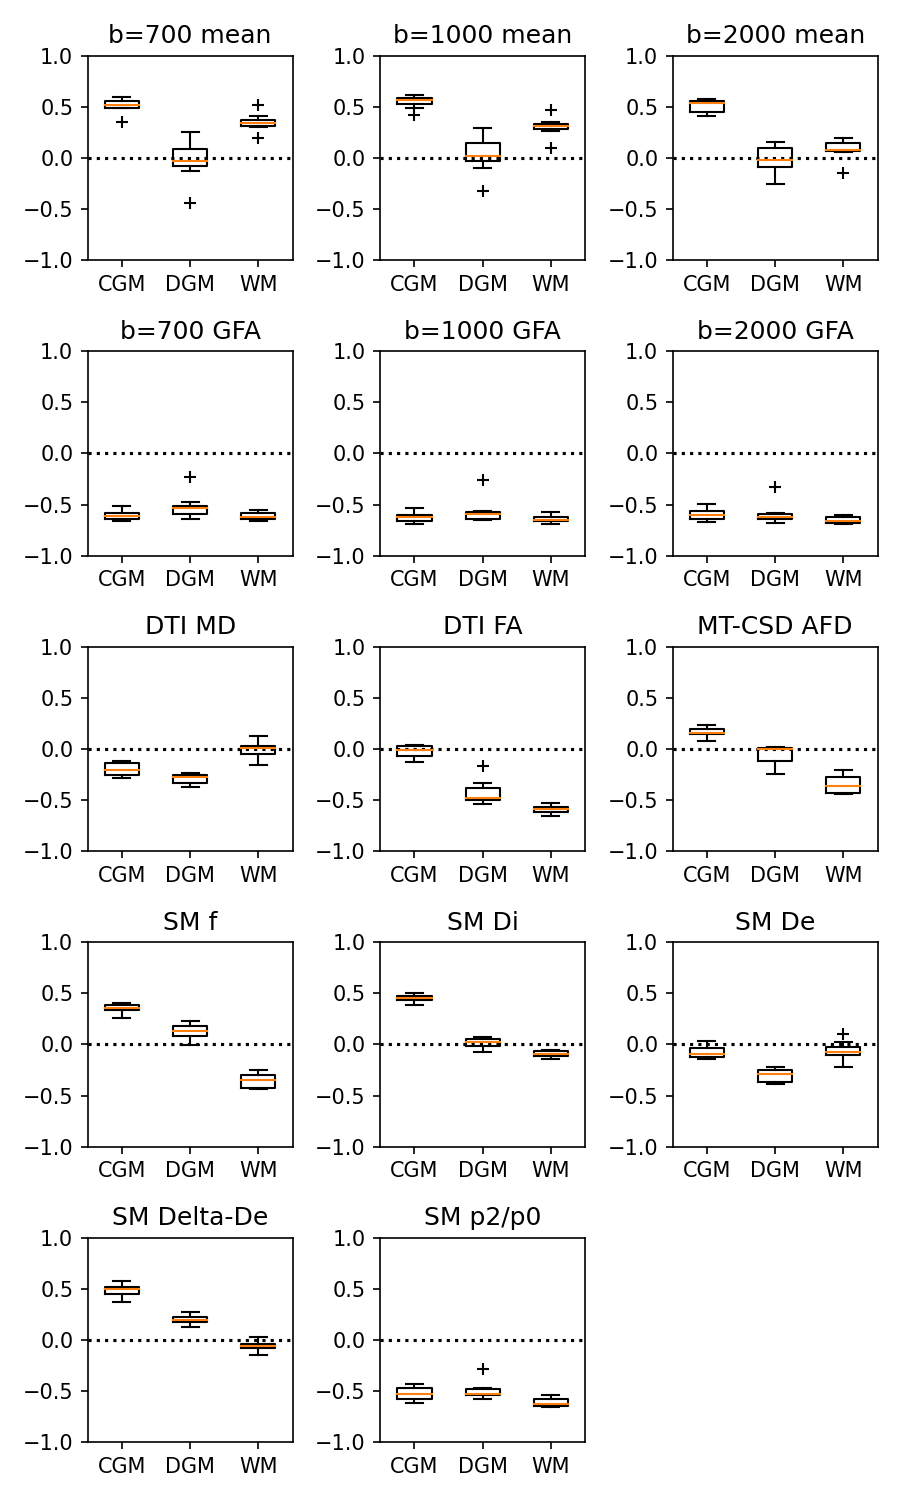
Figure 2: Boxplots of the correlation coefficients between SUVR and each of the listed parameter maps in segmented CGM, DGM and WM. The boxplots display the distribution across subjects; showing high consistency in most parameters and tissue classes.
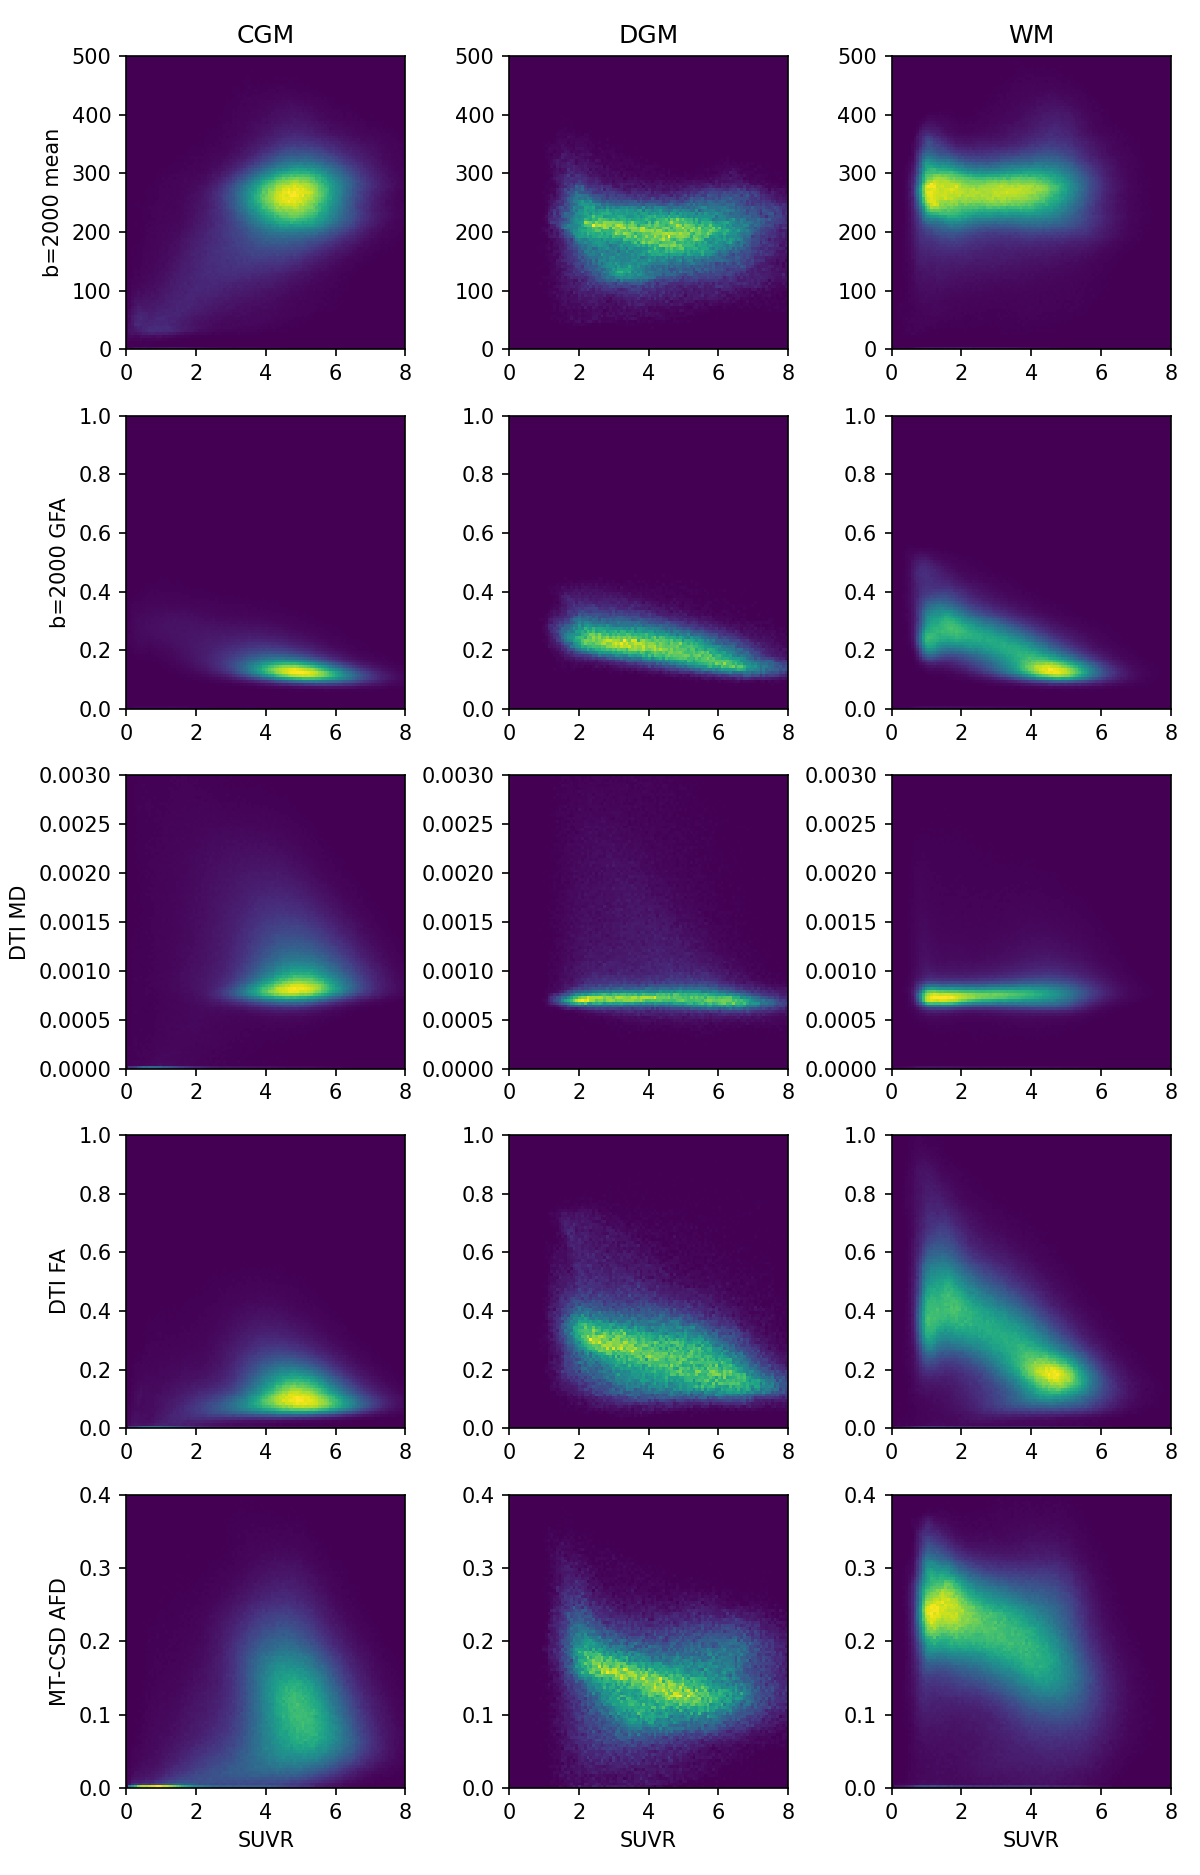
Figure 3: Joint histograms of selected signal, DTI, and MT-CSD metrics with UCB-J SUVR in CGM, DGM and WM, here shown for all subjects combined.
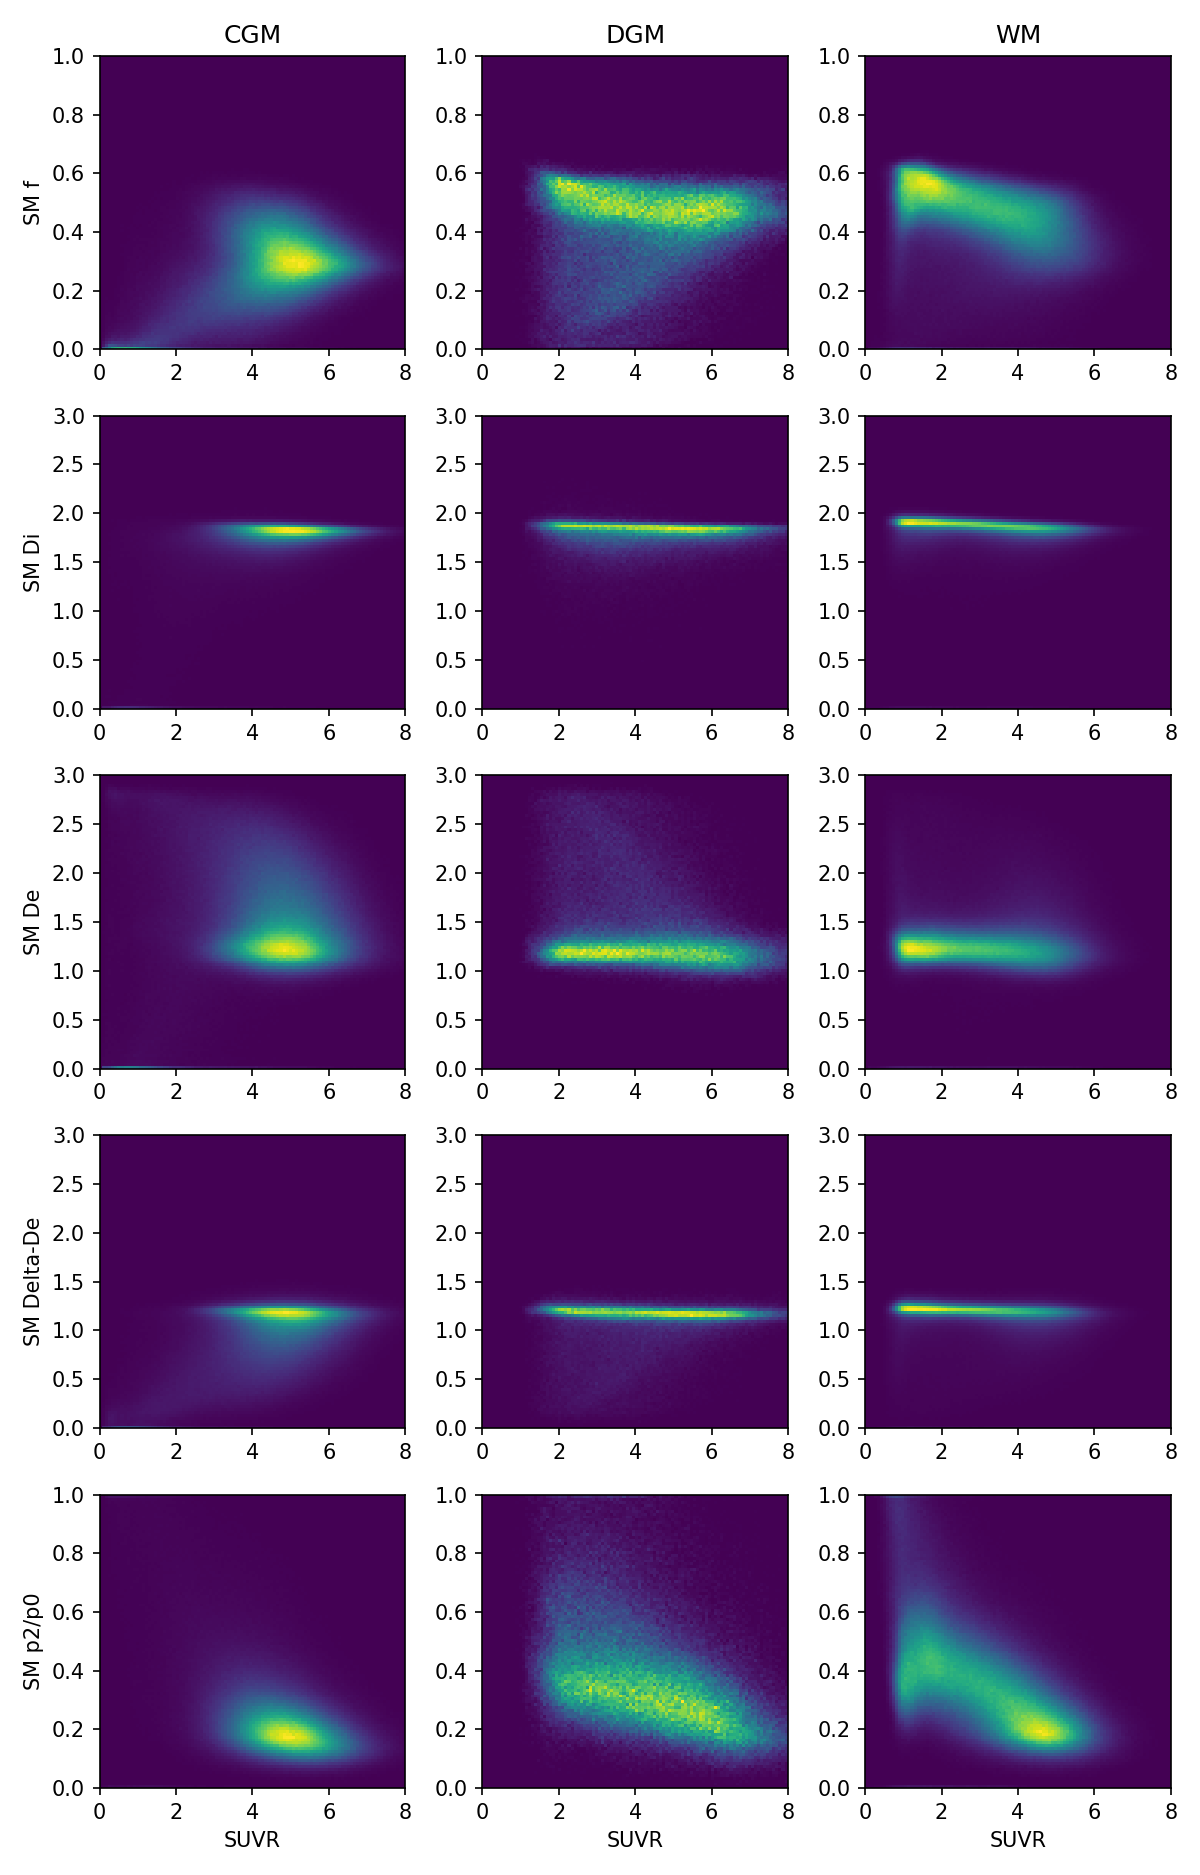
Figure 4: Joint histograms of standard model parameters with UCB-J SUVR in CGM, DGM and WM, here shown for all subjects combined.
DOI: https://doi.org/10.58530/2022/1415