1411
Quantitative UTE Double Echo Steady State (qUTE-DESS) for Simultaneous Mapping of T1, T2, and Diffusivity of Short T2 Tissues – Ex Vivo Study1Radiology, University of California San Diego, San Diego, CA, United States, 2Radiology Service, Veterans Affairs San Diego Healthcare System, San Diego, CA, United States
Synopsis
Quantitative double echo steady state (DESS) imaging allows simultaneous estimation of T1, T2, and apparent diffusion coefficient (ADC) maps with high spatial resolution. Recently, ultrashort echo time (UTE) based DESS has been investigated targeting short T2 tissues. However, ADC mapping for tissues with short T2 values using DESS is challenging due to the two competing factors: sensitivity to diffusion that requires a long TR and sensitivity to short T2 component that requires a short TR. In this study, the feasibility of using quantitative UTE DESS (qUTE-DESS) to image connective tissues in the knee was investigated.
Introduction
Double echo steady state (DESS) sequences have been investigated as a rapid technique for musculoskeletal (MSK) imaging 1–3. Recently, the ultrashort echo time-based DESS (UTE-DESS) sequence has shown efficacy for morphological and quantitative (i.e., rapid T2 mapping) imaging of short T2 tissues 4,5. However, complete parameter fitting with UTE-DESS including T1, T2, and apparent diffusion coefficient (ADC) has not yet been investigated. In this study, we demonstrate the feasibility of using quantitative UTE-DESS (qUTE-DESS) to target short T2 tissues in the knee.Methods
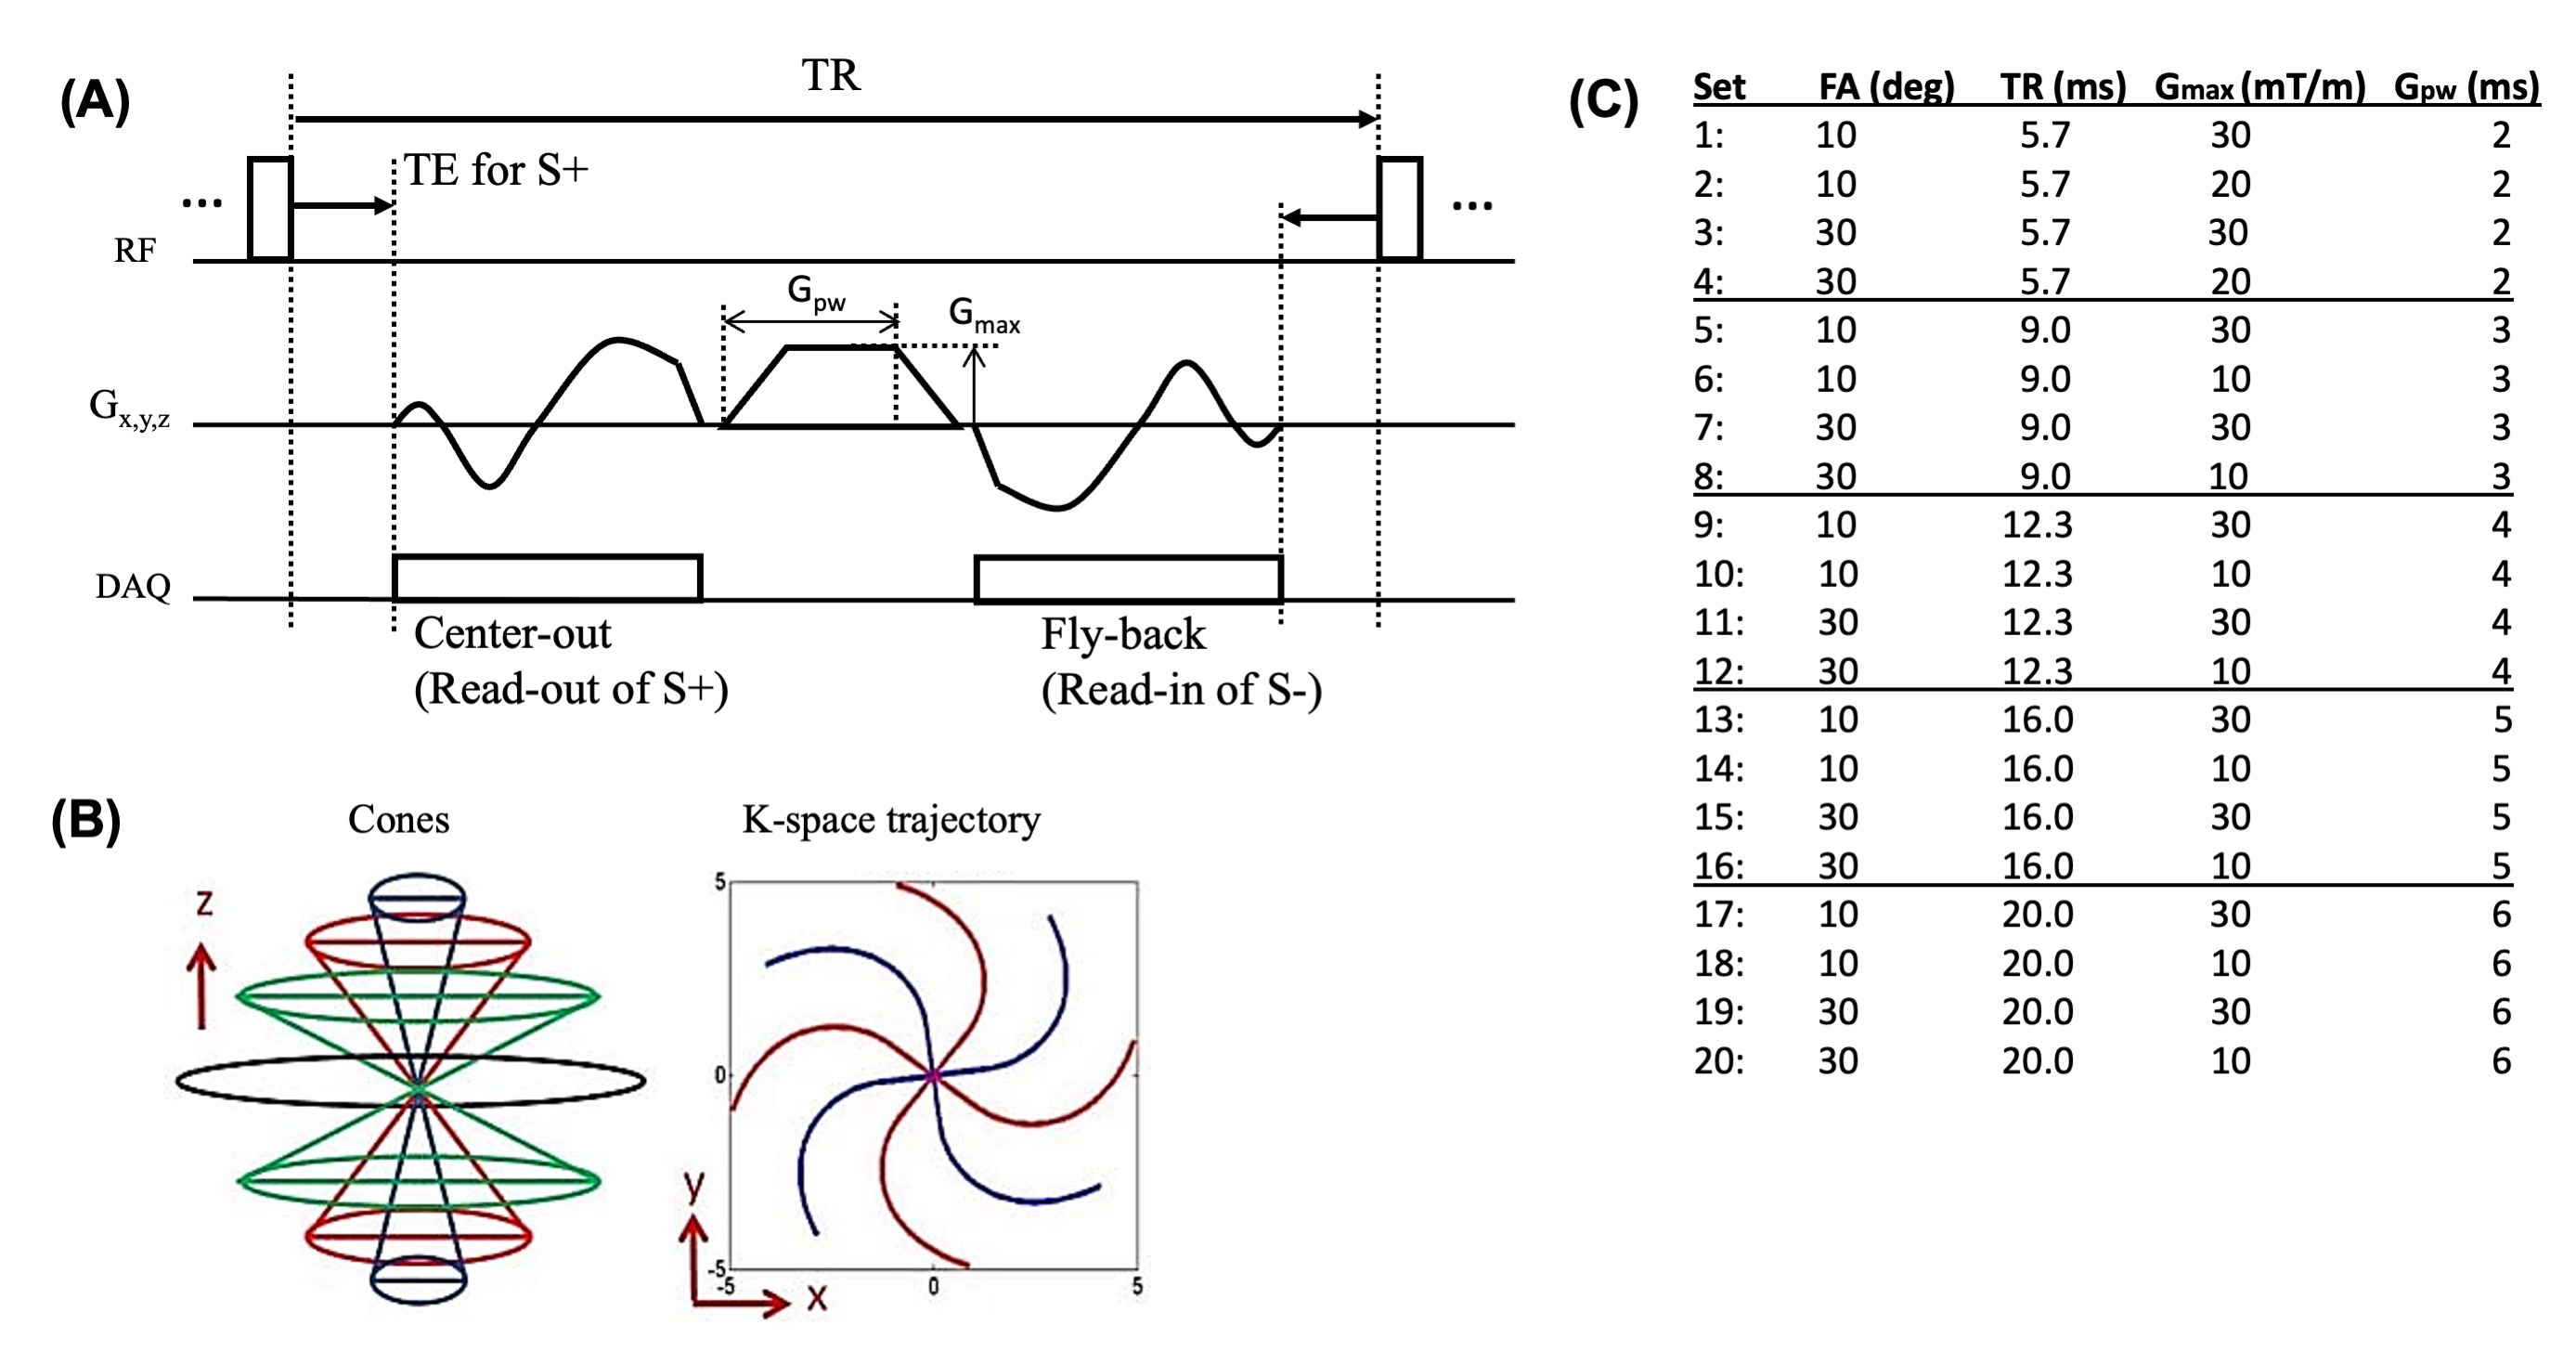
Figure 1A shows the UTE-DESS sequence which uses an efficient 3D cones trajectory (Figure 1B). The steady state signal is composed of stimulated echoes from previous pathways and the current radiofrequency (RF) excitation, which is itself separated into FID-like S+ and spin echo-like S- signals by the spoiling gradient. In UTE-DESS, the S+ echo is typically T1- or proton density-weighted, whereas the S- echo is typically T2- or diffusion-weighted. A longer TR yields more T2-weighing in S-, while a larger spoiling gradient moment (GM) yields higher diffusion weighting. A low flip angle (FA) yields higher diffusion weighting which is further determined by the T2 relaxation time. The DESS signal can be modelled after the steady-state free precession signal model 6,7.In this study, qUTE-DESS imaging was based on a variable-FA and variable-GM approaches to facilitate parameter mapping. In general, large enough GMs (i.e., Gpw×Gmax) are necessary to yield adequate diffusion weighting, but this inevitably results in a longer minimum TR due to the length of the gradient waveform and gradient safety constraints to avoid excessive heating. Unfortunately, in qUTE-DESS targeting short T2 tissues, a long TR can lead to an undesirable signal decay in S- as a result of the T2-weighting’s dependence on TR. Given the demonstrated importance of finding appropriate imaging parameters to achieve qUTE-DESS, this study investigated the effects of GM and TR in qUTE-DESS based on the protocol sets shown in Figure 1C.
UTE-DESS sequence was implemented on a 3T GE-MR750. Six cadaveric knee joints (71.0±24.6-year-old) were scanned using an 8-channel transmit/receive knee coil. Image reconstruction and processing as well as signal fitting were done in Matlab. Signal fitting was performed utilizing the non-linear least square fitting algorithm based on the signal model established by Freed et al 6. Pixelwise intensities from S+ and S- echoes in all four acquisitions (i.e., 8 data points) were inputted to the fitting algorithm to fit four free parameters (i.e., M0, T1, T2, and ADC). B1 mapping was performed to estimate actual FAs 8.
Results
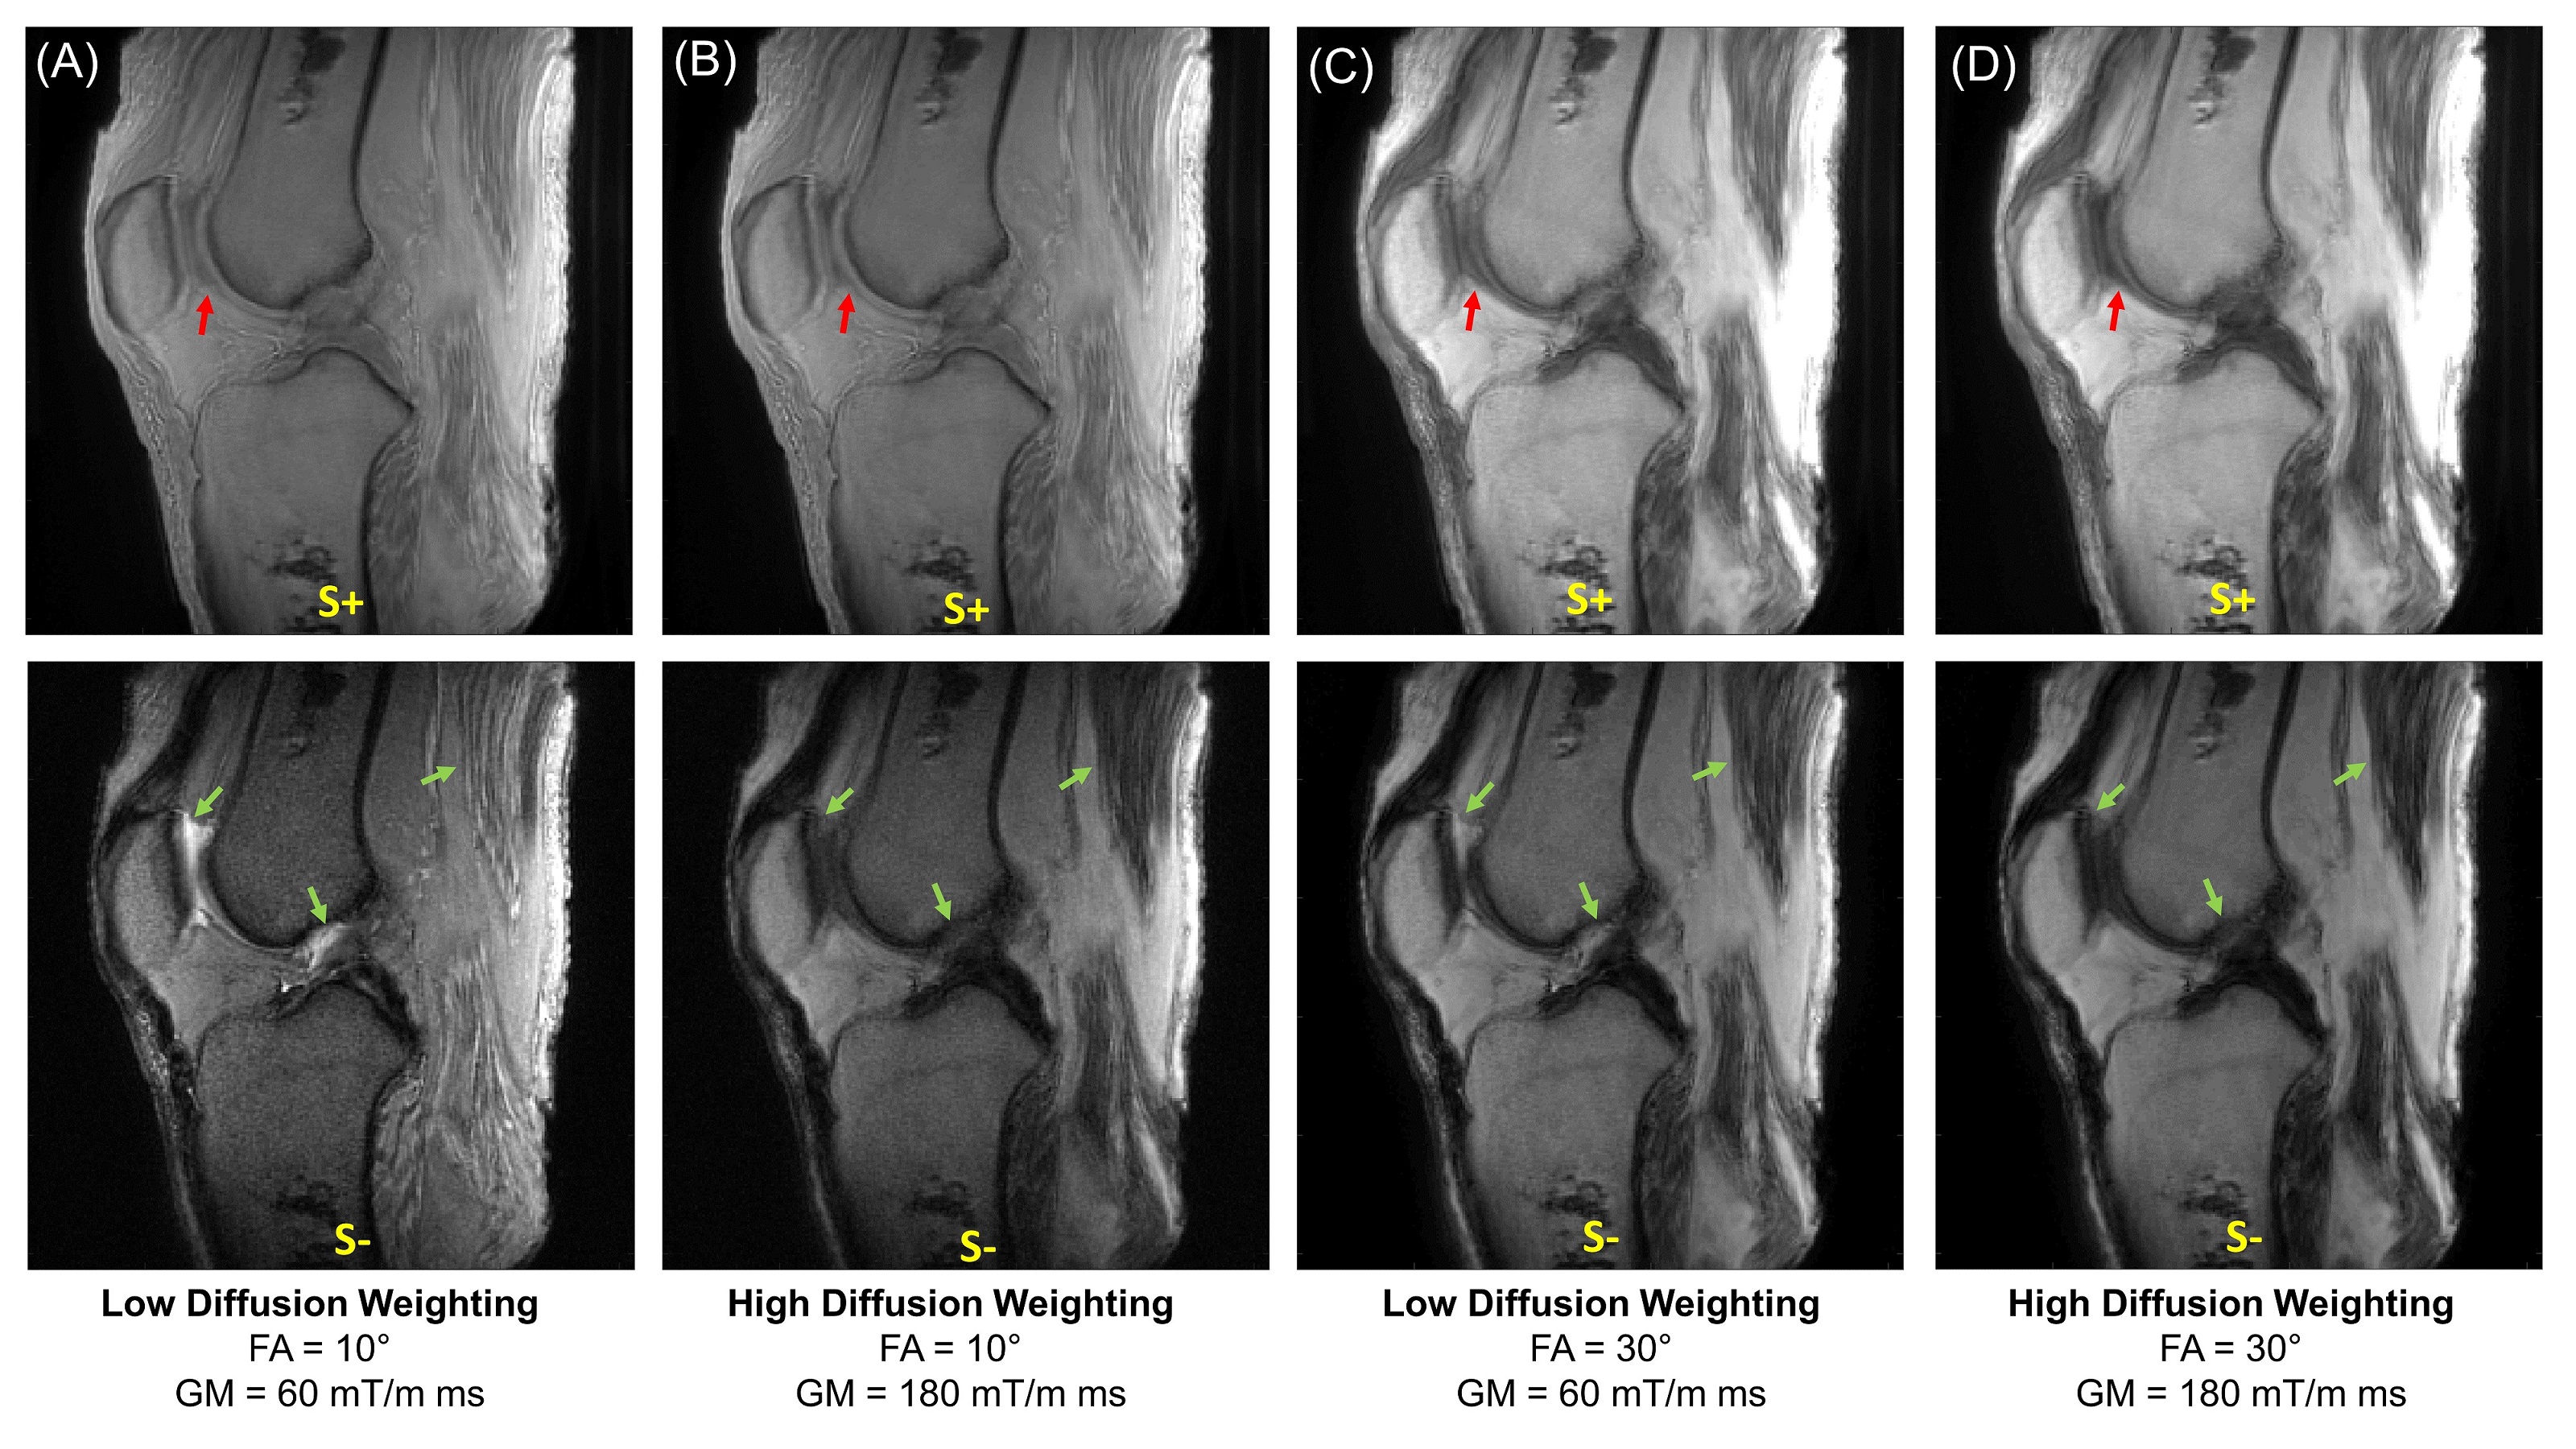
Figure 2 shows UTE-DESS images of a knee joint acquired using protocol sets #17-20. Substantial signal decay was observed between the images acquired with low or high GMs (i.e., low or high diffusion weighting), and was most apparent in the S- echo images of tissues such as muscle and fluid in synovium (green arrows). Diffusion weighting was seen in the S+ echo but more obvious in longer T2 components such as fluid (red arrows). Lower FA yielded more dramatic diffusion weighting as expected.Figures 3A and 3B show UTE-DESS images acquired with low (left) and high (right) GMs. Cartilage showed obvious diffusion weighting between low and high GMs in the S- echo (Figure 3A). However, a significant portion of the signals from the meniscus (Figure 3A) and patellar tendon (Figure 3B) decayed between the S+ and S- echoes due to the short T2, an effect exacerbated using longer TRs. Figure 3C shows the fitted ADC map with different TRs. Shorter TRs (i.e., 5.7 or 9.0 ms) yielded noisy ADC maps implying too low a diffusion sensitivity. On the other hand, longer TRs (i.e., 16.0 or 20.0 ms) were not ideal due to the long effective echo time (TE) in the S- echo. A TR of 12.3 ms (i.e., protocol sets #9-12) was chosen for data acquisition of the remaining five knee joints.
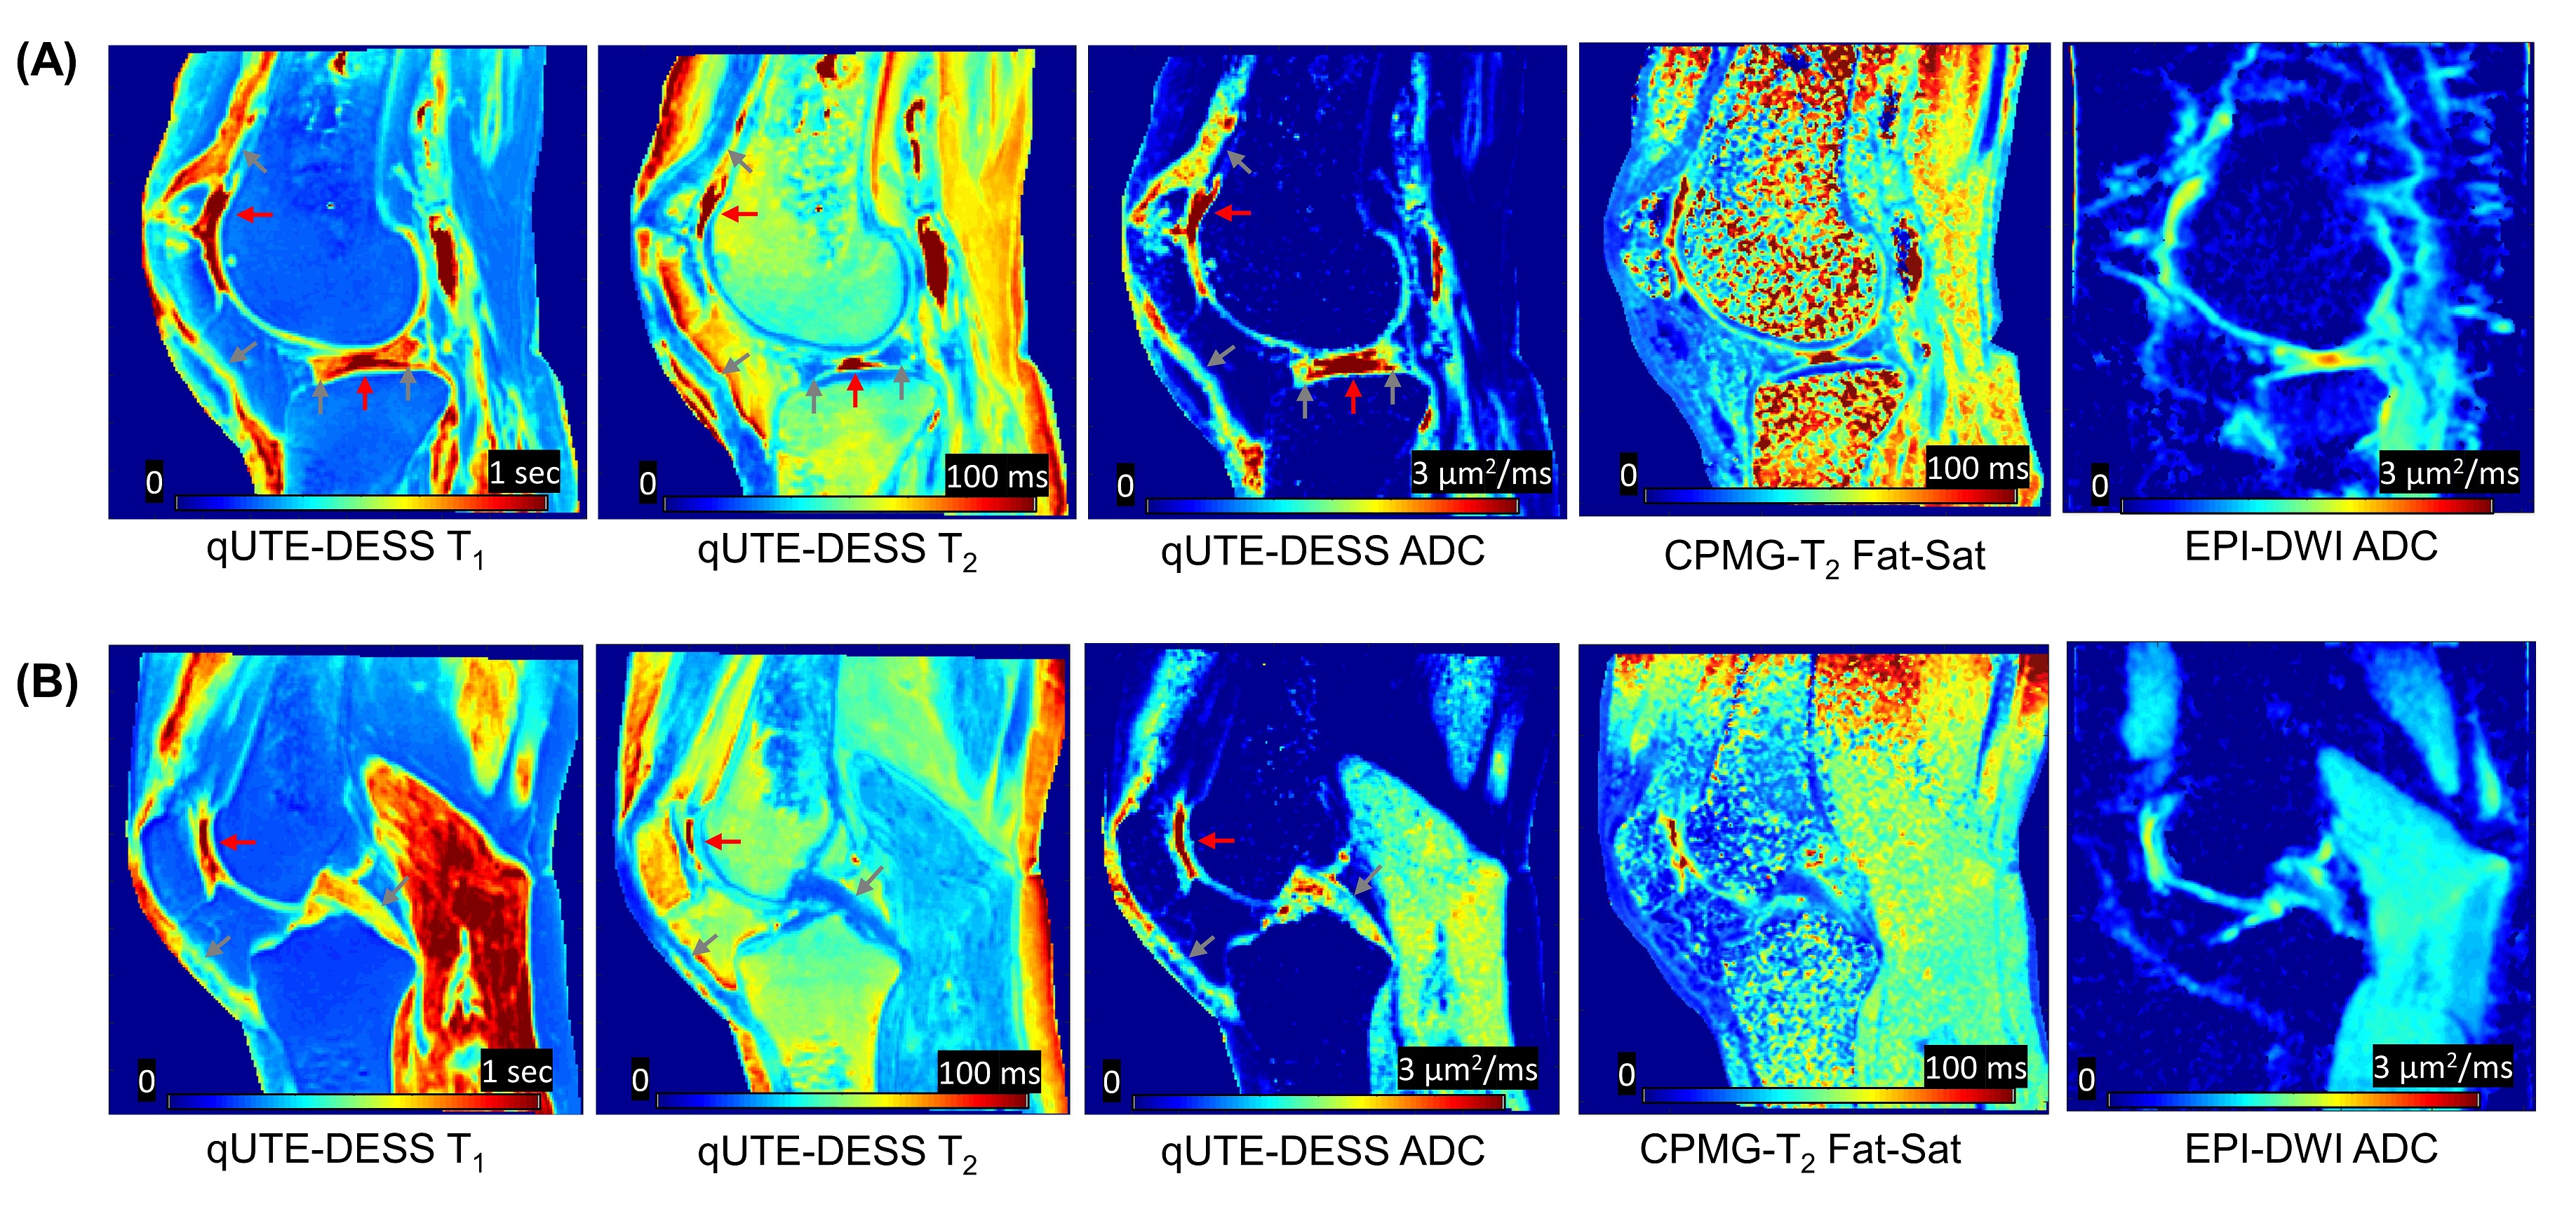
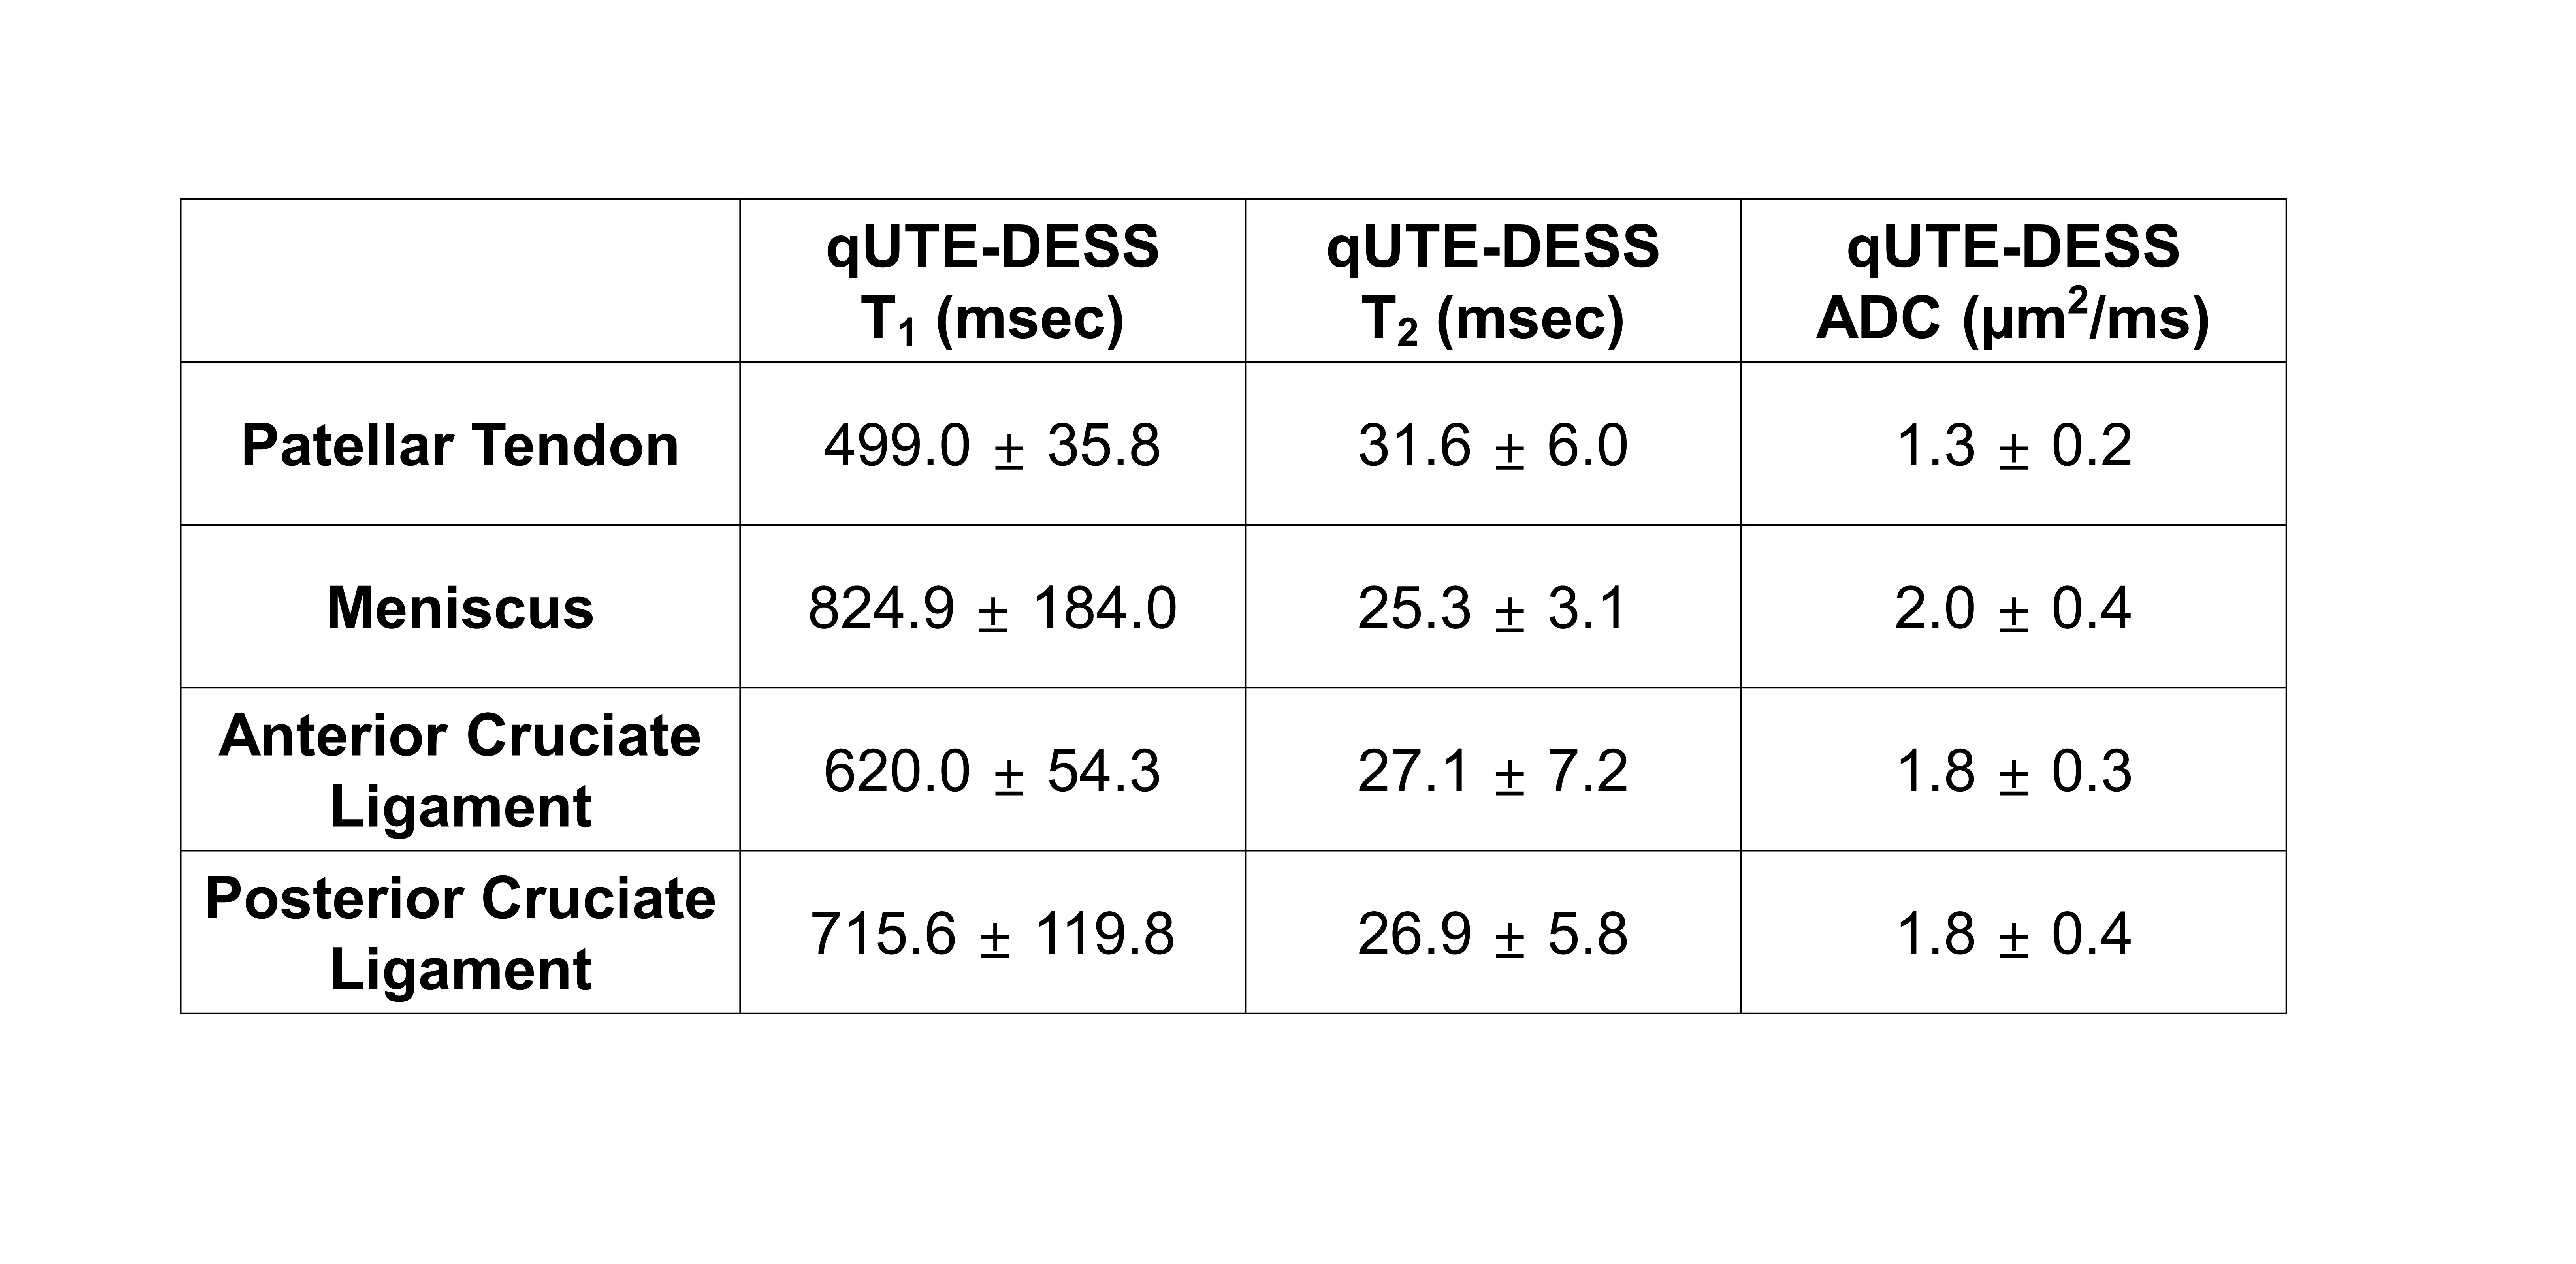
For all knee samples, high resolution parameter maps were achieved with qUTE-DESS. Figure 4 shows the estimated T1, T2, and ADC maps as well as the T2 and ADC maps from Carr-Purcell-Meiboom-Gill (CPMG) and echo-planar imaging diffusion weighted imaging (EPI-DWI) sequences. The qUTE-DESS-T1, qUTE-DESS-T2, and qUTE-DESS-ADC maps clearly detected fluid (red arrows) as well as short T2 tissues (gray arrows). Overall, qUTE-DESS and conventional sequences produced similar ADC and T2 values for non-lipid tissues, whereas EPI-DWI exhibited high spatial distortion and slightly underestimated ADC values. Figure 5 shows estimated parameters for four regions in all knee joints. T2 values estimated in the patellar tendon were higher than expected, suggesting that only the long components were detected as a result of the effective TE being longer than the T2 of the short components. Other parameters were within the expected ranges.
Discussion and Conclusion
We showed feasibility of qUTE-DESS in simultaneous estimation of T1, T2, and ADC. This pilot study was limited by the age of the knee joint donors, as excessive fluid may have caused deviations in the estimated parameters. In future works, the qUTE-DESS sequence will be further optimized for a systematic study of healthy volunteers and patients with osteoarthritis. The proposed approach will be feasible in vivo as it only requires four repeated acquisitions.Acknowledgements
The authors acknowledge grant support from the NIH (R01AR062581, R01AR068987, R01AR075825, R01AR078877, and R21AR075851), Veterans Affairs (I01RX002604 and I01CX001388), and GE Healthcare.References
1. Hardy PA, Recht MP, Piraino D, Thomasson D. Optimization of a Dual Echo in the Steady State (DESS) free-precession sequence for imaging cartilage. J. Magn. Reson. Imaging 1996;6:329–335.
2. Welsch GH, Scheffler K, Mamisch TC, et al. Rapid estimation of cartilage T2 based on double echo at steady state (DESS) with 3 Tesla. Magn. Reson. Med. 2009;62:544–549.
3. Moriya S, Miki Y, Yokobayashi T, Ishikawa M. Three-Dimensional Double-Echo Steady-State (3D-DESS) magnetic resonance imaging of the knee: Contrast optimization by adjusting flip angle. Acta radiol. 2009;50:507–511.
4. Chaudhari AS, Sveinsson B, Moran CJ, et al. Imaging and T2 relaxometry of short-T2 connective tissues in the knee using ultrashort echo-time double-echo steady-state (UTEDESS). Magn. Reson. Med. 2017;78:2136–2148.
5. Jang H, Ma Y, Carl M, Jerban S, Chang EY, Du J. Ultrashort echo time Cones double echo steady state (UTE‐Cones‐DESS) for rapid morphological imaging of short T2 tissues. Magn. Reson. Med. 2021;86:881–892.
6. Freed DE, Scheven UM, Zielinski LJ, Sen PN, Hürlimann MD. Steady-state free precession experiments and exact treatment of diffusion in a uniform gradient. J. Chem. Phys. 2001;115:4249–4258.
7. Bieri O, Ganter C, Scheffler K. Quantitative in vivo diffusion imaging of cartilage using double echo steady-state free precession. Magn. Reson. Med. 2012;68:720–729.
8. Yarnykh VL. Optimal radiofrequency and gradient spoiling for improved accuracy of T1 and B1 measurements using fast steady-state techniques. Magn. Reson. Med. 2010;63:1610–1626.
Figures