1409
Zero Echo Time (ZTE) MRI-Based 3D Collision Modeling of Femoroacetabular Impingement1Radiology and Imaging, Hospital for Special Surgery, New York, NY, United States
Synopsis
To simultaneously improve assessment of patholomorphologies of the hip and reduce the reliance on CT imaging, this study sought to utilize Zero Echo Time (ZTE) MRI to create patient-specific 3D models of the hip and perform in silico kinematic collision simulations to quantify hip range of motion in a cohort of patients with radiologic signs of FAI and hip dysplasia. Range of motion assessments indicate that patients' simulated ranges of motion comport with their radiologically diagnosed conditions.
Introduction
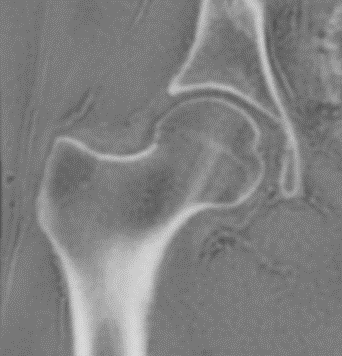
Femoroacetabular impingement (FAI), characterized as an intrusion of the femoral neck onto the acetabular rim is a skeletal pathomorphology of the hip presenting as groin pain. Accurate imaging of the bones of the hip is necessary to assess the severity of the condition and to determine appropriate interventions. Due to frequent concomitant soft tissue injury, MRI is frequently employed in diagnosis but lacks sufficient contrast for bone, particularly in the presence of other adjacent short T2 tissues1 (e.g., the labrum). Zero echo time (ZTE) MRI sequences can enable visualization of bone with CT-like contrast as previously explored in clinical applications to the cranium, shoulder, spine, and hip.1,2,3,4 The objective of this study was to investigate the use of ZTE-based patient-specific 3D models of hip morphology to quantitatively characterize FAI constraints on range of motion (ROM) in the hip through an in silico simulated FADIR (Flexion, ADduction and Internal Rotation) test.Methods
As part of a larger IRB-approved study, following patient consent/assent ZTE imaging of 32 hips from 16 patients were obtained immediately following standard-of-care (SOC) MRI of the hip for groin pain and suspected FAI or dysplasia. Of the hips evaluated, 23 exhibited FAI, 6 were dysplastic, and 3 were post-operative for unilateral FAI debridement.ZTE hip series were acquired with the following parameters: TR: 300ms, flip angle: 1°, receiver bandwidth: ±62.5 kHz, FOV: 38-44cm, matrix size: 320, slice thickness: 1.1-1.4 mm, scan time: ~4-7 mins. All scanning was performed on clinical 3.0T scanners (Discovery MR750 or Signa Premier, GE Healthcare, Waukesha, WI). Standard patient positioning and commercial coils (16ch cardiac or 32ch body arrays w/ MR750; MP array + table array w/Premier) were used. An additional knee FSE knee acquisition was obtained to facilitate a femoral coordinate system.
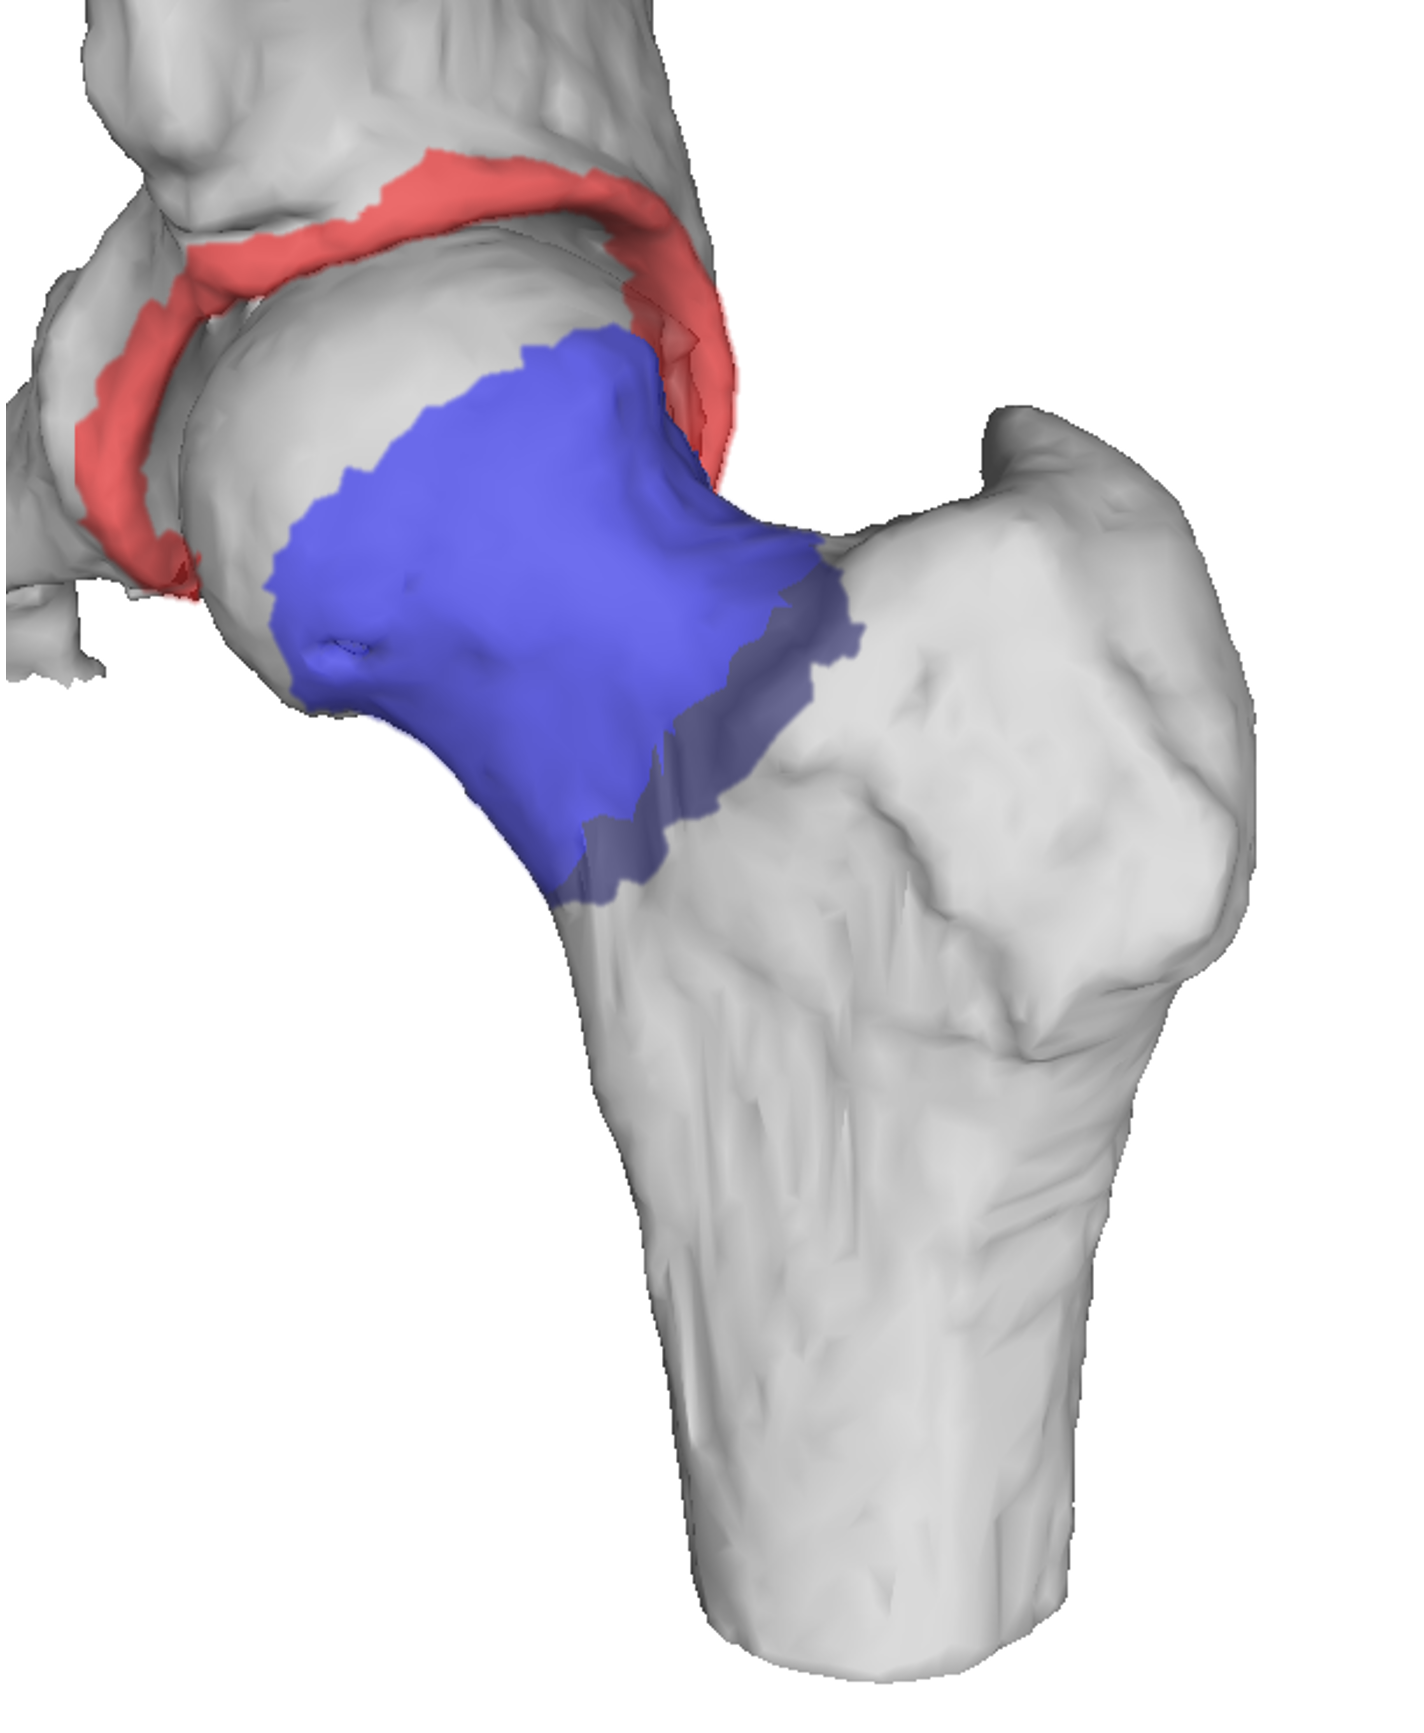
Segmentation of the femur and pelvis were performed using a workflow developed in MeVisLab (MeVis Medical Solutions, AG, Bremen, Germany). Laplacian of Gauss (LoG) filtered ZTE images were inverted and thresholded after which seeded region growing was applied. Morphological hole-filling was used to repair minor discontinuities in the segmentations. Polygonal meshes of the femur and pelvis were generated from which submeshes of the acetabular rim and femoral neck were extracted for simulation. Coordinate systems for femur and pelvis were established after Tannast5 using landmarks selected from the ZTE hip images to establish the anterior pelvic plane. Knee FSE images were used select distal femur landmarks and the femoral head center (center of rotation for the hip joint in this model) was determined by random sample consensus (RANSAC) spherical fit of the femoral mesh.
The pelvis and femur meshes were set to a neutral orientation after which the hip was flexed to 90°. Subsequently, internal rotation (IR) and adduction (ADD) were iteratively applied (0-30°). At each iteration the minimum neck-rim distance, dmin, was calculated. End of range of motion was defined when dmin < ½ MEL, where MEL is the median edge length of the two meshed surfaces.
Results
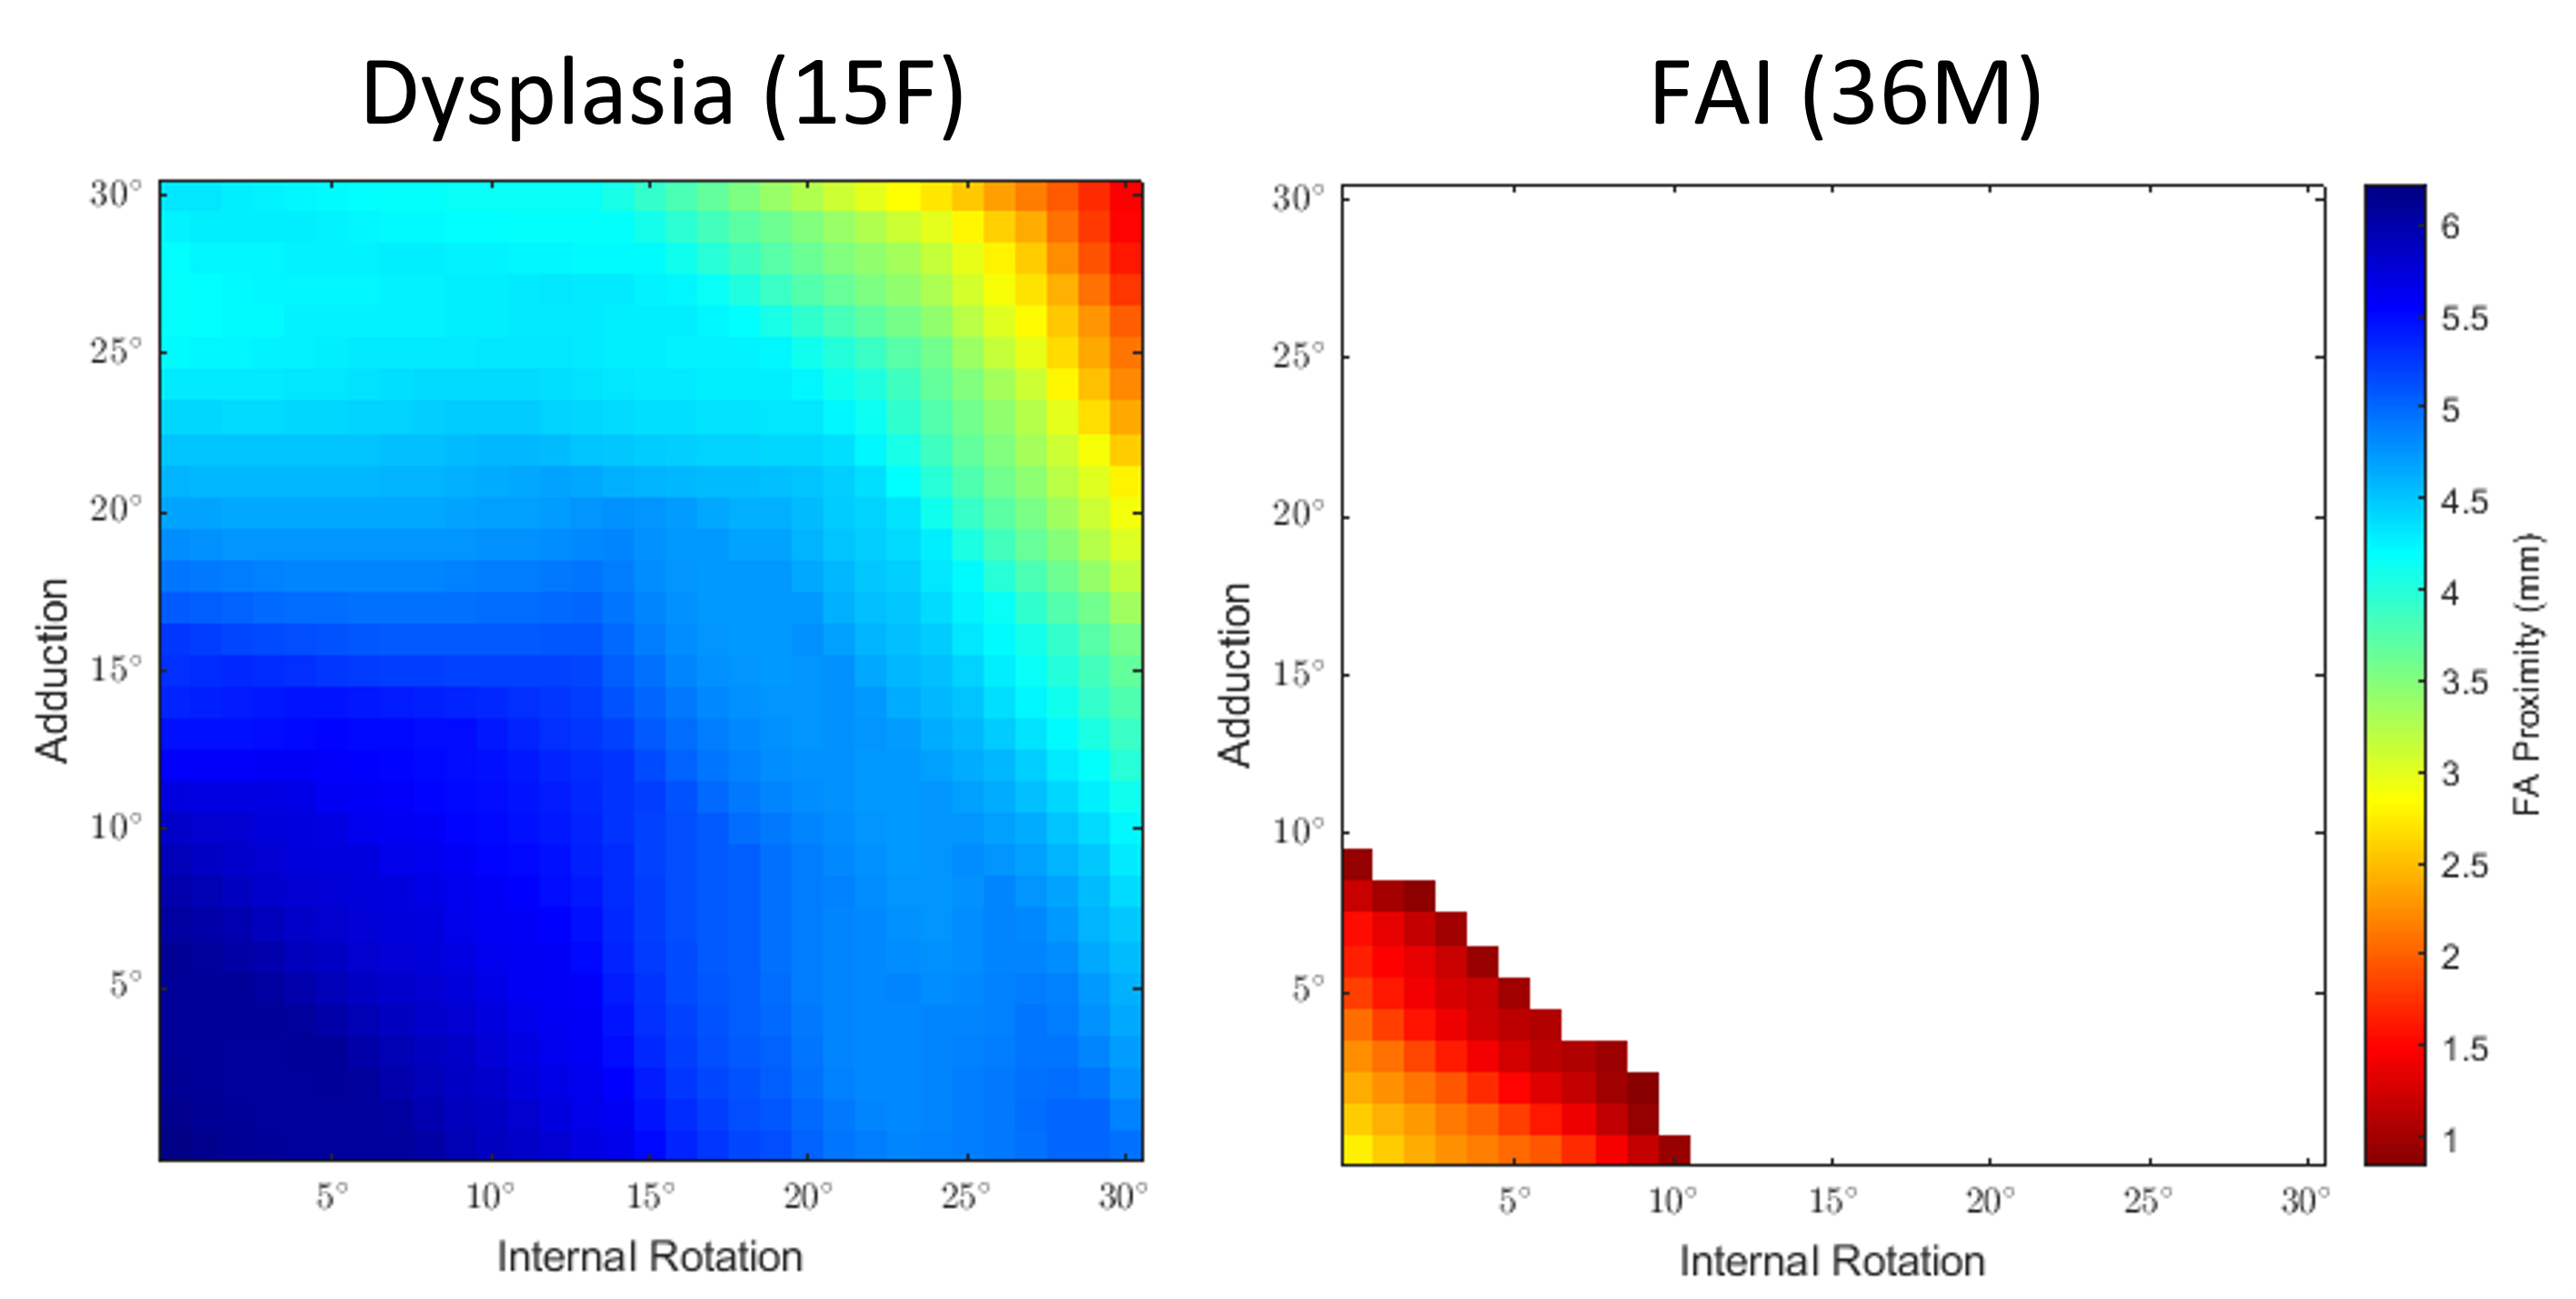
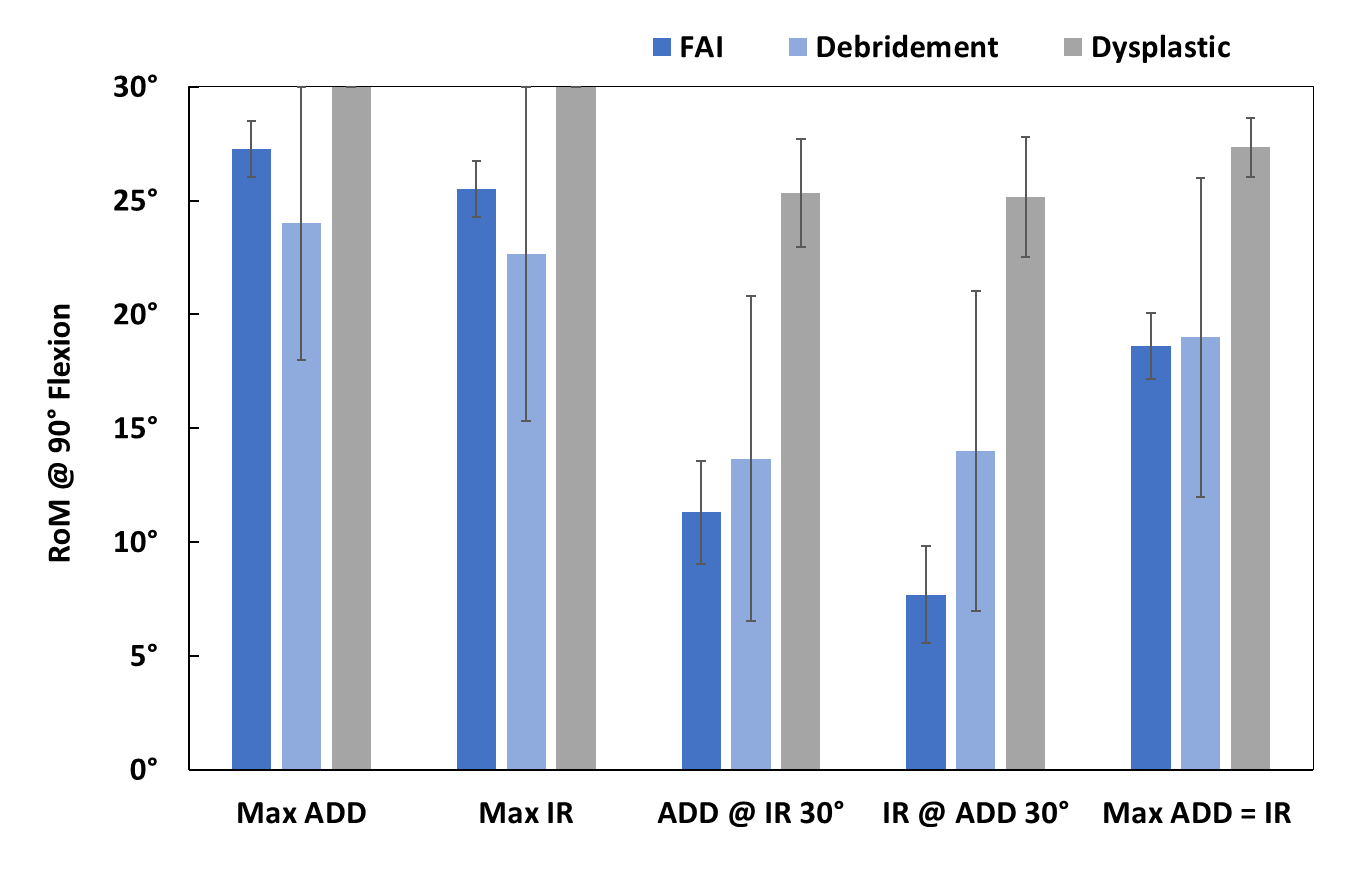
Minimum neck-rim distances (dmin) were plotted throughout the simulated ranges of motion. Figure 3 shows dmin plotted as color at each combination of IR and ADD for a dysplastic patient and one with marked FAI morphology. The white region in the plot for the FAI patient is where osseous impingement would occur. Figure 4 shows the sub-cohort maximum ranges (mean ± SEM) of IR and ADD motion at 90° of flexion for isolated ADD, isolated IR, ADD at 30° IR, IR at 30° ADD, and the maximum where ADD = IR. The maximum ROM where ADD = IR corresponds to the diagonal extent of the colored regions of the ROM plot.Discussion
This study performed in silico simulated FADIR evaluations using patient-specific ZTE MRI-derived bone models. The results of these simulations comport with the patients’ hip conditions. i.e. dysplastic hips exhibit broad ROM, FAI hips exhibit constrained ROM, while debrided hips show improved ROM relative to FAI. Although 2D measurements of FAI morphology are susceptible to differences in patient posture in the scanner, kinematic modeling of FAI eliminates this confounder by standardizing the posture of the hip independent of the acquisition and can evaluate many provocative postures without subjecting the patient to pain. Further, these simulations provide quantitative insight into the severity and location of impingement whereas the physical FADIR test simply provides a binary result for elicited pain.Conclusion
We have previously reported the diagnostic utility of ZTE in assessing 2D measurements of osseous morphology of the hip.4 The present study expands on this by demonstrating the utility of ZTE MRI for the development of 3D models for use in kinematic collision modeling of FAI. As with 2D measurments for morphologic assessment kinematic collision simulation has been possible with CT imaging.5 However, given the ages of typical FAI patients, the anatomy scanned, and the possible need for serial follow-up imaging or subsequent assessment of the contralateral hip, obviation of the need for ionizing radiation to assess FAI is paramount. Lastly, ZTE as an adjunct to SOC MRI for FAI may eliminate the cost and time associated with CT.Acknowledgements
HSS maintains an institutional research agreement with GE Healthcare.References
1. Delso G, Wiesinger F, Sacolick LI, et al. Clinical evaluation of zero-echo-time MR imaging for the segmentation of the skull. J Nucl Med. 2015.
2. Breighner RE, Endo Y, Konin GP, et al. Zero Echo Time Imaging of the Shoulder: Enhanced Osseous Detail Using MRI. Radiology. 2018.
3. Argentieri EC, Koff MF, Breighner RE, et al. Diagnostic Accuracy of Zero-Echo Time MR Imaging for the evaluation of cervical neural foraminal stenosis. Spine. 2017.
4. Breighner RE, Bogner EA, Lee SC, et al. Evaluation of Osseous Morphology of the Hip Using Zero Echo Time Magnetic Resonance Imaging. Am J Sports Med. 2019.
5. Tannast M, Kubiak-Langer M, Langlotz F, et al. Noninvasive three-dimensional assessment of femoroacetabular impingement. J Orthop Res. 2007.
Figures