1405
Comparison of MAPSS- vs UTE-based T1rho Sequences in the Knee
Michael Carl1, Dina Moazamian2, Alecio F. Lombardi2, Amir Masoud Afsahi2, Yajun Ma2, and Jiang Du2
1GE Healthcare, San Diego, CA, United States, 2UCSD, San Diego, CA, United States
1GE Healthcare, San Diego, CA, United States, 2UCSD, San Diego, CA, United States
Synopsis
We compared two different T1rho sequence approaches and assessed their performance for quantitative musculoskeletal imaging. We found that using either a MAPSS or UTE acquisition after T1rho preparation resulted in similar T1rho decay values for tissues of moderate to long T2s (e.g., cartilage or meniscus). The UTE acquisition sequence, however, was also readily able to obtain T1rho decay values for tissues with short T2s (e.g., tendons), thereby facilitating whole knee assessment.
Introduction:
T1rho is a noninvasive biomarker that is sensitive to the dipolar interactions of slow macromolecular motions within proteoglycan. These macromolecular motions are governed by a correlation time tc. In tissues such as cartilage, slow macromolecular tumbling motions have correlation times on the order of ms, which can be partially refocused by spin-locking. Previous studies have suggested that T1rho may therefore be correlated with proteoglycan depletion in osteoarthritis (OA) [1]. Most common T1rho techniques have relied on either gradient-echo or spin-echo acquisition sequences that are geared toward tissues with transverse relaxation times (T2s) of several tens of ms or longer (i.e., “long T2 tissues”). Tissues with short T2s such as tendons have only recently become accessible to direct magnetic resonance (MR) imaging through ultrashort echo time (UTE) sequences [2-4]. Combining UTE sequences with T1rho preparation therefore also allows for the assessment of T1rho value in short T2 tissues. In this study, we implemented a UTE-T1rho sequence for assessment of the major tissue components in knee and compared its performance against MAPSS-T1rho.Methods:
The pulse sequences are shown in Figure 1. After a magnetization reset module (which sets the total magnetization vector to zero) and a fat saturation pulse, the T1rho preparation uses a 90° excitation pulse followed by a spin-lock pulse in the orthogonal direction (along the transverse magnetization vector), then a second 90° pulse to tip the magnetization back to the z-axis. This is then followed by either a gradient-echo (MAPSS) or UTE multi-spoke imaging sequence with varying flip angles. The same k-space line is acquired twice with the radiofrequency (RF) amplitudes shown in red either positive or negative to compensate for T1 recovery during the acquisition train [1]. The resulting T1rho decay parameters within signal regions of interest (ROIs) can then be fitted to a mono-exponential decay. We scanned 4 knee joint specimens (donors between 36 and 70 years of age) on a GE 3T MR750. These knee specimens were frozen at -80° F and thawed for ~30 hours prior to scanning. The pulse sequences shown in Figure 1 were used to scan these specimens at four spin locks times (TSLs) to allow decay curve fitting (see Figure 3). The acquisition parameters were as follows: freq matrix=256, field of view (FOV)=15cm, slice thickness=4mm, number of slices=32, bandwidth=62.5kHz, TE=28µs (UTE), and 2.3ms (MAPSS), magnetization recovery time=150ms, spin-lock amplitude=500Hz, 64 spokes-per-prep, average scan time (for 4 TSLs)=7.5 minutes. The resulting decay curves were then fitted using least-squares fitting in MATLAB.Results and Discussion:
Representative images of both MAPSS- and UTE-based T1rho imaging are shown in Figure 2 with different TSL values. Some of the corresponding decay and fit curves are shown in Figure 3, as well. Table 1 shows the measured T1rho values for several tissues within the knee. For most tissues, including the cartilage, and meniscus, there was reasonable agreement between the MAPSS and UTE imaging acquisitions. However, for short T2 tissues such as the patellar tendon, the UTE acquisition yielded noticeably lower T1rho values, likely due to the pool selections inherent to the MAPSS and UTE imaging acquisitions, where only UTE can access appreciable signals from the short T2 pools that also contribute to lower T1rho values. This can also be seen in Figure 2 where the patellar tendon appears as dark signals for MAPSS even for the lowest TSL values (upper blue arrow), resulting in noisy data points (see Figure 3). In comparison, the UTE based signals inside the patellar tendon are noticeably stronger (lower blue arrow in Figure 2) and result in less noisy ROI signals in Figure 3, demonstrating that UTE-T1rho is a promising tool in assessment of the whole knee.Conclusion
We have examined two T1rho sequences. As expected, we found that using either a T1rho-prepared MAPSS or UTE imaging protocol yielded similar results for longer T2 tissues such as cartilage and meniscus. Significant deviations in T1rho were only observed in short T2 tissues, where UTE showed lower values than an equivalent MAPSS-based scan.Acknowledgements
No acknowledgement found.References
[1] Li et al, Magn Reson Med 2008 59:298–307
[2] Rahmer et al, Magn Reson Med, 2006. 55(5): p.1075-82
[3] Du et al, Magn Reson Imag 2011:29:470–482
[4] Weiger et al, NMR Biomed. 2015 28(2):247-54
Figures
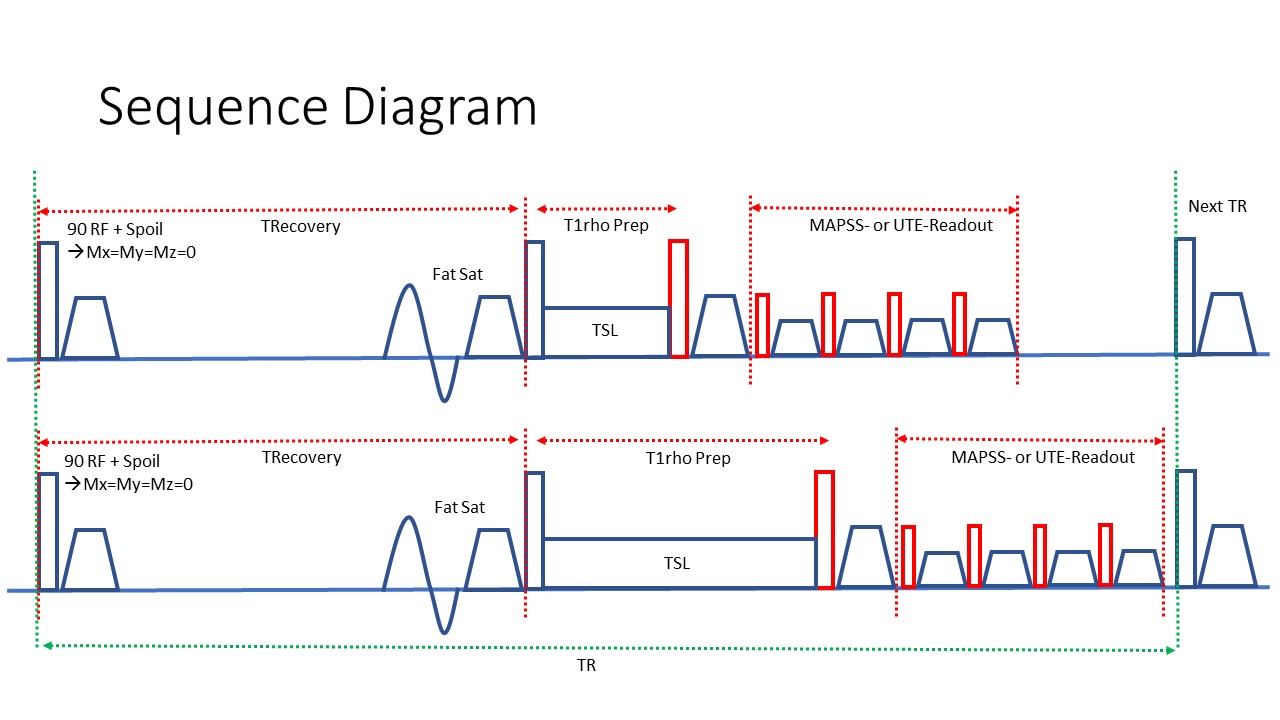
Fig.1:
T1rho-prepared pulse sequence. The first sequence modules are a magnetization
reset pulse and fat saturation pulse. The T1rho preparation module is shown in
the middle with two different TSL durations (top vs. bottom). This is then
followed by a multi-spoke gradient-echo (MAPSS) or UTE imaging sequence.
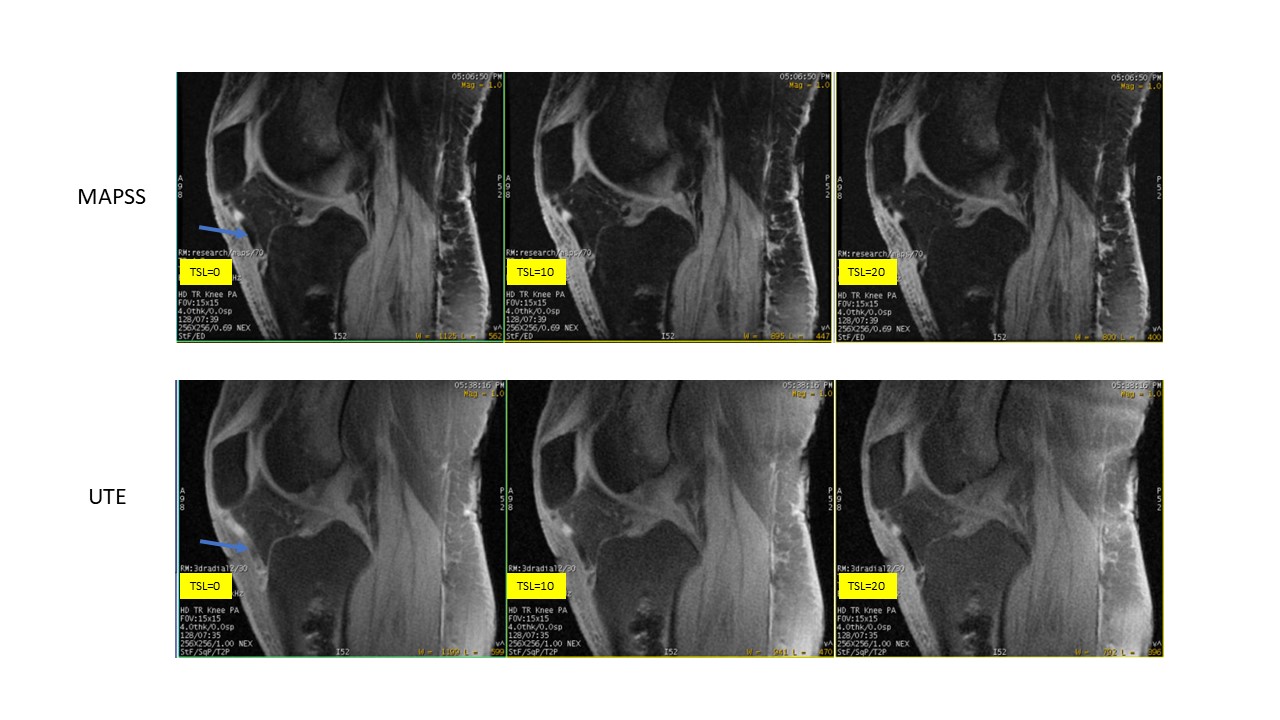
Fig.2:
T1rho-prepared MAPSS (top) and UTE (bottom) images, at different values of TSL.
Note how the UTE images show visibly more signal inside the tendon (blue arrow),
whereas the MAPSS images mainly show dark signal voids.
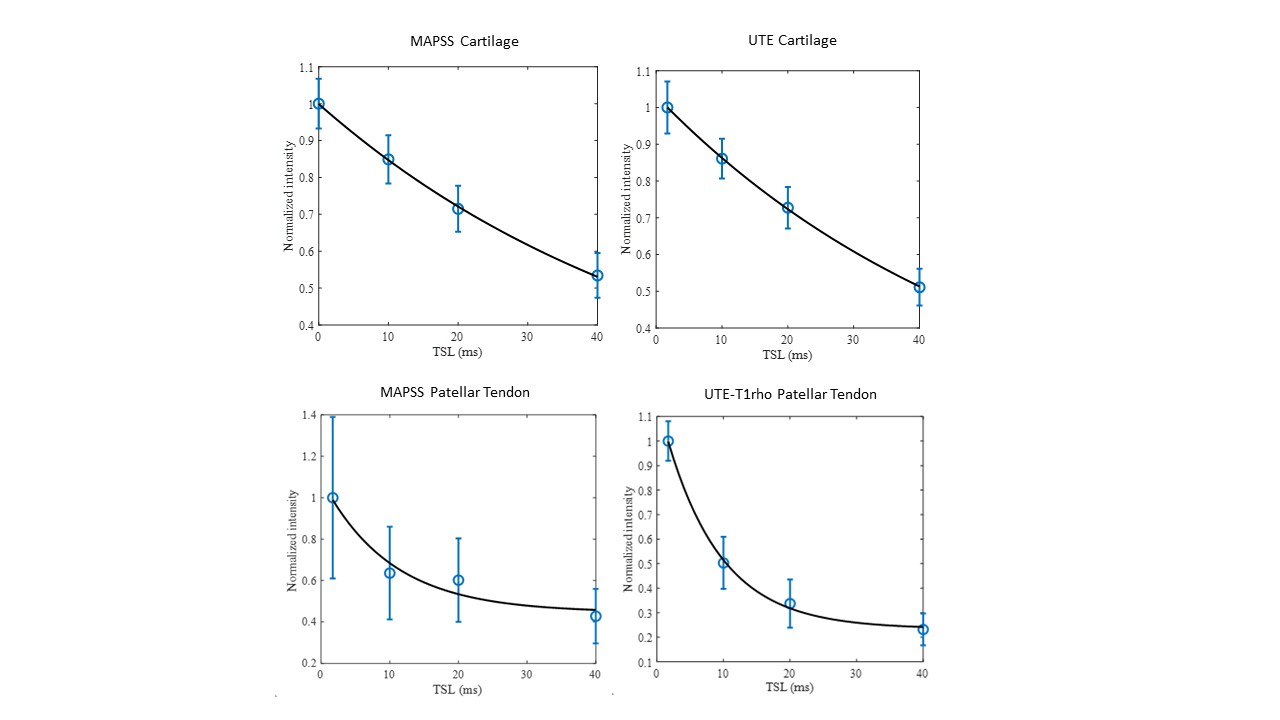
Fig.3:
T1rho decay and fit curves for the images shown in Fig.2. The corresponding
T1rho relaxation values are summarized in Table 1.
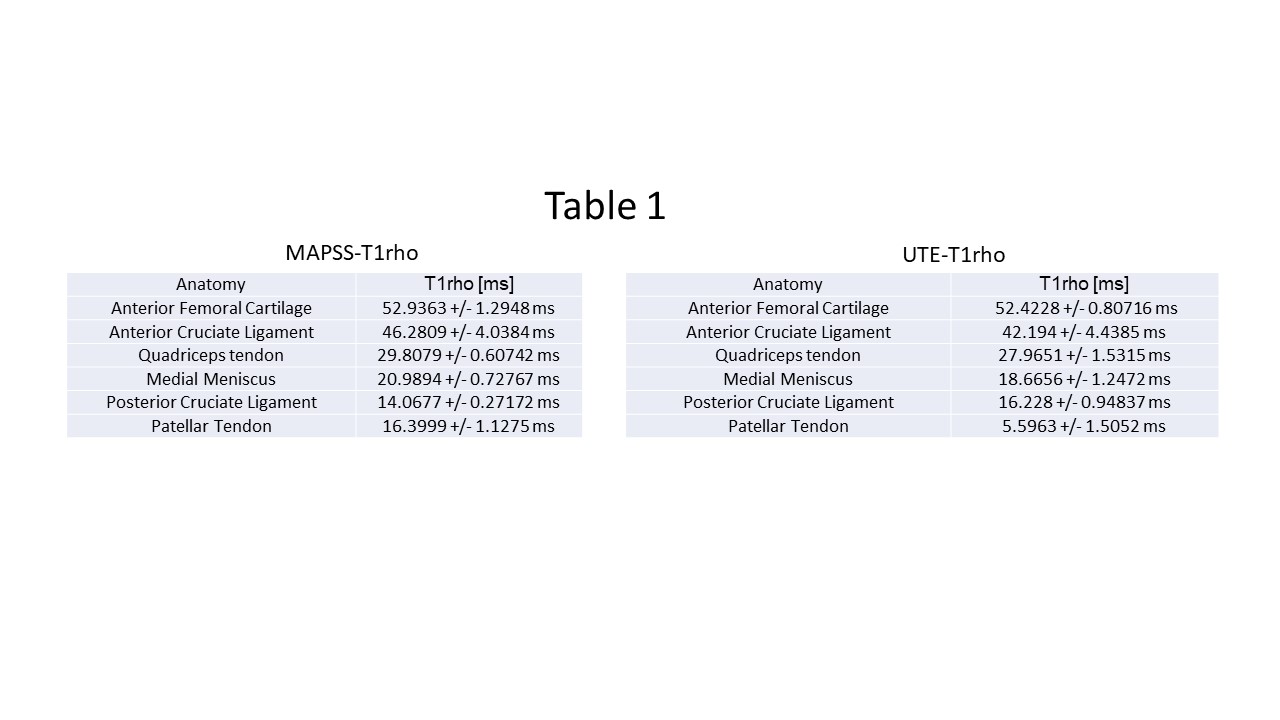
Table.1:
T1rho relaxation values in [ms]. There is reasonable agreement between the
values in cartilage, ligaments, and meniscus between the MAPSS- and UTE-based
acquisitions, whereas the values in short T2 tissues such as patellar tendon
are systematically lower using the UTE-based sequences.
DOI: https://doi.org/10.58530/2022/1405