1404
Joint effusion contrast differences in 2D fat-saturated T2-weighted pulse sequences in 3T and 7T MRI1Siemens Medical Solutions USA, Inc., Urbana, IL, United States, 2Beckman Institute, University of Illinois at Urbana-Champaign, Urbana, IL, United States, 3Stevens Family Clinical Research Institute, Carle Health, Urbana, IL, United States, 4Radiology, Carle Health, Urbana, IL, United States
Synopsis
7T MRI provides excellent resolution of the structures in the knee. Fat-saturated T2-weighted imaging at 7T has been used clinically for assessing knee joint effusion, but may provide different contrast than 3T MRI in cases of acute injury involving suspected blood products in the fluid. Here, we show three cases in which joint effusion due to acute injury had dark contrast in T2-weighted images acquired at 7T. For one case, T2-weighted 3T MRI was acquired in which the effusion appeared bright. These differences illustrate the potential for high field MRI to elucidate pathological components not observable at lower field strength.
Introduction
Musculoskeletal imaging at 7T has gained interest recently thanks to higher signal-to-noise ratio (SNR) at ultra-high field MRI compared to 3T MRI. This gained SNR can be leveraged to obtain higher resolution images, improved contrast, or reduced acquisition time [1]. The higher resolution images obtained at 7T provide better delineation of the tissue types and can show subtle meniscal alterations that would be difficult to resolve at lower field strengths [2].Two-dimensional (2D) fat-saturated (FS) T2-weighted turbo-spin echo pulse sequence has been used routinely at 1.5T and 3T to visualize joint effusion [3,4] and meniscal tears [5] in the knee, and more recently at 7T [1,2]. As compared to imaging at 3T, imaging at 7T generally provides similar and improved contrast in addition to higher resolution using a T2 acquisition technique. However, there may be substantial contrast differences in the joint effusion in cases of acute injury where suspected blood products are present in the synovial fluid. The purpose of this work is to present three such cases where the contrast in the knee effusion in images obtained using 2D FS T2 pulse sequences appear dark in patients with acute injury. For one of these patients, same images acquired at 3T along with CT images are also presented.
Methods
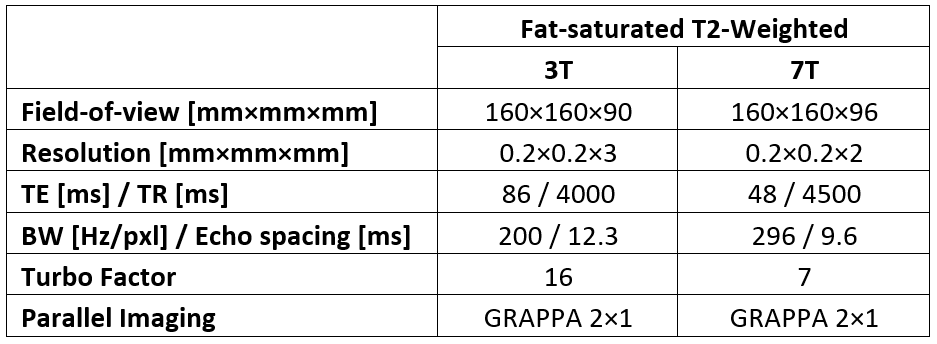
This work is a retrospective analysis of three patients’ deidentified imaging data as a case series and as such was not subject to regulation by the local institutional review board. Imaging was performed on a MAGNETOM Terra 7T system (Siemens Healthcare, Erlangen, Germany) running software version VE12U (n=3) and a MAGNETOM Prisma system (Siemens Healthcare, Erlangen, Germany) running software version VE11E (n=1). All 7T images were acquired using two prototype dielectric pads (Multiwave Imaging, Marseille, France), one positioned at each side of the knee. The CT images (n=1) were acquired on a Discovery CT750 (GE Healthcare, Milwaukee, Wisconsin). All imaging utilized product sequences and was performed as part of the clinical routine without contrast. Typical imaging parameters for the 2D FS T2 acquisition are shown in Table 1.Results
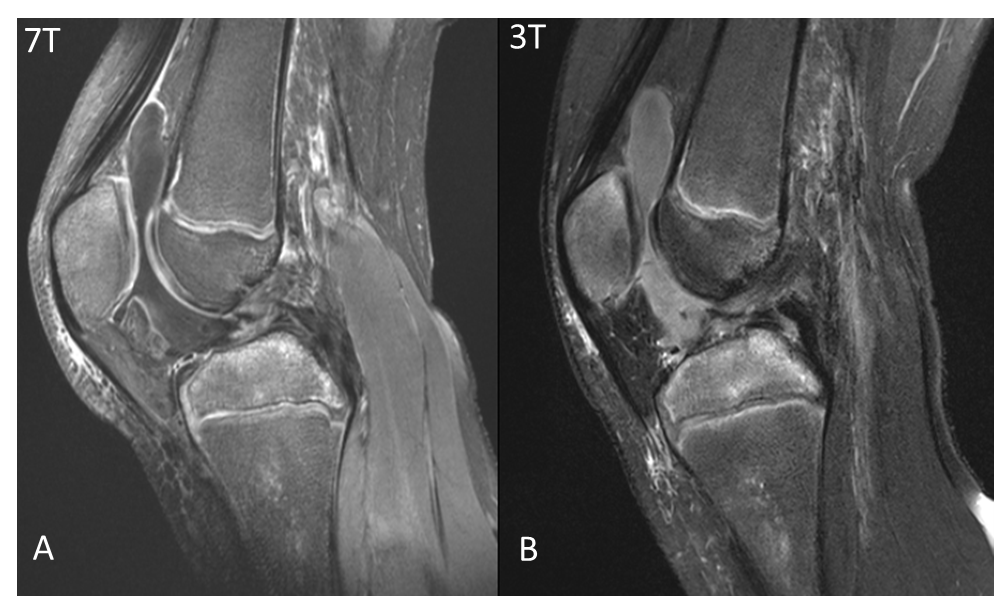
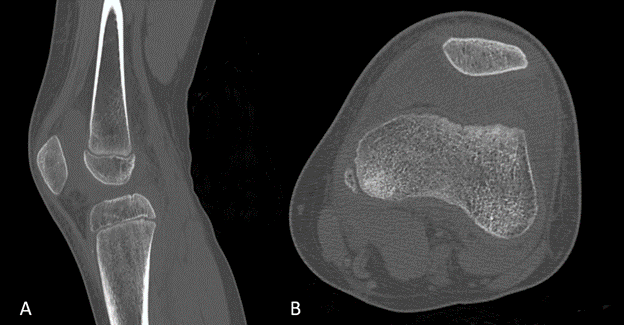
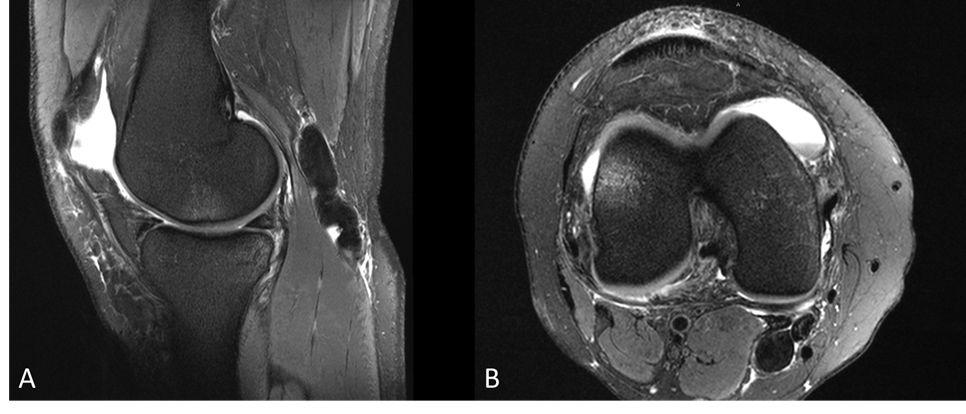
Figure 1 shows one patient’s sagittal 3T and 7T images of the left knee joint effusion, obtained using FS T2 sequences. The synovial fluid appears dark at 7T but bright at 3T. Sagittal and transverse CT images of the same patient are shown in Figure 2, where the radiodensity of the patellofemoral joint space has the range approximately between 40 and 70 Hounsfield Units, suggesting presence of blood in the effusion [6].Figure 3 shows 2D sagittal and transverse FS T2-weighted images of the left knee effusion of a patient with acute injury. The fluid can be seen lateral to the femur continuing into the patellofemoral joint space. The fluid in both sagittal and transverse FS T2 images appear dark at 7T. No 3T FS T2 images were acquired on this patient. It is suspected that blood products exist in the joint effusion, although not confirmed.
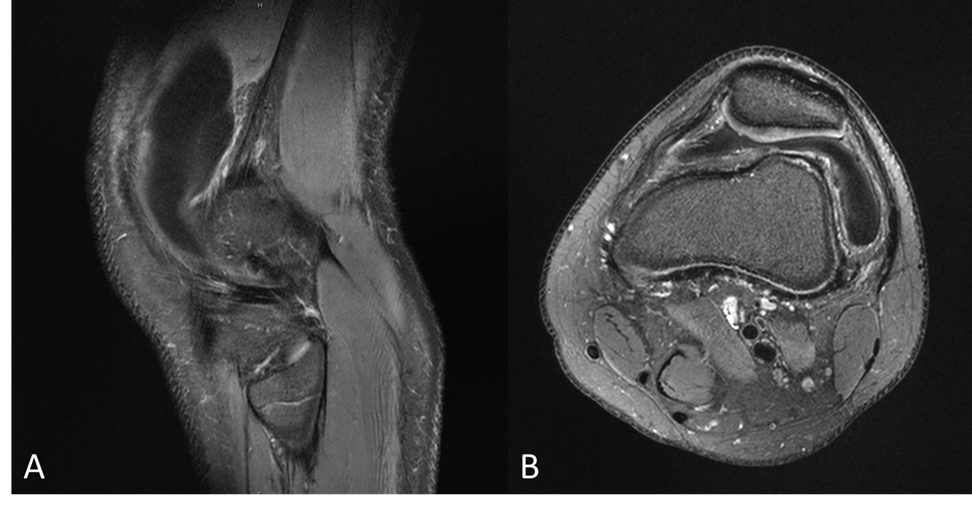
Figure 4 shows sagittal and transverse FS T2 images obtained at 7T of a patient with a joint effusion in the patellofemoral joint space and a popliteal cyst in the posterior medial side. This patient did not undergo a 3T or a CT exam. Note the bright contrast in the joint space fluid and the dark contrast in the popliteal cyst in both sagittal and transverse FS T2 images. In this case, contamination of the cyst fluid with blood products is also suspected, although not confirmed.
Discussion
We report here that substantial contrast differences may be observed between 3T and 7T images obtained using both 2D FS T2 acquisitions in joint effusion arising from acute injury, as suggested by CT imaging results in one patient. The reason for the darker contrast of the fluid as seen on 7T is due to shorter T2* of suspected blood-contaminated fluid compared to fluid without blood products. Since T2* is already shorter at 7T compared to 3T, the additional decrease in signal decay makes it harder to capture the signal at 7T compared to 3T. Decreasing echo time at 7T may capture the blood-contaminated effusion signal to recover the bright contrast in the fluid, but may compromise overall contrast.The darker fluid contrast in the 7T images of the effusion in the presence of suspected blood products may have important ramifications in assessment of meniscal tears. Since meniscus appears dark due to its short T2*, it can easily be differentiated from the fluid in the patellofemoral joint space. However, if the joint effusion also appears dark, it can prove detecting meniscal tears difficult. A limitation of this study is that presence of blood products without joint aspiration cannot be guaranteed.
Conclusion
Observed contrast differences of the patellofemoral joint space effusion in cases of acute injury are reported here between 3T and 7T MRI using a 2D FS T2 TSE pulse sequence. The joint fluid imaged at 3T appears bright but dark at 7T using the same pulse sequences. This contrast difference is suspected to arise from presence of blood products in the fluid. These observations suggest that multi-field strength and multi-modality imaging may be useful in resolving unexpected contrast patterns.Acknowledgements
No acknowledgement found.References
[1] Aringhieri, G., Zampa, V. & Tosetti, M. Musculoskeletal MRI at 7 T: do we need more or is it more than enough?. Eur Radiol Exp 4, 48 (2020). https://doi.org/10.1186/s41747-020-00174-1
[2] Regatte RR, Schweitzer ME (2007) Ultra-high-field MRI of the musculoskeletal system at 7.0T. J Magn Reson Imaging 25:262–269 https://doi.org/10.1002/jmri.20814
[3] Mori S, Kaneda T, Lee K, Kato M, Motohashi J, Ogura I. T2-weighted MRI for the assessment of joint effusion: comparative study of conventional spin-echo and fast spin-echo sequences. Oral Surg Oral Med Oral Pathol Oral Radiol Endod. 2004 Jun;97(6):768-74. doi: 10.1016/j.tripleo.2004.02.074. PMID: 15184862.
[4] Hill CL, Gale DG, Chaisson CE, Skinner K, Kazis L, Gale ME, Felson DT. Knee effusions, popliteal cysts, and synovial thickening: association with knee pain in osteoarthritis. J Rheumatol. 2001 Jun; 28(6):1330-7. PMID: 11409127.
[5] Jee WH, McCauley TR, Kim JM, Jun DJ, Lee YJ, Choi BG, et al. Meniscal tear configurations: categorization with MR imaging. AJR Am J Roentgenol 2003; 180:93–7
[6] F W Wright. Radiology of the Chest and Related Conditions. 2001; 20.17, CRC Press. ISBN 9780415281416.
Figures