1402
Feasibility of phase resolved functional lung imaging (PREFUL) with ultrashort echo time sequence (PUTE)
1Institute of Diagnostic and Interventional Radiology, Hannover Medical School, Hannover, Germany, 2Biomedical Research in Endstage and Obstructive Lung Disease Hannover (BREATH), German Center for Lung Research (DZL), Hannover, Germany
Synopsis
Phase-resolved Functional Lung imaging (PREFUL) allows the contrast-free quantification of pulmonary ventilation and perfusion dynamics in free breathing. Typically, it is used in conjunction with cartesian spoiled gradient echo sequence (SPGRE) with asymmetric echo. Due to the short T2* times in lung tissue, acquiring signal with echo times as low as possible is essential. Therefore, a 2D ultrashort echo time sequence with a TE of 0.07ms was developed and tested in the PREFUL context in one healthy volunteer. A similar visual impression of derived ventilation maps was found with UTE and SPGRE. However, ventilation defects were more pronounced for UTE.
Introduction
Phase resolved functional lung (PREFUL) MRI is a free breathing contrast agent free 1H lung MRI postprocessing technique1. It is based on the reconstruction of one respiratory and cardiac cycle to gain dynamic ventilation and perfusion information from one data set2–4. Until now PREFUL was only performed on data acquired with gradient echo sequences with Cartesian readouts and echo times >0.6ms. Due to short T2* times in lung tissue, sequences with ultrashort echo times (UTE) are desirable to gain as much signal as possible. Previously, the feasibility of lung imaging with UTE sequences was demonstrated5,6. Therefore, a combination of PREFUL with a 2D ultrashort echo time sequence (PUTE) was developed. As a first feasibility check ventilation parameters of one healthy volunteer were evaluated and compared to PREFUL derived from a spoiled gradient echo sequence (SPGRE).Methods
A 2D UTE sequence was developed according to Triphan et al6. For slice excitation, sinc half pulses (duration of 1280ms) were used. To minimize the echo time (TE), a radial center out readout together with ramp sampling was performed, achieving a TE of 0.07ms. Figure 1 shows the sequence diagram. To compensate image artifacts generated by deviations from the desired k-space trajectory, the actual k-space trajectory was measured as suggested by Duyn et al7. Gradient delays were measured as described by Herrmann et al8 and taken into consideration during image reconstruction. The acquired spokes were sorted according to their respiratory phase and dynamic image reconstruction of one respiratory cycle was performed using the Berkeley Advanced Reconstruction Toolbox (BART)9.UTE data of three coronal slices (dorsal, central and ventral of the carina) of one healthy subject (female, age 24 years) were acquired with the following sequence parameters: TR 2.3ms, TE 0.07ms, FoV 500 x 500mm2, in plane resolution 2.8mm2, slice thickness 12.5mm. The acquisition was performed with 60320 spokes in free breathing, resulting in a total measurement time of 4min 43s for each slice.
Further, for comparison, the same acquisition was repeated with SPGRE during the same imaging session with the following parameters: TR 3ms, TE 0.82ms, FoV 500 x 500mm2, in plane resolution 3.9mm2, slice thickness 12.5mm. The acquisition was performed in free breathing and the total measurement time of one slice was 99s.
For PUTE, two image datasets were reconstructed from the acquired data: one using all spokes (PUTEall) and one matching the acquisition time of the SPGRE scan (21101 spokes for 99s) (PUTE99).
The acquired UTE and SPGRE data were evaluated with PREFUL. Regional ventilation (RV) maps10, regional flow volume loop cross correlation (FVL-CC) maps11,12, ventilation defect percentage (VDP) maps derived from RV and FVL-CC and the dynamic respiratory cycle were visually compared. Signal to noise ratio (SNR) and image sharpness was calculated for UTE and SPGRE images.
Results
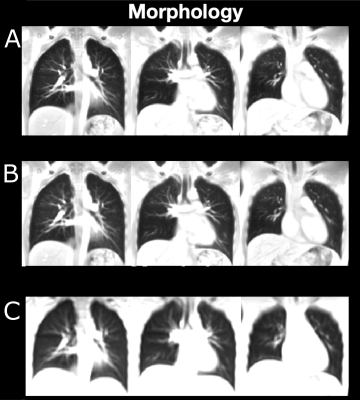
For SPGRE and PUTE, the dynamic respiratory cycles showed a homogeneous ventilation for all slices. An exemplary dynamic respiratory cycle of the central slice derived from PUTEall is shown in Figure 2.In Figures 3 morphological images of SPGRE and UTE are shown. Morphological images derived by UTE show a higher image sharpness in comparison to SPGRE acquisition (SPGRE 23.1/9.1/13.5; UTE99: 41.0/13.3/25.0; UTEall: 43.7/15.1/26.8 (dorsal/central/ventral)). For SPGRE a SNR of 23.95, for UTE99 a SNR of 12.79 and for UTEall a SNR of 19.04 was found.
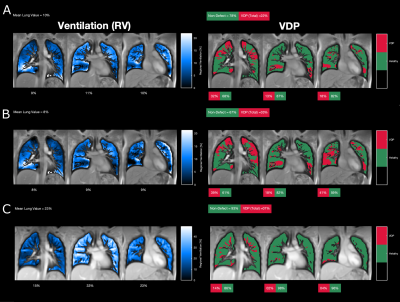
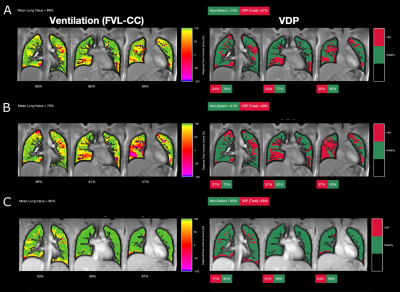
Figures 4 and 5 show the RV and FVL-CC maps and the corresponding VDP maps for PUTE and SPGRE. A similar visual impression is given for SPGRE and PUTE. However, regions with low ventilation are more pronounced for both PUTE datasets compared to SPGRE and even more pronounced for PUTE99. Comparing VDP maps, ventilation defects are located in the same areas.
Discussion
We could show the feasibility of combining the PREFUL post-processing with UTE acquisition (PUTE) and found a good first visual agreement with ventilation maps derived from SPGRE acquisition. Lower SNR values of UTE can be explained by the higher spatial resolution of UTE and the different TE times (factor ~ 2.7 lower SNR for UTE; corrected SNR: UTE99: 34.7, UTEall: 51.7).Despite the initial promising results, PUTE is still in an ongoing development and dealing with some limitations. We only acquired data of one healthy subject. Therefore, no statistical analysis can be performed at this point and PREFUL settings and thresholds could not be adjusted for PUTE. Nevertheless, this has to be done in the future. Especially for calculation of VDP maps an optimal threshold is essential. However, to determine this threshold and other settings data from more healthy subjects and patients with different lung diseases are necessary.
In addition, determination of the respiration phase from the acquired data is an important step during postprocessing. Deviations from a regular breathing rhythm might be challenging, especially in patients, and need further considerations.
Besides further data acquisition and evaluation, sequence parameters regarding resolution shall be improved. Moreover, generation of dynamic perfusion parameters is of interest for future development.
Conclusion
We could show the feasibility of combining the PREFUL post-processing with 2D UTE with promising results. However, further development of the sequence and adjustment of PREFUL postprocessing for PUTE has still to be done.Acknowledgements
The authors would like to thank Melanie Pfeifer and Frank Schröder for outstanding technical assistance in performing the MRI measurement.References
1. Voskrebenzev A, Gutberlet M, Klimeš F, et al. Feasibility of quantitative regional ventilation and perfusion mapping with phase-resolved functional lung (PREFUL) MRI in healthy volunteers and COPD, CTEPH, and CF patients. Magn Reson Med 2018; 79: 2306–2314.
2. Glandorf J, Klimeš F, Voskrebenzev A, et al. Comparison of phase-resolved functional lung (PREFUL) MRI derived perfusion and ventilation parameters at 1.5T and 3T in healthy volunteers. PLoS One 2020; 15: e0244638.
3. Klimeš F, Voskrebenzev A, Gutberlet M, et al. 3D phase-resolved functional lung ventilation MR imaging in healthy volunteers and patients with chronic pulmonary disease. Magn Reson Med 2021; 85: 912–925.
4. Behrendt L, Voskrebenzev A, Klimeš F, et al. Validation of Automated Perfusion‐Weighted Phase‐Resolved Functional Lung (PREFUL)‐MRI in Patients With Pulmonary Diseases. J Magn Reson Imaging 2020; 52: 103–114.
5. Balasch A, Metze P, Stumpf K, et al. 2D Ultrashort Echo-Time Functional Lung Imaging. J Magn Reson Imaging 2020; 52: 1637–1644.
6. Triphan SMF, Breuer FA, Gensler D, et al. Oxygen enhanced lung MRI by simultaneous measurement of T1 and T2∗ during free breathing using ultrashort TE. J Magn Reson Imaging 2015; 41: 1708–1714.
7. Duyn JH, Yang Y, Frank JA, et al. Simple Correction Method for k-Space Trajectory Deviations in MRI. Journal of Magnetic Resonance 1998; 132: 150–153.
8. Herrmann KH, Krämer M, Reichenbach JR. Time efficient 3D radial UTE sampling with fully automatic delay compensation on a clinical 3T MR scanner. PLoS One; 11. Epub ahead of print 1 March 2016. DOI: 10.1371/journal.pone.0150371.
9. Uecker M, Ong F, Tamir J, et al. Berkeley Advanced Reconstruction Toolbox. In: Proc. Intl. Soc. Mag. reson. Med. 23. 2015, p. 2486.
10. Klimeš F, Voskrebenzev A, Gutberlet M, et al. Free‐breathing quantification of regional ventilation derived by phase‐resolved functional lung (PREFUL) MRI. NMR Biomed 2019; 32: e4088.
11. Kaireit TF, Kern A, Voskrebenzev A, et al. Flow Volume Loop and Regional Ventilation Assessment Using Phase-Resolved Functional Lung (PREFUL) MRI: Comparison With 129Xenon Ventilation MRI and Lung Function Testing. J Magn Reson Imaging 2021; 53: 1092–1105.
12. Moher Alsady T, Voskrebenzev A, Greer M, et al. MRI-derived regional flow-volume loop parameters detect early-stage chronic lung allograft dysfunction. J Magn Reson Imaging 2019; 50: 1873–1882.
Figures

Figure 1: Sequence diagram of the 2D PREFUL compatible ultrashort echo time sequence. A sinc half pulse is used for excitation followed by a radial readout starting in k-space center. Only the area marked in red of the slice selection gradient has to be rephased before the readout can start.

Figure 2: Reconstructed dynamic ventilation cycle of the PUTEall data from the healthy subject (female, age 24 years). As expected, the peak ventilation is reached during inspiration homogeneously in the lung parenchyma.

Figure 3: Morphological images of the healthy subject (female, age 24 years). A: Data acquired by UTEall. B: Data acquired by UTE99. C: Data acquired by SPGRE.

Figure 4: Regional ventilation (RV) maps of the healthy subject (female, age 24 years) and the corresponding ventilation defect percentage (VDP) maps derived from A: PUTEall, B: PUTE99 and C: SPGRE.

Figure 5: Flow volume loop cross correlation (FVL-CC) maps of the healthy subject (female, age 24 years) and the corresponding ventilation defect percentage (VDP) maps derived from A: PUTEall, B: PUTE99 and C: SPGRE.