1400
Introducing a correction method for XTC imaging to isolate exchange by compartment1University of Pennsylvania, Philadelphia, PA, United States
Synopsis
HP-Xe Xenon Transfer Contrast (XTC) imaging produces exchange maps between gas (GP) and red blood cell (RBC) and tissue plasma (TP). However, it is difficult to separate the effects of exchange between RBC or TP due to unintended depolarization by the saturation pulse. We introduce a correction method to isolate exchange due to either compartment. The correction method measures depolarization due to saturation at a distance Δ, —the separation between the DP resonances—away from the compartment’s resonance frequency. The corrected maps generated here show that greater correction is needed for discrete pulses and higher power pulses.
Introduction
Xenon Transfer Contrast (XTC) imaging uses hyperpolarized Xe-129 to produce maps of exchange between gas-phase (GP) and dissolved-phase (DP) Xe, providing an alternative to directly imaging at the dissolved-phase resonance, which often suffers from low signal-to-noise ratios (SNR). A drawback to the XTC technique, however, is that it can be difficult to separate the effects of exchange between gas phase (GP) and red blood cell (RBC) or tissue-plasma (TP), as saturation pulses used to depolarize a particular DP compartment often unintentionally affect both RBC and TP resonances, especially at higher powers. Here, we introduce a correction method to compartmentally isolate exchange while accounting for the depolarization contributed by the opposing compartment.Methods
XTC images were obtained in 4 healthy Sprague-Dawley rats ventilated with a mixture of 70% hyperpolarized xenon, 30% oxygen. Enriched Xe-129 gas was polarized (approximately 40%) using a prototype commercial optical pumping system (Xemed, NH) and dispensed into 1.25 L Tedlar bags within pressurizable chambers. All imaging studies was performed on a horizontal-bore 3T scanner (Bruker Inc, MA) and approved by the Institutional Animal Care and Use Committee. Upon placement inside the magnet, rats were ventilated with 70% N2 and 30% O2 at 53 breaths per minute (bpm). N2 was switched to Xe after localization and spatial adjustment.A global NSPECT sequence was first applied over a breath-hold to identify the relevant chemical shifts in Hz. The distance between RBC (213 ppm) and TP (199 ppm) dissolved-phase peaks is defined as Δ, in Hz. Rats were then administered five 1.2 s breath-holds at end-exhale, with two wash-in breaths in-between. A customized FLASH sequence was applied at each breath-hold, a pre-saturation GP image was acquired (FA = 5.7, TR/TE = 10.2/2.4 ms, BW = 10kHz), a block pulse then saturated at a frequency, fD, and a final post-saturation GP image was acquired (FA = 7.4). Five different fD values were used: TP, RBC, RBC + Δ, TP - Δ , and -TP to serve as a control.
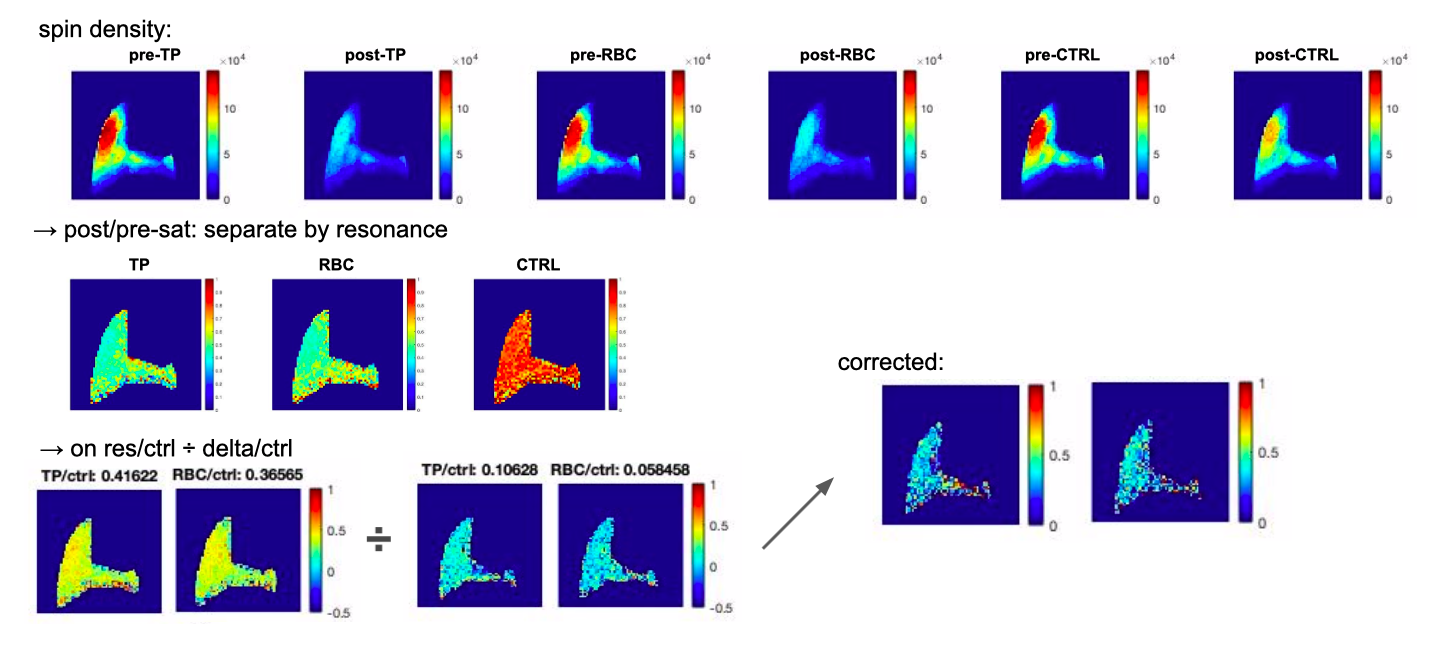
Post-/pre- saturation ratios were calculated for each voxel as:
$$R = \left[1 - \frac{S_{1}}{S_{0}} * \frac{sin(FA_{1})}{sin(FA_{2})} * cos(FA_{1}) cos(FA_{1})\right] *100$$
where S0 and S1 are signals from pre- and post-saturation images, respectively. Ratio maps were generated for every fD. Each map was first divided by the map obtained at fD = -TP to account for RF-induced magnetization loss and T1, then divided by its corresponding fD to account for compromised selectivity. Depolarization ratios at each voxel are calculated as:
$$d = \frac{R_{TP}}{R_{-TP}} / \frac{R_{TP-Δ}}{R_{-TP}}$$
Results/Discussion
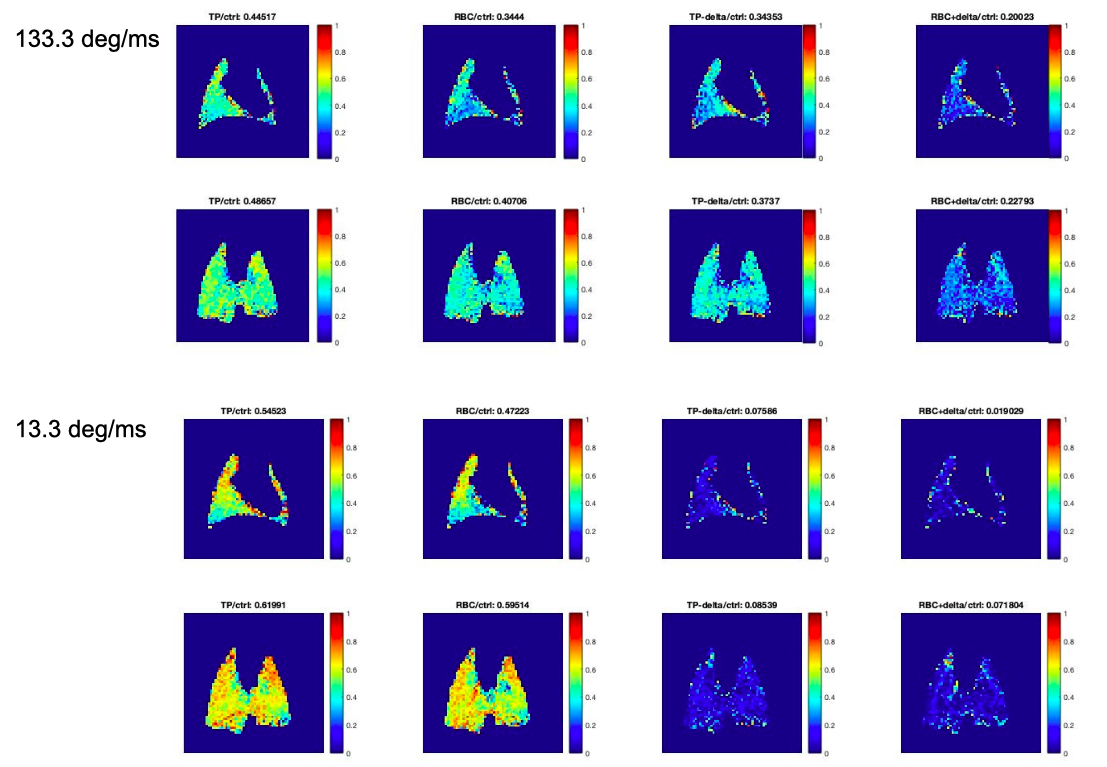
Figure 1 shows a schematic for processing the images into finalized depolarization maps. Starting with the initial spin-density maps, images are first separated into pre-/post-saturation ratio maps; ratio maps are then divided over the control ratio maps (-TP); finally, RBC and TP maps are divided by their respective maps to produce the corrected images.Figure 2 displays ratio maps generated at each fD after taking the appropriate ratios: for saturation at TP, RBC, TP - Δ and RBC + Δ. Maps are displayed for saturation pulses of 13.33 deg/ms and 133.33 deg/ms, acquired with an FA of 10k at 750 ms and 75 ms, respectively. Notably, depolarizations at resonances are higher for higher-power saturation pulses, increasing the disparity between corrected and raw depolarization maps and suggesting that more powerful pulses offer less selective saturation.
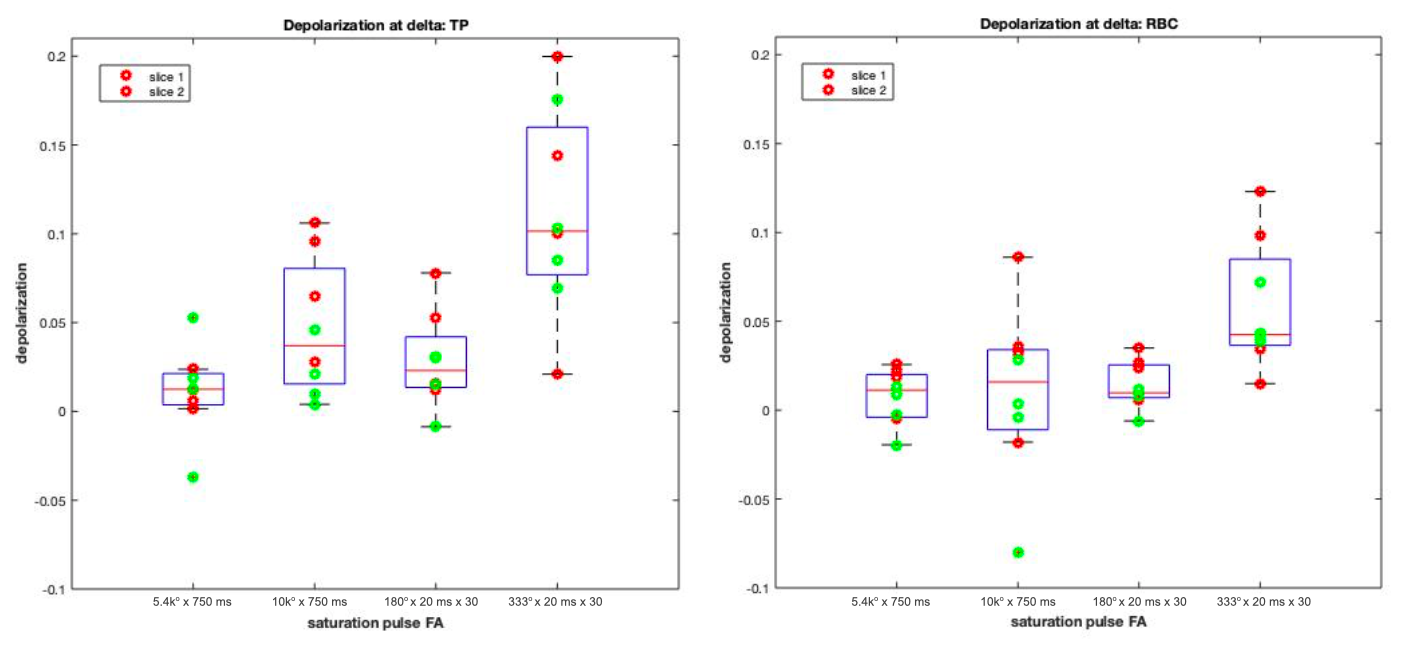
Figure 3 displays scattered box plots of depolarization ratios due to saturation at delta frequencies (TP - Δ and RBC + Δ) across various saturation parameters: continuous block pulses of FA 10k over 750 ms, 5.4k over 750 ms, and discrete8 ms gaussian pulses at FWHM, FA 180 and FA 333. Figure 3A displays the trends due to saturation at TP - Δ, while Figure 3B shows the trends due to saturation at RBC + Δ. Although distribution varies, the generally apparent trend is that, between the continuous pulses, FA 5.4k causes less depolarization compared to 10k, and that FA 180 causes less depolarization than FA 333 for discrete pulses. This behavior suggests that correction is more important at higher power saturations. The disparity between discrete and continuous pulses also suggests that correction is more important for discrete pulses.
Figure 4 shows TP depolarization maps and the relevant corrected maps for a representative figure at a range of saturation schemes – continuous pulses at FA/duration: 10k/750 ms, 10k/75 ms, 5.4k/750 ms, and discrete pulses at # pulses/FA/duration at FWHM: 30/180 deg/20 ms and 30/333/20 ms. These comparisons demonstrate a greater disparity between corrected and initial depolarization maps when using saturation pulses of higher average powers. At extremely high powers, 10k/75 ms, the correction to TP becomes less reliable as these powers may kill RBC signal before exchange occurs.
Conclusion
The correction method presented here accounts for depolarization due to saturation outside the compartment of interest in order to distinguish between the effects of exchange due to RBC and TP, respectively. This method measures depolarization due to saturation at a distance Δ, —the separation between the DP resonances—away from the compartment’s resonance frequency. The corrected maps generated here show that greater correction is needed for discrete pulses than continuous pulses for the same average flip angle, as well as for larger saturation powers.Acknowledgements
No acknowledgement found.References
[1] Muradyan I, Butler JP, Dabaghyan M, et al. Single-breath xenon polarization transfer contrast (SB-XTC): implementation and initial results in healthy humans. J Magn Reson Imaging. 2013;37(2):457-470.
[2] Amzajerdian F, Ruppert K, Hamedani H, Baron R, Xin Y, Loza L, Achekzai T, Duncan IF, Qian Y, Pourfathi M, Kadlecek S, Rizi RR. Measuring pulmonary gas exchange using compartment-selective xenon-polarization transfer contrast (XTC) MRI. Magn Reson Med. 2021 May
[3] Zhou X, Graziani D, Pines A. Hyperpolarized xenon NMR and MRI signal amplification by gas extraction. Proceedings of the Nat. Acad. of Sci. 106 (40) 16903-16906. 2009 Oct.
[4] Ruppert K, Mata JF, Wang HT, Tobias WA, Cates GD, Brookeman JR, Hagspiel KD, Mugler JP 3rd. XTC MRI: sensitivity improvement through parameter optimization. Magn Reson Med. 2007 Jun;57(6):1099-109.
Figures