1399
Variation of Proton Lung Signal with Ventilation at 3T1Sir Peter Mansfield Imaging Centre, University of Nottingham, Nottingham, United Kingdom, 2The Nottingham Biomedical Research Centre (BRC), Respiratory Medicine Dept, School of Medicine, University of Nottingham, Nottingham, United Kingdom
Synopsis
The nature of MR signal variations during healthy ventilation at 3T were explored in 8 healthy participants. Fourier decomposition (FD) techniques were used to remove cardiac signal contributions, and the phase, correlation coefficient and gradient of the parenchyma signal with respect to diaphragm signal were found. This analysis showed that for some voxels, the relationship between parenchyma signal and diaphragm signal is distinctly non-linear. Also, that breathing pattern is an important confounding factor when using the diaphragmatic movement as a surrogate for the change in lung volume, where an additional measure such as a separate 3D acquisition may prove beneficial.
Introduction
Recent work using quantitative proton MRI to obtain functional information about the lungs has led to several methods of analysing dynamically acquired, free-breathing image series, including Fourier decomposition (FD)-MRI1, SElf-gated Non-Contrast-Enhanced FUnctional Lung imaging (SENCEFUL)2 and phase resolved functional lung imaging (PREFUL)3. These methods generally assume a linear relationship between lung volume and MR signal intensity from the lung parenchyma, and they often assume that the fractional increase in lung volume on inspiration is constant within and between individuals.This study aimed to investigate the nature of the signal variations that occur at 3T in the lung parenchyma during the respiratory cycle.
Methods
8 healthy participants were recruited to undergo non-contrast enhanced proton MRI on a 3T Philips Ingenia scanner. A dynamic image series of a single coronal slice placed just posterior to the heart (~1cm) was collected using a 2D Fast Field Echo (FFE) acquisition (TE= 0.57/1.9 ms, α = 18°, temporal resolution = 4.37 images/second) during free breathing. 512 images were collected in a scan duration of 117 s. The MRI signals were scaled by the receiver gain.Image analysis was performed using custom-written scripts in MATLAB. First, diaphragm signal and aorta signal time series were generated by averaging the signal inside manually segmented regions of interest (ROIs) spanning the diaphragm and the aorta (as in FD/PREFUL) . Secondly, low or high pass filtering was applied to the diaphragm and aorta time series respectively; the respiratory and cardiac frequencies were then determined from Fourier analysis of these signals.
The lung image series was registered to a mid-ventilation image, and was masked by seeded region growing4 . The cardiac contribution to the signal in the parenchyma was removed by (i) Fourier transforming the signal time courses of each parenchyma voxel and masking out voxels with high power at the cardiac frequency; (ii) applying a Notch filter at the cardiac frequency to the signal time courses of the remaining parenchyma voxels. The phase of the respiratory parenchyma signal was then computed from the Fourier spectrum at the respiratory frequency (referenced to the diaphragm signal phase). Finally, the correlation coefficient and gradient of linear fit between the parenchyma signal to the diaphragm signal (normalized by the maximum range of this signal) were found, and histograms calculated.
Results
Figure 1a shows an example map of the phase of the Fourier transform of the parenchyma signal at the respiratory frequency, and the correlation coefficient and gradient of the voxel wise linear fit of the parenchyma signal to the diaphragm signal, along with its associated histogram.Figure 2 shows a scatter plot of the phase of the respiratory component of the parenchyma signal against the correlation coefficient.
Figure 3 shows scatter plots of diaphragm signal against parenchyma signal for five voxels with a range of correlation coefficients, for one subject.
Figure 4 shows correlation coefficient and gradient histograms for all healthy subjects.
Discussion
This work has explored the signal changes in the lung during healthy ventilation at 3T. The maps indicate regions of high signal change (both positive and negatively correlated) often arise close to the edge of the lungs or vessels, despite major vessels having been masked out by the Fourier analysis.The correlation coefficient histograms take into account of all the data in the time series, rather than being driven by signals acquired at peak inspiration or expiration as with fractional ventilation measures. They are quite consistent in shape amongst this small group of healthy subjects, suggesting that this measure may provide an alternative measure of lung function more directly related to the MR signal.
The voxel wise plots (Figure 3) show that although there is a linear relationship between parenchyma signal and diaphragm signal for some voxels, the relationship is distinctly non-linear in other regions. In some cases this suggests areas where the MR signal becomes saturated to change on respiration, for instance due to T2* signal losses5 or on expiration possibly due to vessels, connective tissue or congestion. The nature of these non-linearities needs further exploration, for instance using different voxel sizes and field strengths.
A major problem of using the diaphragm signal as a measure of respiration3,4 is that if a subject takes shallow or deep breaths during the cycle this will cause the change in MR signal during respiration to be under/over estimated. This is evident in the histogram of the gradients which have different ranges, probably due to differences in the effective range of the normalized diaphragm signal. To overcome this and allow the absolute change in signal with lung volume to be compared between individuals, the diaphragm signal should be linked directly to the change in lung volume, via a separate 3D acquisition or via MR compatible spirometry. However the correlation coefficient histograms shown in Figure 4 are insensitive to this effect.
Figure 2 confirms that voxels with high correlation coefficients are generally either in phase or out of phase with the diaphragm signal. It is interesting that so many voxels are out of phase and show negative correlation coefficients, and we are exploring whether this it is an artefact of registration or compression of vessels during respiration.
Acknowledgements
No acknowledgement found.References
1. Grzegorz Bauman et al. Non-contrast-enhanced perfusion and ventilation assessment of the human lung by means of Fourier decomposition in proton MRI. Magnetic Resonance in Medicine, vol. 62, no. 3, pp. 656–664 (2009)
2. André Fischer et al. SElf-gated Non-Contrast-Enhanced FUnctional Lung imaging (SENCEFUL) using a quasi-random fast low-angle shot (FLASH) sequence and proton MRI. NMR in Biomedicine, vol. 27, no. 8, pp. 907–917 (2014)
3. Andreas Voskrebenzev et al. Feasibility of Quantitative Regional Ventilation and Perfusion Mapping with Phase-Resolved Functional Lung (PREFUL) MRI in Healthy Volunteers and COPD, CTEPH, and CF Patients. Magnetic Resonance in Medicine, vol. 79, no. 4, pp. 2306–2314 (2018)
4. Couch, M. J et al. Comparison of Functional Free-Breathing Pulmonary 1H and Hyperpolarized 129Xe Magnetic Resonance Imaging in Pediatric Cystic Fibrosis. Academic Radiology, vol. 28, no. 8, e209–e218 (2020)
5. Jiangsheng Yu et al. Comparison of Lung T2* During Free-Breathing at 1.5T and 3.0T with Ultrashort Echo Time (UTE) Imaging. Magnetic Resonance in Medicine, vol. 66, no. 1, pp. 248–254 (2011)
Figures
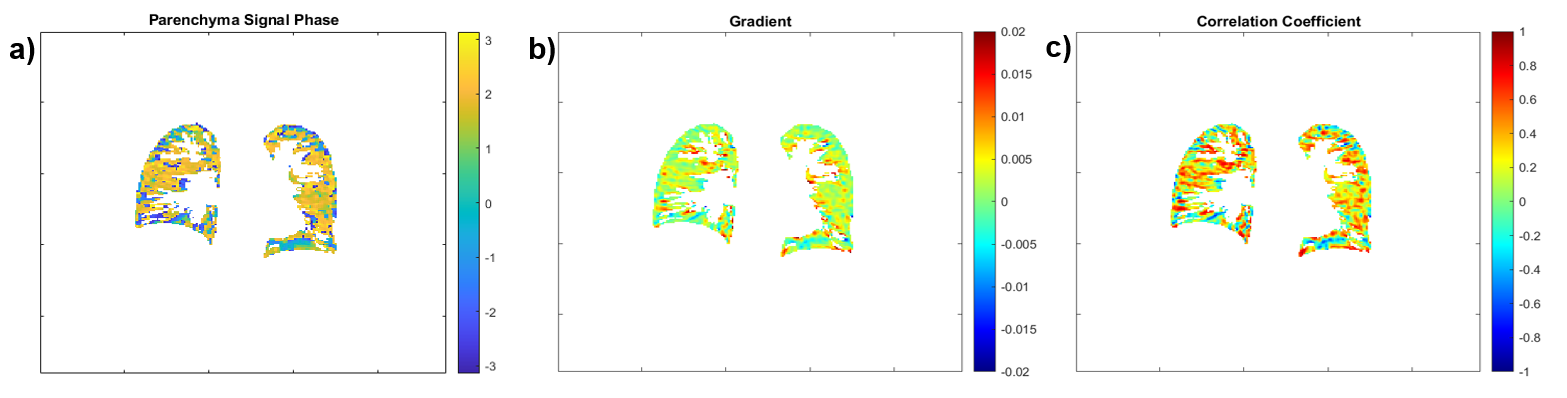
Figure 1: Example maps of the (a) phase of the signal change in the parenchyma at the respiratory frequency, the (b) gradient and (c) correlation coefficient of the plot of MR signal against diaphragm signal.
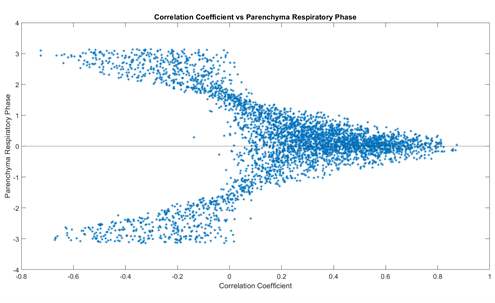
Figure 2: Scatter plot of the phase of the signal change in the parenchyma at the respiratory frequency against correlation coefficient for one subject.
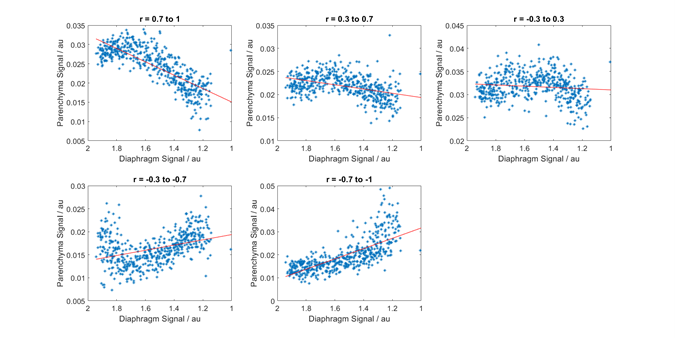
Figure 3: Scatter plots showing typical variations in signal with diaphragm position for single voxels with varying correlation coefficients (indicated above the figures) for one subject.
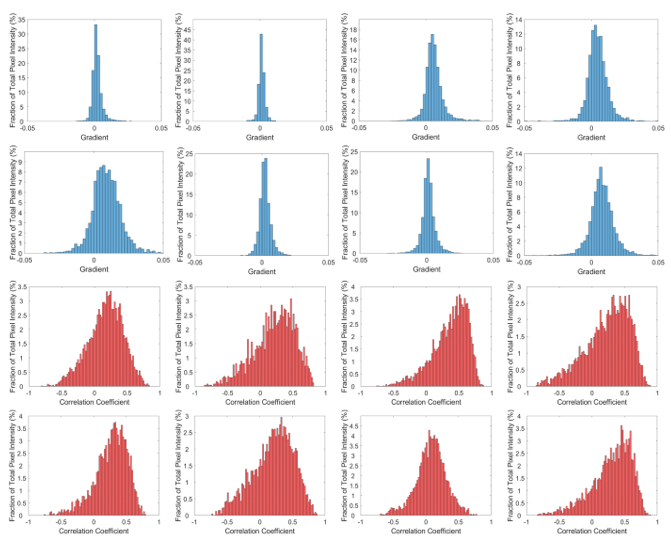
Figure 4: histograms of the gradient and correlation coefficient across all voxels for each subject in turn. Note the different y-axis limits.