1398
3D Pulmonary Perfusion Mapping Using 3D Ultrashort Echo-time Imaging1Department of Intelligent Precision Healthcare Convergence, Sungkyunkwan University, Suwan, Korea, Republic of, 2Department of Biomedical Engineering, Sungkyunkwan University, Suwan, Korea, Republic of, 3Biomedical Institute for Convergence at SKKU, Sungkyunkwan University, Suwon, Korea, Republic of
Synopsis
Lung MRI is getting more interest as an alternative to CT because of no radiation exposure and expands its role of providing structural information to functional information such as ventilation and perfusion. In terms of 3D functional imaging, 3D ventilation mapping was already proposed, but few studies have been done on 3D perfusion mapping. Here, we propose a 3D pulmonary perfusion map using 3D UTE-MRI with retrospective respiratory and cardiac gating. The proposed method provides high-resolution 3D regional perfusion information of the lungs and will be useful for diagnosing diffusive lung diseases along with ventilation map (e.g., V/Q ratio).
Introduction
MRI is emerging in lung diagnosis as an alternative to CT due to its lack of exposure to ionizing radiation and good soft-tissue contrast1, 2. MRI is also expanding its diagnostic role of providing structural information of the lungs to functional information such as ventilation and perfusion. Recently, a 2D ventilation and perfusion map acquisition method called PREFUL (Phase-resolved functional lung) MRI has been proposed that does not require breath hold as well as contrast agents3. However, while 3D ventilation mapping was proposed using 3D PREFUL-MRI4 and 3D ultrashort echo-time MRI (UTE-MRI)5, 6, but few studies have been done on 3D perfusion mapping. Here, we propose a non-contrast-enhanced 3D pulmonary perfusion map using 3D UTE-MRI with retrospective respiratory and cardiac gating. It was demonstrated by healthy human lung imaging and compared with 2D PREFUL perfusion mapping.Methods
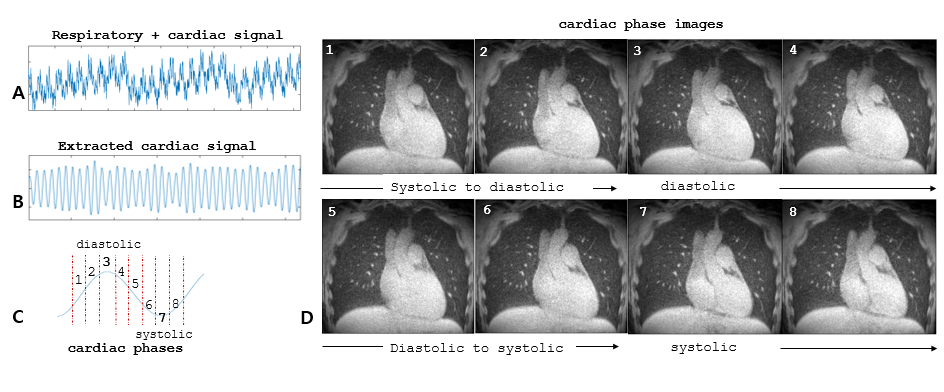
Experiments: This study was approved by the Institutional Review Board of Sungkyunkwan University (2019-02-008). Experiments were performed at Siemens 3T (Prisma) using a 26-channel reception coil. A volume-selective 3D UTE sequence (VS-UTE) was used with fat suppression7. Scan parameters were: TR/TE = 3.3/0.12ms, FOV = 360mm, number of projections = 150k, matrix size = 440×440×440, isotropic resolution = 0.8mm. Two flip angles (FA), 5° and 2° were used to test whether more proton-density weighting with a smaller flip angle is better for perfusion sensitivity. PREFUL-MRI were performed using a 2D spoiled GRE sequence over a temporal resolution of 650ms with the following scan parameters: TR/TE = 3.4/1.52ms, FOV = 360×360 mm2, matrix size = 192×192, slice thickness = 15mm, FA = 5°, bandwidth =1530 Hz/px, and parallel imaging with acceleration factor of two.Cardiac phase-resolved images: As a first step to creating a perfusion map, cardiac phase-resolved images were acquired via retrospective respiratory and cardiac gating. Respiratory signals with cardiac signals were acquired from self-navigating echoes (Fig.1A)8, 9 and cardiac signals were extracted by bandpass filtering in the range of 0.8-1.5Hz (Fig.1B)10. Then, eight cardiac phase-resolved lung images were reconstructed at the same end-expiration respiratory phase (Fig.1D). The number of projections used for each cardiac-phase image reconstruction was set equal to 15k.
Perfusion map: To obtain a perfusion map, a difference image was first created by subtracting the minimum value from the maximum value of the voxel in eight cardiac phase-resolved lung images after image registration. Then, the perfusion map was calculated by dividing the difference image by the aorta value of the pulmonary trunk that is assumed to be filled with full blood (100%) to represent the percentage of blood filled in each voxel.
Results
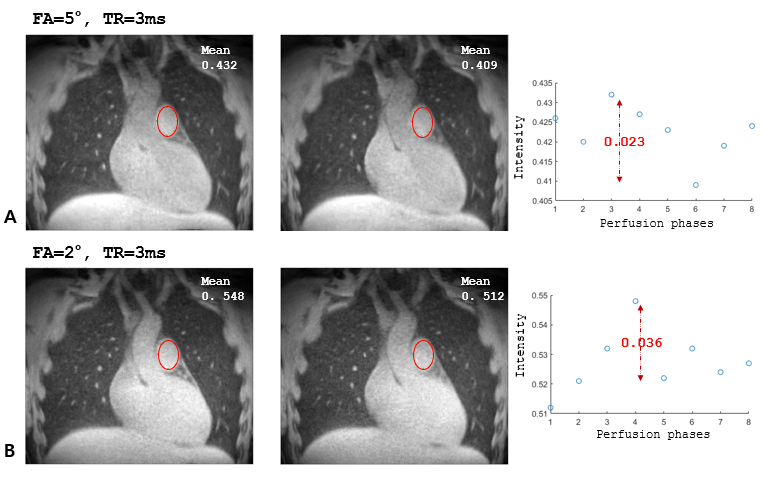
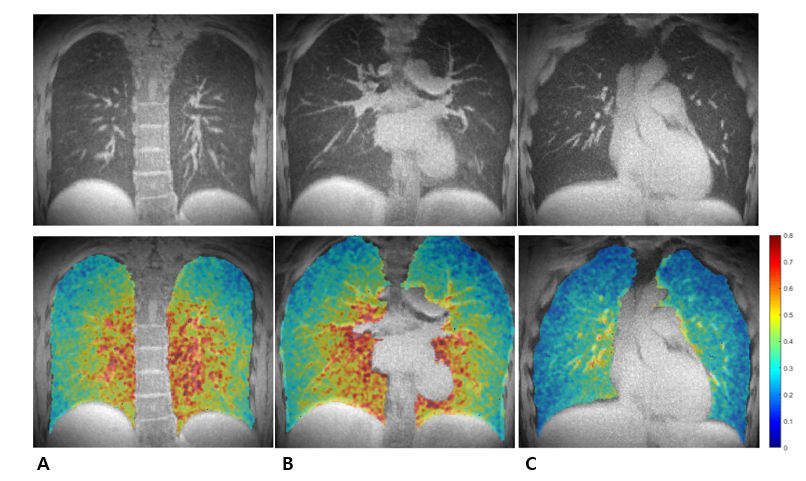
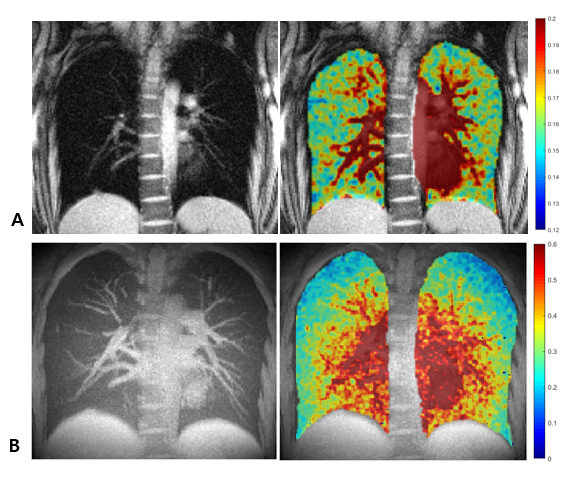
Figure 1D shows the eight lung images with different cardiac phases reconstructed from 3D UTE-MRI data. Despite under-sampled reconstruction via retrospective respiratory and cardiac gating, they not only clearly show cardiac motions, including systolic and diastolic, during the cardiac cycle, but also provide good image quality sufficient for perfusion analysis, minimizing motion artifacts. Figure 2 shows the results of comparing the perfusion sensitivity under FA = 5° and 2° conditions. The difference between the maximum and minimum mean intensity of the pulmonary artery was higher at FA = 2° (Δ=0.036; 7.03% in percent change) than at FA = 5° (Δ=0.023; 5.62% in percent change). Figure 3 shows regional perfusion maps from some representative slices of the proposed 3D UTE-MRI perfusion map. As expected, the aorta and large vessels showed higher signal intensities, and the lung parenchyma showed low but clear signal intensities. Figure 4 shows the 3D-UTE-MRI perfusion map versus the 2D PREFUL-MRI perfusion map obtained from the same healthy subject. For a fair comparison with the 2D PREFUL perfusion map, a MIP (maximum intensity projection) image was calculated to obtain the 3D-UTE-MRI perfusion map with the same slice thickness (=15mm) as the 2D PREFUL perfusion map. Although both show similar distributions of signal intensities, especially around the large vessel areas including the aorta, the 3D-UTE-MRI perfusion map shows a broader and more detailed distribution may be due to the advantage of 3D perfusion mapping.Discussion and Conclusion
In this study, we proposed a novel 3D perfusion map of the lungs using 3D UTE-MRI that does not require breath hold as well as contrast agents. The proposed 3D perfusion map is expected to provide 3D high resolution regional perfusion information of the lungs and will be particularly useful for diagnosing diffusive lung diseases such as COPD, Asthma, and interstitial lung disease (ILD). It can also be used to provide a 3D ventilation/perfusion (V/Q) ratio map from the same 3D UTE-MRI data along with the already proposed 3D ventilation map. At this stage, this study has a couple of limitations: First, in addition to the 2D PREFUL-MRI perfusion map used here, a more direct 3D lung perfusion mapping, e.g., using 3D DCE-MRI and SPECT, is needed for further validation of the proposed method. Second, because only healthy volunteers were considered in this study, a large cohort of lung patients is needed to test the clinical utility of the proposed method.Acknowledgements
This work was supported by the National Research Foundation of Korea (NRF) grant funded by the Korea government (MSIT): NRF-2020R1A2B5B02002676 and NRF-2021R1A4A5032806.References
[1] Rofsky NM, Lee VS, Laub G, Pollack MA, Krinsky GA, Thomasson D, et al. Abdominal MR imaging with a volumetric interpolated breath-hold examination. Radiology 1999;212(3):876-84.
[2] Johnson KM, Fain SB, Schiebler ML, Nagle S. Optimized 3D ultrashort echo time pulmonary MRI. Magnetic resonance in medicine 2013;70(5):1241-50.
[3] Voskrebenzev A, Gutberlet M, Klimeš F, Kaireit TF, Schönfeld C, Rotärmel A, et al. Feasibility of quantitative regional ventilation and perfusion mapping with phase‐resolved functional lung (PREFUL) MRI in healthy volunteers and COPD, CTEPH, and CF patients. Magnetic resonance in medicine 2018;79(4):2306-14.
[4] Klimeš F, Voskrebenzev A, Gutberlet M, Kern AL, Behrendt L, Grimm R, et al. 3D phase‐resolved functional lung ventilation MR imaging in healthy volunteers and patients with chronic pulmonary disease. Magnetic Resonance in Medicine 2021;85(2):912-25.
[5] Mendes Pereira L, Wech T, Weng A, Kestler C, Veldhoen S, Bley T, et al. UTE‐SENCEFUL: first results for 3D high‐resolution lung ventilation imaging. Magnetic resonance in medicine 2019;81(4):2464-73.
[6] Lee S, Kim H, Park J, Park J-Y. Evaluation of Ventilation Function Using 3D Ultrashort Echo-Time Imaging Without Exogenous Gases. Proc. Intl. Soc. Mag. Reson. Med. 28. 2020.
[7] Park J, Park J-Y. Reducing Streak Artifacts in 3D Radial Imaging Using Volume-Selective Signal Acquisition. Proc. Intl. Soc. Mag. Reson. Med. 28. 2020.
[8] Park J, Shin T, Yoon SH, Goo JM, Park JY. A radial sampling strategy for uniform k‐space coverage with retrospective respiratory gating in 3D ultrashort‐echo‐time lung imaging. NMR in Biomedicine 2016;29(5):576-87.
[9] Park J, Lee S, Shin T, Oh S-H, Park J-Y. A Robust Self-navigation for Respiratory Gating in 3D Radial Ultrashort Echo-time Lung MRI using Concurrent Dephasing and Excitation. Journal of the Korean Physical Society 2018;73(1):138-44.
[10] Kjørstad Å, Corteville DM, Fischer A, Henzler T, Schmid‐Bindert G, Zöllner FG, et al. Quantitative lung perfusion evaluation using Fourier decomposition perfusion MRI. Magnetic Resonance in Medicine 2014;72(2):558-62.
Figures