1396
Deep learning-based synthesis of hyperpolarized gas MRI ventilation from 3D multi-inflation proton MRI1Oncology and Metabolism, University of Sheffield, Sheffield, United Kingdom, 2POLARIS, Sheffield, United Kingdom, 3Clinical Oncology, Weston Park Cancer Centre, Sheffield, United Kingdom, 4Translational Science and Experimental Medicine, Research and Early Development, Respiratory & Immunology, BioPharmaceuticals R&D, AstraZeneca, Cambridge, United Kingdom, 5Clinical Development, Research and Early Development, Respiratory & Immunology, AstraZeneca, Cambridge, United Kingdom, 6Insigneo Institute for in silico medicine, University of Sheffield, Sheffield, United Kingdom
Synopsis
Hyperpolarized gas MRI can visualize and quantify regional lung ventilation with exquisite detail, but clinical uptake is limited to a few centres worldwide. Alternative, non-contrast techniques have been proposed to image ventilation, including 1H-based surrogates of ventilation from multi-inflation 1H-MRI. Recently, deep learning has shown potential for generating synthetic images in multiple modalities within the lung image analysis field. We propose a 3D multi-channel deep learning approach to synthesize hyperpolarized gas MRI and assess its quantitative performance using several common image synthesis metrics across a large, diverse dataset of lung pathologies using 5-fold cross-validation.
Introduction
Hyperpolarized (HP) gas MRI allows visualization and quantification of regional lung ventilation with high spatial and temporal resolution1; however, there is limited clinical translation due to the requirement for highly specialized equipment and exogenous contrast agents, such as xenon-129 (129Xe). Alternative, non-contrast proton (1H)-MRI-based surrogates of ventilation have been proposed2. These methods have shown spatial correlation with HP gas MRI3. Recently, deep learning (DL) using convolutional neural networks (CNNs) has shown promise for several lung image synthesis applications4,5. For example, Capaldi et al. demonstrated the synthesis of HP gas MRI from free-breathing 1H-MRI for a single 2D coronal section over time, limiting volumetric information on regional ventilation6. To date, no study has demonstrated the synthesis of volumetric 3D 1H-MRI-based surrogates of ventilation. Here, we propose a multi-channel DL approach to synthesize HP gas MRI from 3D multi-inflation 1H-MRI and model-based 1H-MRI ventilation.Methods
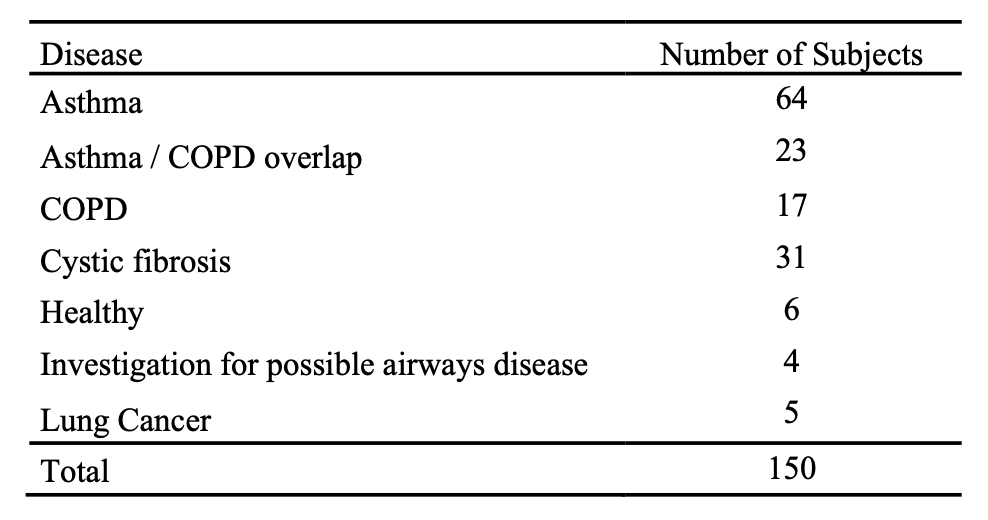
Imaging dataThe dataset comprised 3D isotropic SPGR 1H-MRI scans acquired at approximately total lung capacity (TLC) and residual volume (RV) and HP 129Xe-MRI ventilation scans acquired at functional residual capacity (FRC)+bag from 150 healthy subjects and patients with lung pathologies (see Table 1). In addition, a 1H-MRI was acquired at a similar-breath as 129Xe-MRI to facilitate image registration. All MRI scans were acquired on a 1.5T GE HDx scanner.
Image processing
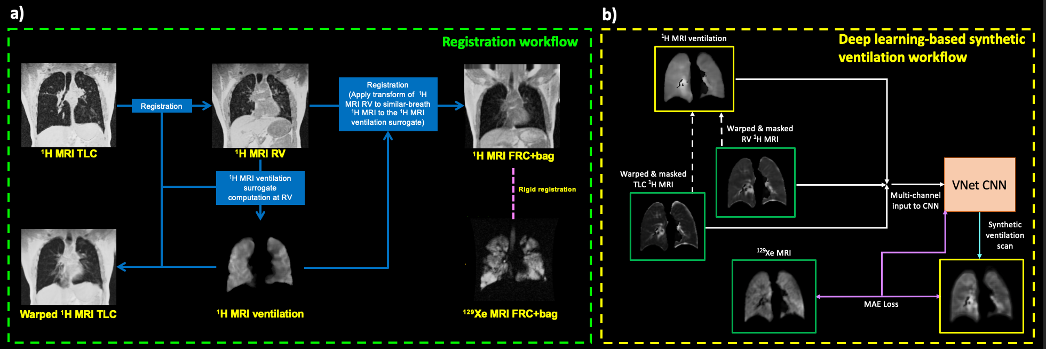
To facilitate registration, accurate segmentation of the lung parenchyma is required; DL-based 1H-MRI TLC and RV segmentations generated as previously described7 were manually corrected by expert observers. TLC and RV 1H-MRI scans were aligned using deformable image registration8 and subsequently registered to the spatial domain of 129Xe-MRI via the corresponding 1H-MRI FRC+bag scan. The registration workflow is detailed in Figure 1a. Model-based 1H-MRI ventilation surrogates were computed from the aligned TLC and RV 1H-MRI scans as described previously3: (SIRV-SITLC)/SITLC, where SIRV and SITLC are voxel-wise signal intensities at RV and TLC, respectively. 1H-MRI ventilation scans were median filtered with a radius of 3x3x1 to account for noise and registration errors.
Deep learning
We used a 3D multi-channel DL approach to generate synthetic 129Xe-MRI scans via a VNet9 CNN, which employs processed 1H-MRI acquired at RV and TLC with the corresponding model-based 1H ventilation scans as inputs. The DL workflow is described in Figure 1b.The 3D multi-channel VNet CNN consisted of convolutional steps containing between one and three convolutional layers with subsequent deconvolutional steps, enforcing the original input resolution. A mean absolute error (MAE) loss function, PReLU activation and ADAM optimization on patches of 128x128x48 for 1850 epochs was used10. This equated to a training time of ~24 hours parallelized across four GPUs. The model was trained using 5-fold cross-validation, resulting in training and testings sets of 120 and 30 subjects, respectively, for each fold.
Statistical analysis
We evaluated the accuracy of the synthetic HP gas MRI scans by comparing them to the original scans using several evaluation metrics, including voxel-wise Spearman’s correlation, MAE and root mean square error (RMSE) across the lung region defined by the 1H-MRI acquired at FRC+bag.
Results
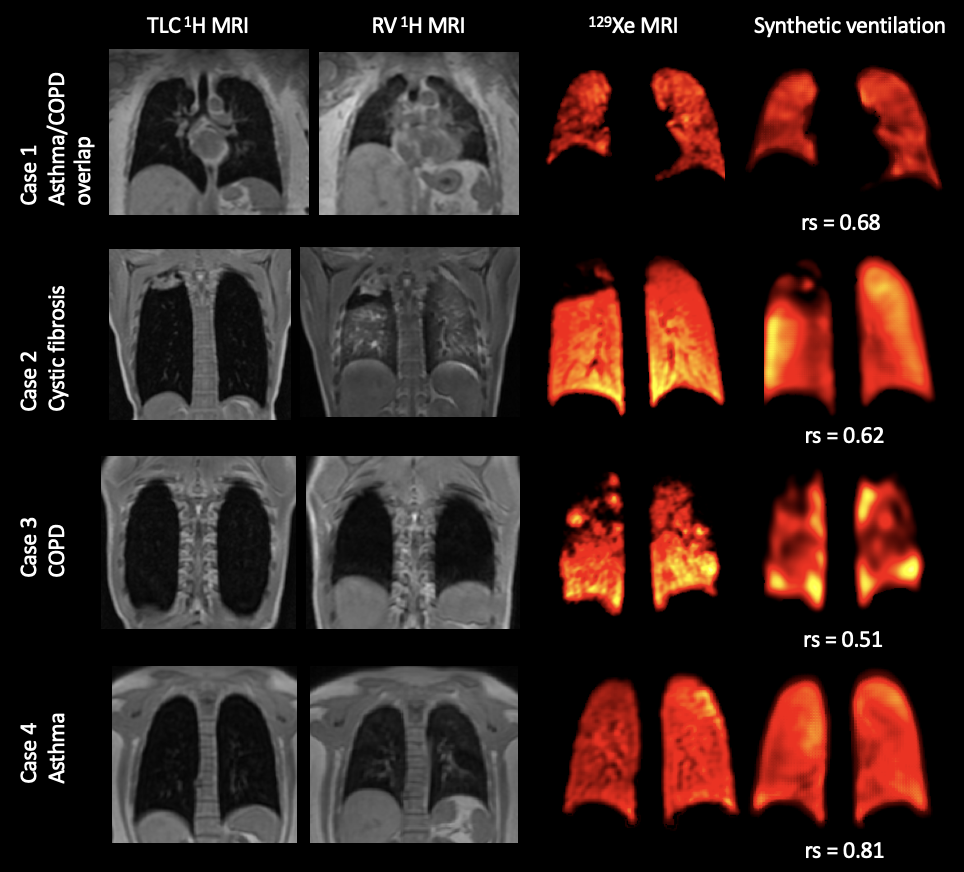
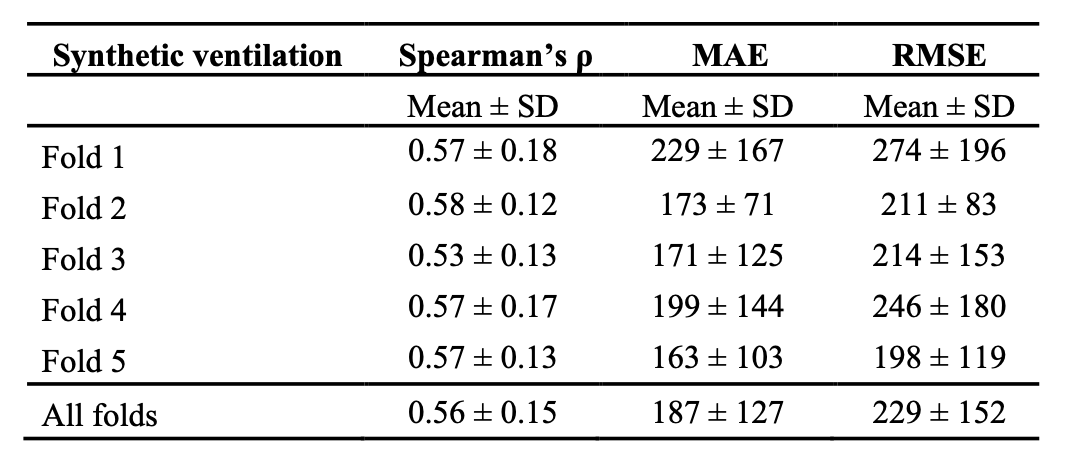
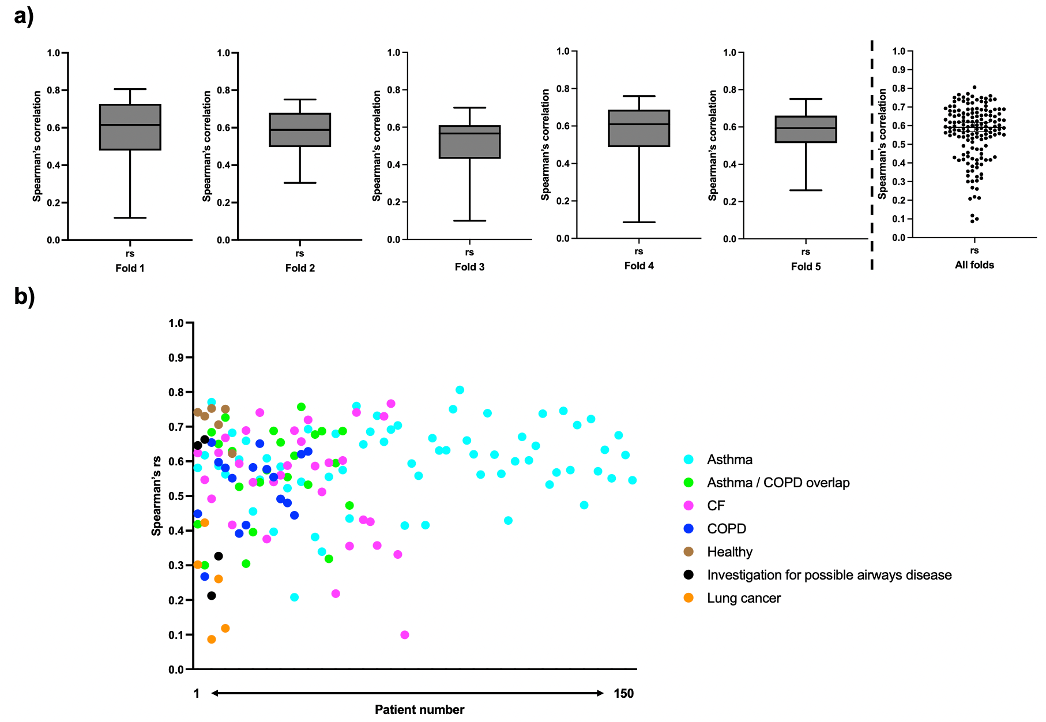
Qualitative spatial agreement and voxel-wise Spearman’s correlation between 129Xe-MRI and the DL-based synthetic ventilation for four cases in the dataset are shown in Figure 2. Cases 1-3 show that large ventilation defects present in the 129Xe-MRI are replicated by the synthetic ventilation scans.Table 2 summarizes the quantitative results comparing 129Xe-MRI and the DL-based synthetic ventilation images, showing a mean±SD Spearman’s rs, MAE and RMSE of 0.56±0.15, 187±127 and 229±152, respectively. In addition, Figure 3 shows the distribution of Spearman’s rs across all 5-folds individually, as well as the combined distribution across all folds.
Discussion
Our results show that a DL-based multi-channel 3D CNN approach can produce synthetic ventilation scans that yield moderate Spearman’s correlation with the HP gas MRI scans. The dataset comprised subjects with several different respiratory diseases, indicating that the DL approach appears to be robust across a large sample of 150 subjects. For three patients, Spearman’s correlation was below 0.2, two of which were from lung cancer cases; most of the data was from patients with obstructive lung diseases (~93%) with only five patients with lung cancer. Notwithstanding, in 73% of cases, the Spearman’s correlation was between 0.5-0.8, resulting in a median rs of 0.59.Qualitative agreement, as shown in Figure 2, demonstrates the ability of synthetic functional MR images to mimic subtle and gross defects present in the corresponding HP gas MRI scans, indicating the potential of DL-based regional lung function from multi-inflation 3D 1H-MRI. The VNet CNN processes 1H-MRI and 129Xe-MRI in a fully volumetric fashion, generating synthetic scans that can track ventilation defects across three dimensions. Our study represents the first 3D synthesis of HP gas MRI from multi-inflation 1H-MRI. The use of 5-fold cross-validation allows comprehensive analysis over a diverse range of lung pathologies that demonstrate the method’s robustness to predict ventilation under a wide variety of conditions.
Conclusion
Our results indicate that a DL-based multi-channel approach is capable of accurately synthesizing hyperpolarized gas MRI scans from 3D multi-inflation 1H-MRI scans for numerous pulmonary pathologies. We show that these synthetic functional lung MRI scans exhibit moderate performance across several metrics.Acknowledgements
This work was supported by Yorkshire Cancer Research, Weston Park Cancer Charity, National Institute of Health Research, the Medical Research Council and AstraZeneca. The authors also acknowledge access to high-performance computing equipment available via an EPSRC Equipment Grant EP/P020275/1 (JADE) and support provided for this equipment grant via Research Software Engineering Sheffield.References
1. Kauczor HU., Hofmann D., Kreitner KF., et al. Normal and abnormal pulmonary ventilation: visualization at hyperpolarized He-3 MR imaging. Radiology 1996;201(2):564–568.
2. Kjørstad Å, Regier M, Fiehler J et al. A decade of lung expansion: A review of ventilation-weighted 1H lung MRI. Z Med Phys. 2017;27(3):172-179.
3. Tahir BA., Smith LJ., Astley JR., et al. Proton lung ventilation MRI in cystic fibrosis: comparison with hyperpolarized gas MRI, pulmonary function tests and multiple-breath washout. ISMRM 2021.
4. Liu Z., Miao J., Huang P., et al. A deep learning method for producing ventilation images from 4DCT: First comparison with technegas SPECT ventilation. Medical Physics. 2020;47(3):1249-57.
5. Astley JR., Wild JM., Tahir BA. Deep learning in structural and functional lung image analysis. Br J Radiol. 2021 Apr 20:20201107. doi: 10.1259/bjr.20201107.
6. Capaldi DP., Guo F., Xing I., et al. Pulmonary Ventilation Maps Generated With Free-breathing Proton MRI and a Deep Convolutional Neural Network. Radiology, vol. 298, no. 2, 2021, pp. 427-438.
7. Astley JR., Biancardi AM., Marshall H., Generalizable deep learning for multi-resolution proton MRI lung segmentation in multiple diseases. ISMRM 2021.
8. Avants BB., Tustison NJ., Song G., et al. A reproducible evaluation of ANTs similarity metric performance in brain image registration. Neuroimage. 2011;54(3):2033-2044.
9. Milletari F., Navab N., Ahmadi SA. V-Net: Fully Convolutional Neural Networks for Volumetric Medical Image Segmentation. Proceedings of 2016 Fourth International Conference on 3d Vision (3dv) 2016:565-71.
10. Gibson E., Li W., Sudre C., et al. NiftyNet: a deep-learning platform for medical imaging. Comput Methods Programs Biomed. 2018 May;158:113-122.
Figures