1395
A multi-channel deep learning approach for lung cavity estimation from hyperpolarized gas and proton MRI1Oncology and Metabolism, University of Sheffield, Sheffield, United Kingdom, 2POLARIS, Sheffield, United Kingdom, 3Translational Science and Experimental Medicine, Research and Early Development, Respiratory & Immunology, BioPharmaceuticals R&D, AstraZeneca, Cambridge, United Kingdom, 4Clinical Development, Research and Early Development, Respiratory & Immunology, AstraZeneca, Cambridge, United Kingdom, 5Insigneo Institute for in silico medicine, University of Sheffield, Sheffield, United Kingdom
Synopsis
Functional lung imaging biomarkers, such as the ventilated defect percentage, are computed from segmentations derived from spatially co-registered functional hyperpolarized gas MRI and structural 1H-MRI. Although hyperpolarized gas and 1H-MRI can be acquired in the same or similar breaths, the acquired scans are frequently misaligned. Here, we propose a multi-channel deep learning-based approach to generate accurate lung cavity estimations (LCEs). Across all evaluation metrics, the multi-channel approach significantly outperformed single-channel approaches and generated plausible LCEs across a wide range of pulmonary pathologies. In addition, correlation and Bland-Altman analyses of lung volumes demonstrated strong correlation and minimal bias with expert LCEs.
Introduction
Hyperpolarized gas MRI enables quantification of regional lung ventilation via clinical biomarkers such as the ventilated defect percentage (VDP)1. VDP is computed from segmentations derived from spatially co-registered functional hyperpolarized (HP) gas MRI and structural 1H-MRI. To ensure spatial alignment, both modalities are acquired shortly after each other and at the same lung inflation level. However, the acquired scans are frequently misaligned; image registration, which assumes topology preservation between fixed and moving images, consistently underperforms on cases with large discrepancies in topology between functional and structural modalities2. Consequently, the misaligned structural region of interest required for the computation of VDP poses significant segmentation challenges. Therefore, a lung cavity estimation (LCE) which represents the thoracic cavity volume in the spatial domain of HP gas MRI is required. To date, no algorithm exists to automatically segment this structure and manual editing is time-consuming3. Recently, deep learning (DL) has shown promise for pulmonary image segmentation problems4. Previous approaches have used convolutional neural networks (CNNs) to generate segmentations for HP gas MRI and 1H-MRI separately using single-channel CNN-based methods5-7. Multi-channel approaches have shown promise in image analysis tasks where there are important features across multiple imaging modalities8. Here, we propose a multi-channel DL-based method for generating LCEs using HP gas MRI and 1H-MRI across a wide range of lung pathologies. We compare this approach with single-channel CNN-based methods.Methods
Imaging dataThe dataset comprised 480 3D isotropic SPGR 1H-MRI scans and HP 129Xe- and 3He-MRI ventilation scans acquired approximately at functional residual capacity + bag or total lung capacity from healthy subjects and patients with numerous lung pathologies. All MRI scans were acquired on a 1.5T GE HDx scanner. 1H-MRI and HP gas MRI were rigidly registered.
Deep learning
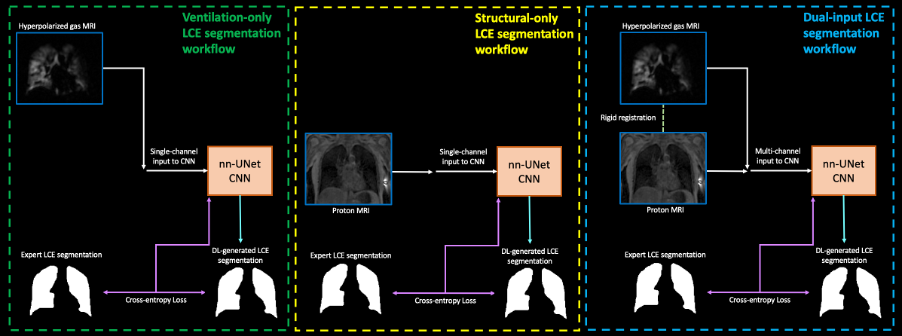
A CNN with a 3D nn-UNet9 architecture was trained with a PReLU activation function, ADAM optimization and cross-entropy loss function on patches of 96x96x96. A learning rate of 0.00001 and batch size of 2 was used. We assessed three methods of DL training by varying the input images provided to the network (see Figure 1) as follows:
1) Ventilation-only (HP gas MRI)
2) Structural-only (1H-MRI)
3) Dual-input (HP gas MRI + 1H-MRI)
The dataset was divided into training and testing sets comprising 422 and 58 scans, respectively. Although longitudinal and multi-inflation level scans were included in the training set, only one scan per patient was included in the testing set and thus no patient was present in both the training and testing sets. Each method was trained for 300 epochs on a single GPU.
Statistical analysis
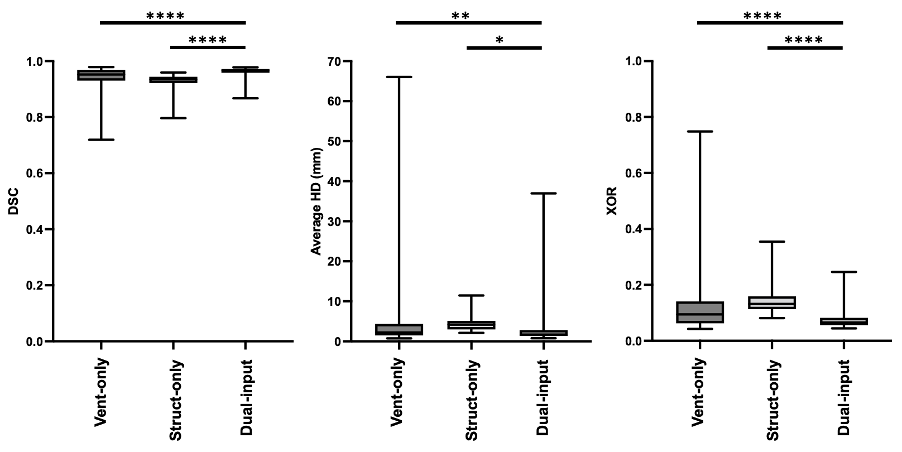
To evaluate segmentation accuracy, Dice similarity coefficient (DSC), average boundary Hausdorff distance (average HD) in mm and XOR10 metrics were computed. Paired t-tests were used to assess group differences between ventilation-only, structural-only, and dual-input methods. Pearson correlation and Bland-Altman analysis were conducted to compare the volumes of the dual-input DL method and expert LCEs.
Results
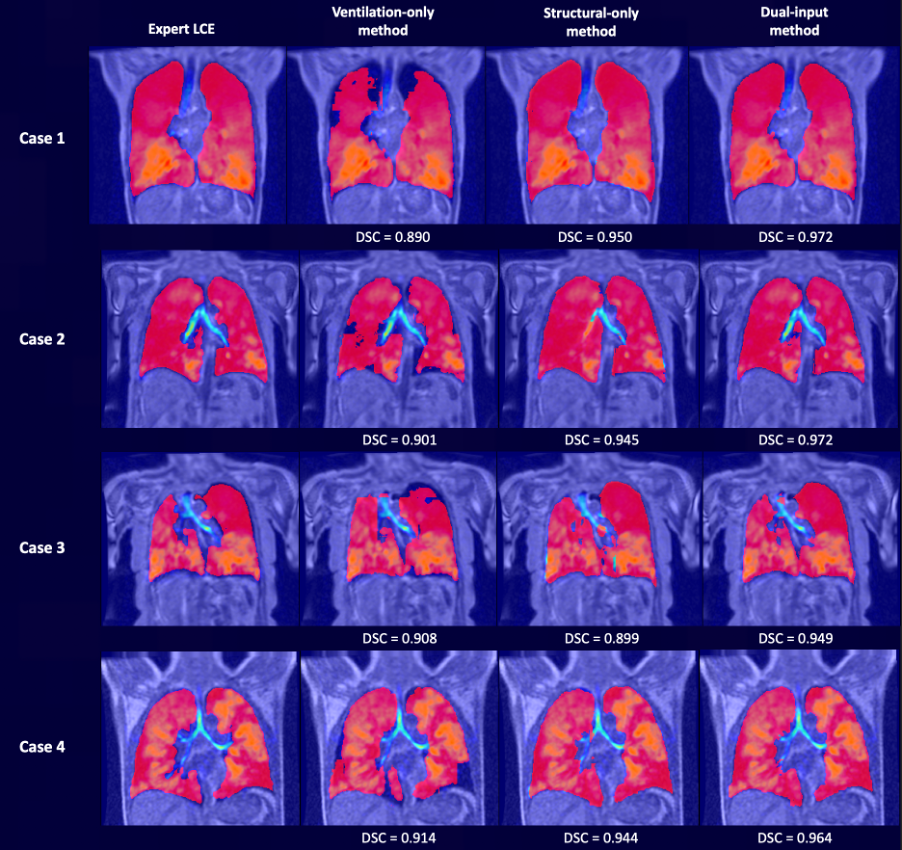
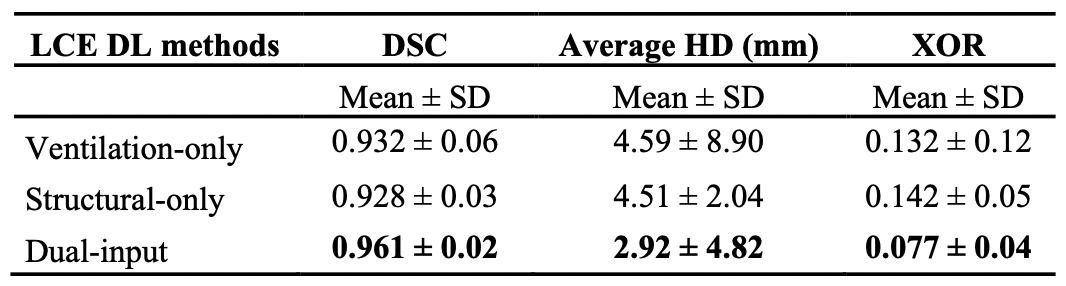
Figure 2 shows the qualitative performance of each DL method comparing the DL-generated LCEs to the expert LCEs for four cases. For all cases, the dual-input method generates plausible LCEs and outperforms the other methods as assessed by DSCs.A breakdown of results for each DL method is provided in Table 1, demonstrating that the dual-input method generates the most accurate segmentations across all metrics, achieving a mean±SD DSC, average HD and XOR of 0.961±0.02, 2.92±4.82mm and 0.077±0.04, respectively. Paired t-tests indicated that, for all three metrics, the dual-input method significantly outperforms the single-channel methods (p<0.05) (see Figure 3).
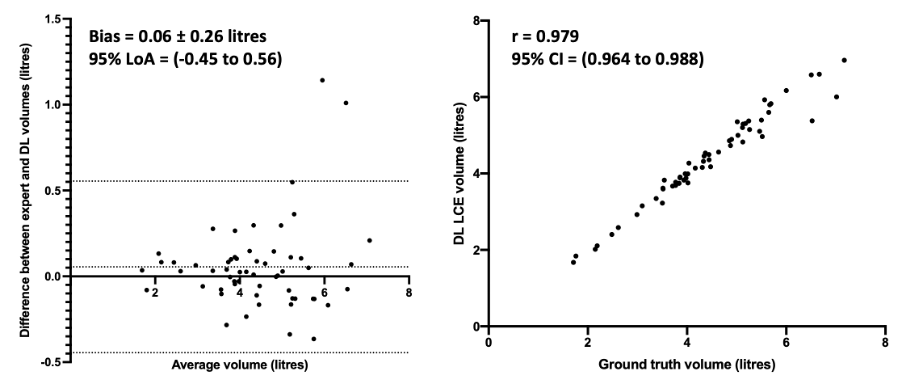
Figure 5 shows correlation and Bland-Altman analyses of lung volumes for the dual-input DL method compared to expert LCEs. The dual-input method exhibited a strong Pearson’s correlation of 0.98 and minimal bias of 0.06 litres, indicating the algorithm’s ability to accurately generate LCEs across various diseases.
Discussion
Qualitative comparison of DL methods demonstrates the differences in LCEs due to the varying input channels. For all cases, the ventilation-only method is unable to generate plausible LCEs due to the lack of structural features provided to the CNN. Conversely, the structural-only method generates reasonable LCEs; however, in cases where there is misalignment between the HP gas and 1H-MRI, the structural-only DL method cannot account for the inherent registration errors. In all four cases, particularly in Case 3 at the base of the left lung, there is significant misalignment, leading to an error in the generated LCE by the structural-only method; in contrast, the dual-input method addresses this misalignment. For cases 1-4, the dual-input method consistently accounts for misalignments.The ability to accurately generate LCEs is critical to calculating VDP. The dual-input method yields LCEs in under 30 seconds that require minimal or no manual intervention. Our multi-channel 3D CNN facilitates the computation of rapid, accurate and robust VDPs, enabling higher clinical throughput.
Conclusion
We evaluated several 3D CNN-based methods for LCE and demonstrated that a multi-channel approach, leveraging both HP gas and 1H-MRI as inputs, yields accurate LCEs. The dual-input method is robust across a range of diseases and significantly outperforms the single-channel approaches evaluated. Generating accurate LCEs has the potential to dramatically reduce the time taken to compute functional lung imaging biomarkers, such as the VDP.Acknowledgements
This work was supported by Yorkshire Cancer Research, Weston Park Cancer Charity, National Institute of Health Research, the Medical Research Council and AstraZeneca.References
1. Woodhouse N, Wild JM, Paley M, et al. Combined helium‐3/proton magnetic resonance imaging measurement of ventilated lung volumes in smokers compared to never‐smokers. J. Magn. Reson. Imaging, 2005;21:365-369.
2. Tahir BA, Swift AJ, Marshall H, et al. A method for quantitative analysis of regional lung ventilation using deformable image registration of CT and hybrid hyperpolarized gas/1H MRI. Phys Med Biol. 2014 Dec 7;59(23):7267-7277.
3. Biancardi AM, Acunzo L, Marshall H, et al. A paired approach to the segmentation of proton and hyperpolarized gas MR images of the lungs. ISMRM 2018.
4. Astley JR., Wild JM., Tahir BA. Deep learning in structural and functional lung image analysis. Br J Radiol. 2021 Apr 20:20201107. doi: 10.1259/bjr.20201107.
5. Tustison NJ, Altes TA, Qing K, et al. Image- versus histogram-based considerations in semantic segmentation of pulmonary hyperpolarized gas images. Magn Reson Med. 2021 Nov;86(5):2822-2836.
6. Astley JR, Biancardi A, Hughes PJ, et al. 3D deep convolutional neural network-based ventilated lung segmentation using multi-nuclear hyperpolarized gas MRI. Thoracic Image Analysis. TIA 2020, Lecture Notes in Computer Science, Springer Verlag. pp. 24-35. ISBN 9783030624682.
7. Astley JR, Biancardi A, Marshall H, et al. Generalizable deep learning for multi-resolution proton MRI lung segmentation in multiple diseases. in Proc. Intl. Soc. Mag. Reson. Med. 2021. 3224
8. Yang X, Su Y, Tjio G, et al. A Multi-channel Deep Learning Approach for Segmentation of the Left Ventricular Endocardium from Cardiac Images. Annu Int Conf IEEE Eng Med Biol Soc. 2019 Jul;2019:4016-4019.
9. Isensee F, Jaeger PF, Kohl SAA, et al. nnU-Net: a self-configuring method for deep learning-based biomedical image segmentation. Nat Methods 18, 203–211 (2021).
10. Biancardi AM, Wild JM. New Disagreement Metrics Incorporating Spatial Detail – Applications to Lung Imaging. MIUA 2017. Communications in Computer and Information Science, vol 723. 2017. Springer, Cham.
Figures