1388
High-resolution vascular imaging of the whole brain at 7T in 15 minutes
Arun Joseph1,2,3, Patrick Liebig4, Piotr Radojewski2,5, Roland Wiest2,5, Tobias Kober6,7,8, and Tom Hilbert6,7,8
1Advanced Clinical Imaging Technology, Siemens Healthcare AG, Bern, Switzerland, 2Translational Imaging Center, sitem-insel AG, Bern, Switzerland, 3Magnetic Resonance Methodology, Institute of Diagnostic and Interventional Neuroradiology, University of Bern, Bern, Switzerland, 4Siemens Healthcare GmbH, Erlangen, Germany, 5Support Center for Advanced Neuroimaging, Institute for Diagnostic and Interventional Neuroradiology, Inselspital, Bern University, Bern, Switzerland, 6Advanced Clinical Imaging Technology, Siemens Healthcare AG, Lausanne, Switzerland, 7Department of Radiology, Lausanne University Hospital and University of Lausanne, Lausanne, Switzerland, 8LTS5, École Polytechnique Fédérale de Lausanne (EPFL), Lausanne, Switzerland
1Advanced Clinical Imaging Technology, Siemens Healthcare AG, Bern, Switzerland, 2Translational Imaging Center, sitem-insel AG, Bern, Switzerland, 3Magnetic Resonance Methodology, Institute of Diagnostic and Interventional Neuroradiology, University of Bern, Bern, Switzerland, 4Siemens Healthcare GmbH, Erlangen, Germany, 5Support Center for Advanced Neuroimaging, Institute for Diagnostic and Interventional Neuroradiology, Inselspital, Bern University, Bern, Switzerland, 6Advanced Clinical Imaging Technology, Siemens Healthcare AG, Lausanne, Switzerland, 7Department of Radiology, Lausanne University Hospital and University of Lausanne, Lausanne, Switzerland, 8LTS5, École Polytechnique Fédérale de Lausanne (EPFL), Lausanne, Switzerland
Synopsis
Vascular disease such as arteriovenous malformations can be fatal and lead to brain damage if not detected early. To that end, time of flight angiography is an important tool to visualize vessels, especially the arteries with implications for treatment planning and follow-up. Similarly, susceptibility weighted imaging can be used to visualize veins due to its sensitivity to magnetic field inhomogeneities. However, high resolution TOF and SWI acquisitions can lead to clinically unfeasible scan times. Here, we propose to use compressed-sensing-accelerated high resolution TOF and SWI acquisitions at 7T in <15 minutes to visualize the vascular system of the whole brain.
Introduction
Arteriovenous malformation (AVM) is a tangle of small blood vessels that connect arteries directly to veins without intervening capillaries1-3. This results in high-flow, low-resistance shunts between arterial and venous vessels. AVM in the brain could be fatal and can lead to hemorrhage, stroke, and potential subsequent brain damage. AVM among other vascular disease would benefit from high resolution imaging and visualization of the vascular system of the brain.Time of Flight angiography (TOF) is a non-contrast enhanced MR method to visualize blood vessels with fine details4-5. TOF is a valuable technique for the assessment of cerebrovascular abnormalities such as aneurysms. It is mainly used to visualize arteries since its main source of image contrast originates from inflowing blood, resulting in saturated background tissue and veins (arteries are hyperintense).
Susceptibility weighted imaging (SWI) is another important diagnostic tool which relies on susceptibility differences between tissues caused by local magnetic inhomogeneities6. Although SWI is primarily used for clinical diagnosis of different neurodegenerative diseases such as stroke, multiple sclerosis, it can also be used to visualize the venous systems in the brain through minimum intensity projections (veins are hypointense).
Imaging at high magnetic field strengths is advantageous as it provides improved signal-to-noise ratios (SNR). Higher SNR can be used to achieve higher resolutions, a major advantage for imaging small vessels. However, the acquisition time increases drastically as well.
Here, we propose to use Compressed Sensing (CS)-based GRE sequences to accelerate high resolution TOF7 and SWI8 acquisitions at 7T and propose a comprehensive protocol to image the vascular system of the brain at high resolutions in 15 min.
Methods
All measurements were performed at 7T (MAGNETOM Terra, Siemens Healthcare, Erlangen, Germany) using a 1Tx/32Rx head coil (Nova Medical, Wilmington, USA). Five healthy subjects (3 Female, age 26±4 years) were scanned after written informed consent was obtained. Prototype gradient-echo (GRE) sequences were implemented with a Cartesian spiral-phyllotaxis undersampling scheme9 and variable-density Poisson disk with a Gaussian density distribution undersampling scheme7 for SWI and TOF acquisitions, respectively. Variable-Rate Selective Excitation (VERSE) saturation pulses were additionally used in the CS TOF sequence to saturate venous blood and fat. The CS acquisitions for SWI and TOF were performed with an isotropic resolution of 0.5 mm and 0.31 mm, respectively. For comparison, a reference measurement for SWI was also performed with isotropic resolution of 0.5 mm and GRAPPAx2 acceleration resulting in total acquisition time of 15 min. Table 1 shows the scan parameters used for the CS SWI and TOF measurements.An additional CS-based MP2RAGE9 sequence was acquired as anatomical reference (TR 6000 ms, TE 2.06 ms, TI1/2 800/2700 ms, flip angles 4°/5°, Bandwidth 240 Hz/Px, 0.6 mm isotropic resolution). Image reconstructions were performed inline on the scanner for all the measurements. While the GRAPPAx2 measurements used the commercially available reconstruction, the CS reconstructions were using a prototype iterative algorithm10-12 with Haar wavelet regularization. The complex coil sensitivity maps for the CS reconstruction were estimated using the ESPIRiT algorithm13. The computational time for the CS reconstruction was ~5-7 minutes per dataset. Spatially varying signal intensities in the SWI images were corrected with the N4 Bias Field Correction tool in 3D Slicer14. The SW and TOF images were used to generate intensity projections of veins and volume renderings of arteries, respectively. Additionally, a visualization of the cerebral arterio-venous systems was generated by superimposing volume renderings of SWI hypointensities and TOF hyperintensities in 3D Slicer.
Results and Discussion
Figure 1 shows the axial images of CS TOF measurements at different acceleration factors of 6, 8, 10, 12. One can observe that the noise increases with higher acceleration factors. However, the increase in background noise does not corrupt the delineation of vessels obtained from the volume rendering. Figure 2 shows the SW images obtained at different acceleration factors of 3, 5, 7, and 9. Minimal artifacts are observed in the SW images at higher acceleration factors. These artifacts do not affect important venous information even with a 7-fold acceleration. Figure 3 shows the comparison of CS with acceleration factor 7 and GRAPPAx2 SW images. Images obtained from CS acquisitions provide similar qualitative information compared to GRAPPAx2 acquisitions. The respective minimum intensity projections (mIP) obtained from CS with acceleration factor 7 and GRAPPAx2 SW images are also shown. CS acquisitions were found to provide images with sharper veins in comparison to GRAPPAx2 even with a highly reduced acquisition time of 5 mins. Figure 4 shows the combined volume rendering of arteries and veins obtained from CS TOF and SWI acquisitions, respectively. This type of visualization may be of clinical interest for the diagnosis and treatment planning of vascular disease such as AVM which will need to be proven in patients in future work. Furthermore, additional quantitative values based on tissue susceptibility obtained from SWI acquisitions can be used for further diagnosis of neurodegenerative diseases.Conclusion
In this work, we have used high resolution CS-based TOF and SWI acquisitions at 7T to visualize arteries and veins of the whole brain in less than 15 minutes. The preliminary results indicate excellent visualization of arteries and veins in the brain which could improve the diagnosis of vascular diseases such as AVM.Acknowledgements
No acknowledgement found.References
- Geibprasert S, Pongpech S, Jiarakongmun P, et al. Radiologic Assessment of Brain Arteriovenous Malformations: What Clinicians Need to Know. RadioGraphics. 2010;30 (2): 483–501.
- Lawton MT, Caleb Rutledge W, Kim H, et al. Brain arteriovenous malformations. Nat Rev Dis Primers. 2015 ; 1 : 15008.
- Biondetti E, Rojas-Villabon A, Sokolska M, et al. Investigating the oxygenation of brain arteriovenous malformations using quantitative susceptibility mapping. NeuroImage 2019; 199(1): 440-453.
- Stamm AC, Wright CL, Knopp MV, et al. Phase contrast and time-of-flight magnetic resonance angiography of the intracerebral arteries at 1.5, 3 and 7T. Magnetic Resonance Imaging 2013; 31:545–549.
- Heverhagen JT, Bourekas E, Sammet S, et al. Time-of-Flight Magnetic Resonance Angiography at 7 Tesla. Investigative Radiology 2008; 43(8): 568-573.
- Deistung A, Rauscher A, Sedlacik J, et al. Susceptibility weighted imaging at ultra high magnetic field strengths: Theoretical considerations and experimental Results. Magn Reson Med. 2008; 60:1155–1168.
- Meixner CR, Liebig P, Speier P, et al. High resolution time-of-flight MR-angiography at 7 T exploiting VERSE saturation, compressed sensing and segmentation. Magnetic Resonance Imaging 2019; 63: 193–204.
- Joseph A, Kober T, Hilbert T. R2* mapping of the whole brain with 0.8 mm isotropic resolution at 7T in less than 7 minutes. Proc. Intl. Soc. Mag. Reson. Med. 2021; 29: 0092.
- Mussard E, Hilbert T, Forman C, et al. Accelerated MP2RAGE imaging using Cartesian phyllotaxis readout and compressed sensing reconstruction. Magn Reson Med. 2020; 84(4):1881-1894.
- Forman C, Piccini D, Grimm R, et al. High-resolution 3D whole-heart coronary MRA: a study on the combination of data acquisition in multiple breath-holds and 1D residual respiratory motion compensation. MAGMA. 2014;27(5):435-43.
- Wetzl J, Forman C, Wintersperger BJ, et al. High-resolution dynamic CE-MRA of the thorax enabled by iterative TWIST reconstruction. Magn Reson Med. 2017;77(2):833-840.
- Ma LE, Markl M, Chow K, et al. Aortic 4D flow MRI in 2 minutes using compressed sensing, respiratory controlled adaptive k-space reordering, and inline reconstruction. Magn Reson Med. 2019;81(6):3675-3690.
- Uecker M, Lai P, Murphy MJ, et al. ESPIRiT--an eigenvalue approach to autocalibrating parallel MRI: where SENSE meets GRAPPA. Magn Reson Med 2014;71(3):990-1001.
- Kikinis R., Pieper S.D., Vosburgh K.G. 3D Slicer: A Platform for Subject-Specific Image Analysis, Visualization, and Clinical Support. In: Jolesz F. (eds) Intraoperative Imaging and Image-Guided Therapy. Springer, New York, NY. (2014). https://doi.org/10.1007/978-1-4614-7657-3_19.
Figures
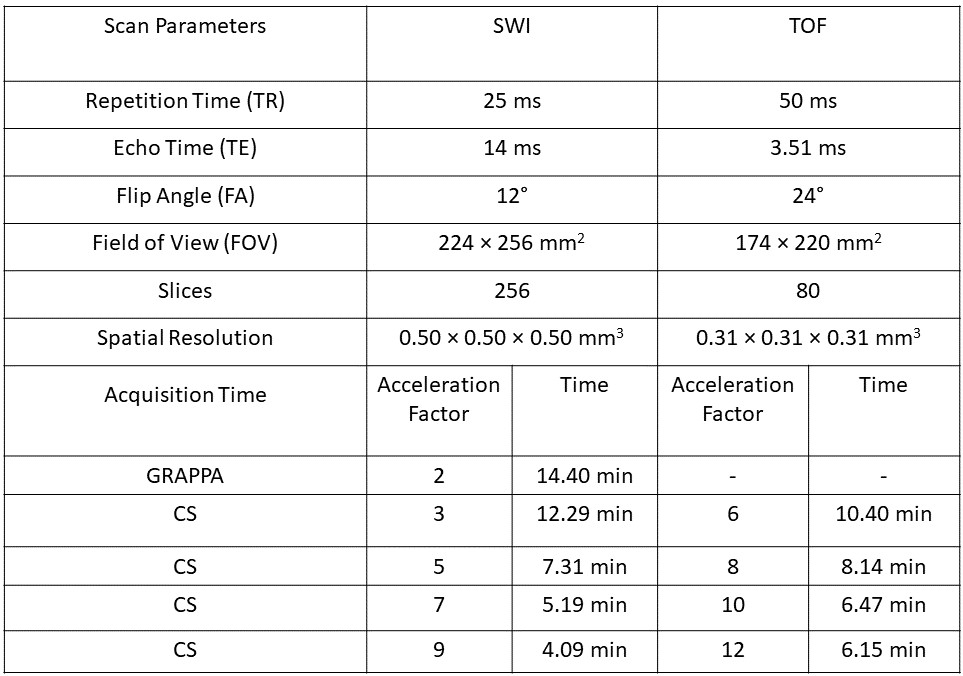
Table 1:
Scan parameters used for
susceptibility weighted imaging (SWI), time of flight angiography (TOF)
acquisitions, and for different acceleration techniques: GRAPPAx2 and
compressed sensing (CS).
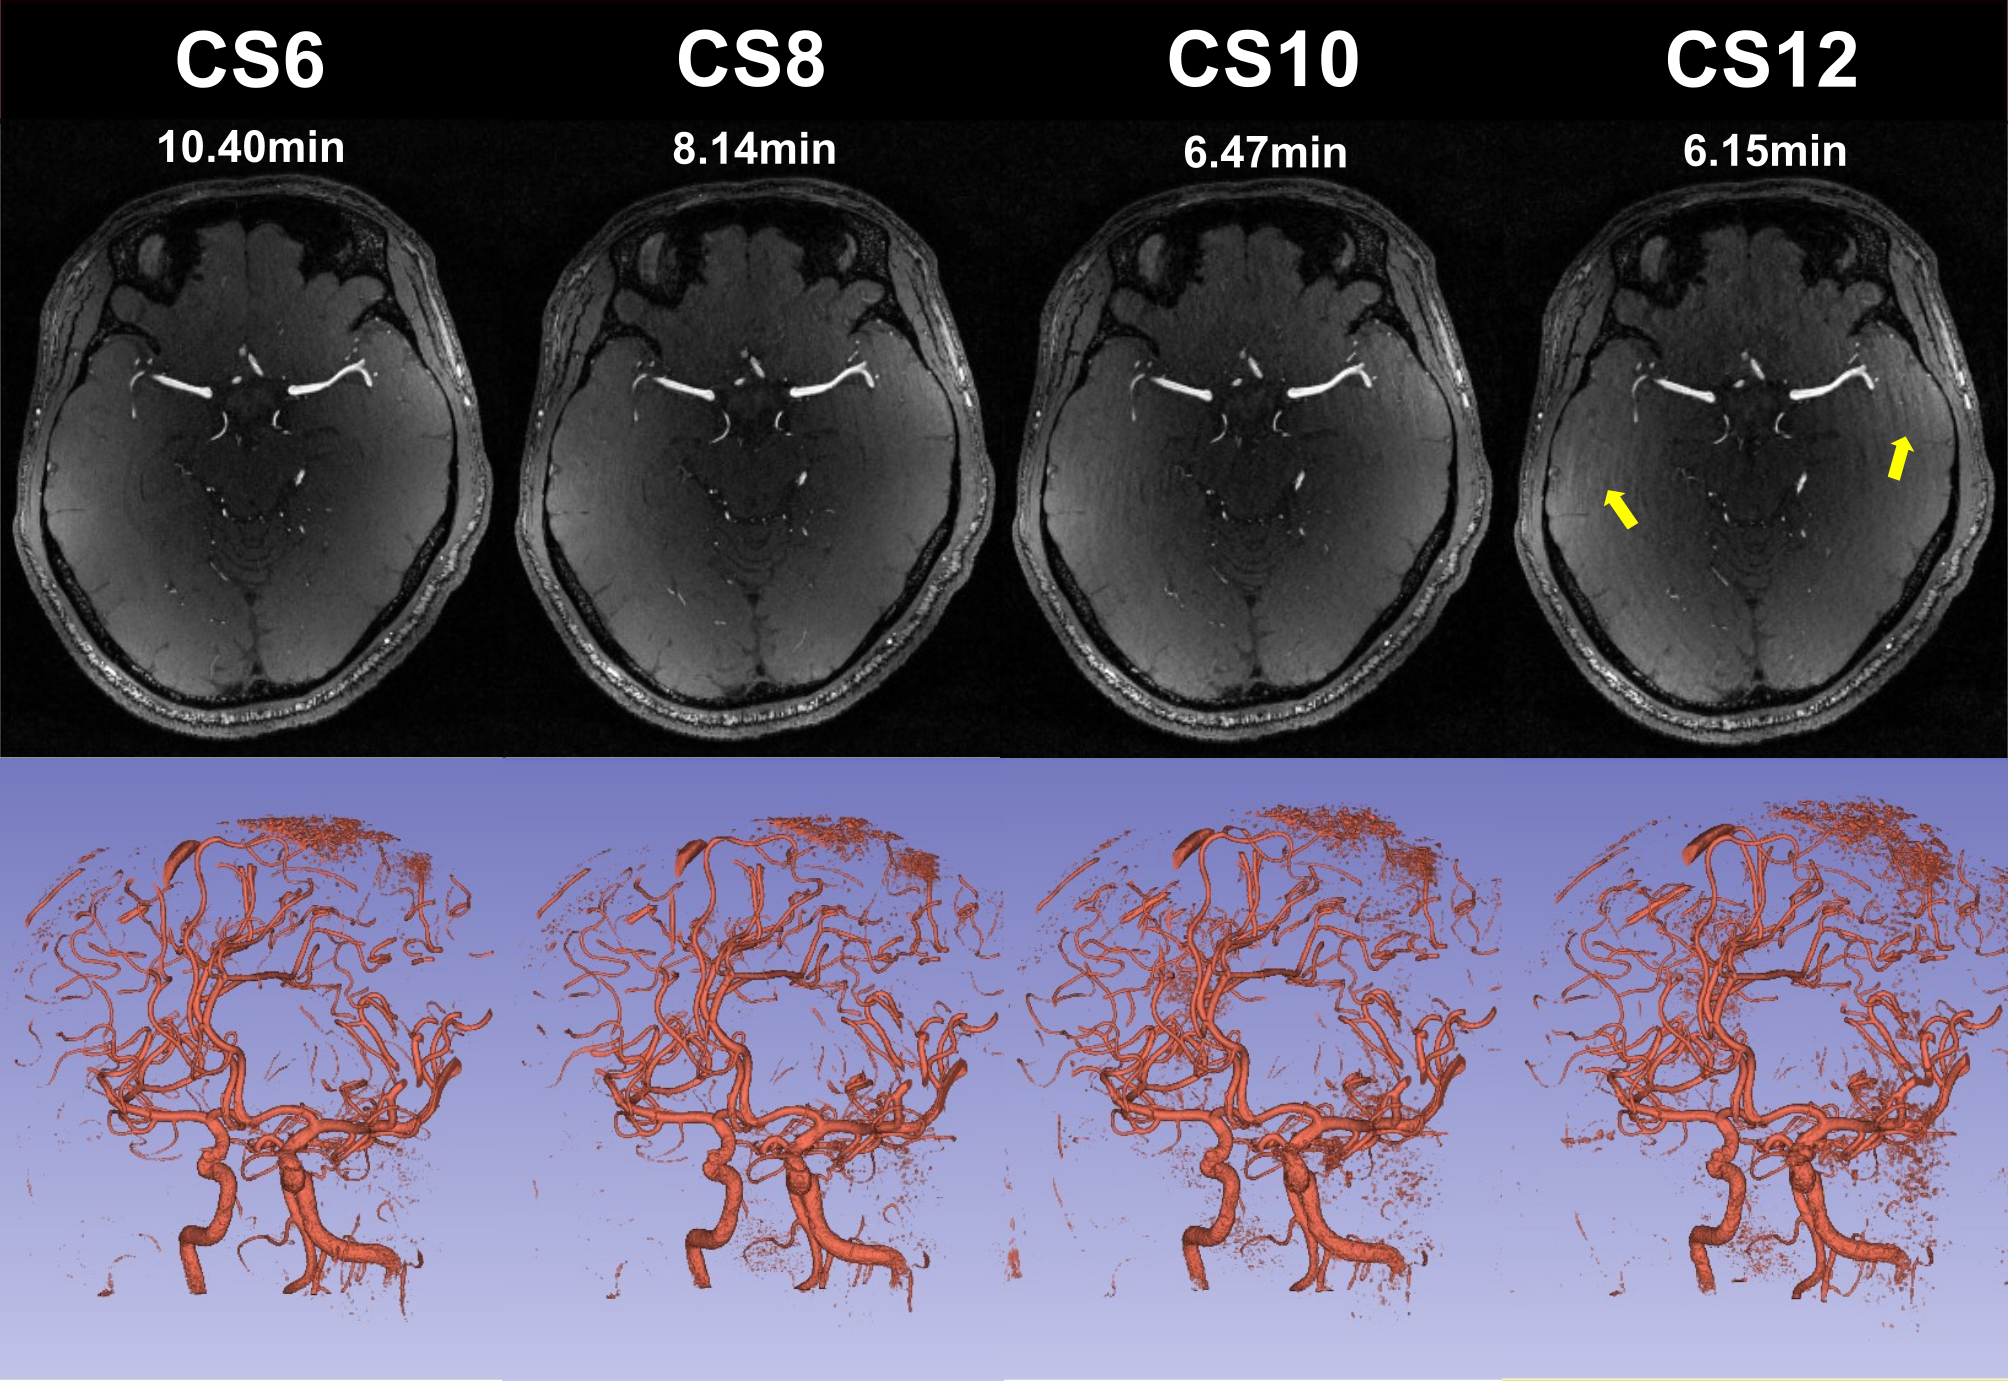
Figure 1:
Transversal TOF images obtained from compressed sensing (CS)
reconstructions 6, 8, 10, 12 (top) and the corresponding volume renderings
(bottom). Arrows indicate aliasing artifacts that appear in the background
signal at higher resolution.
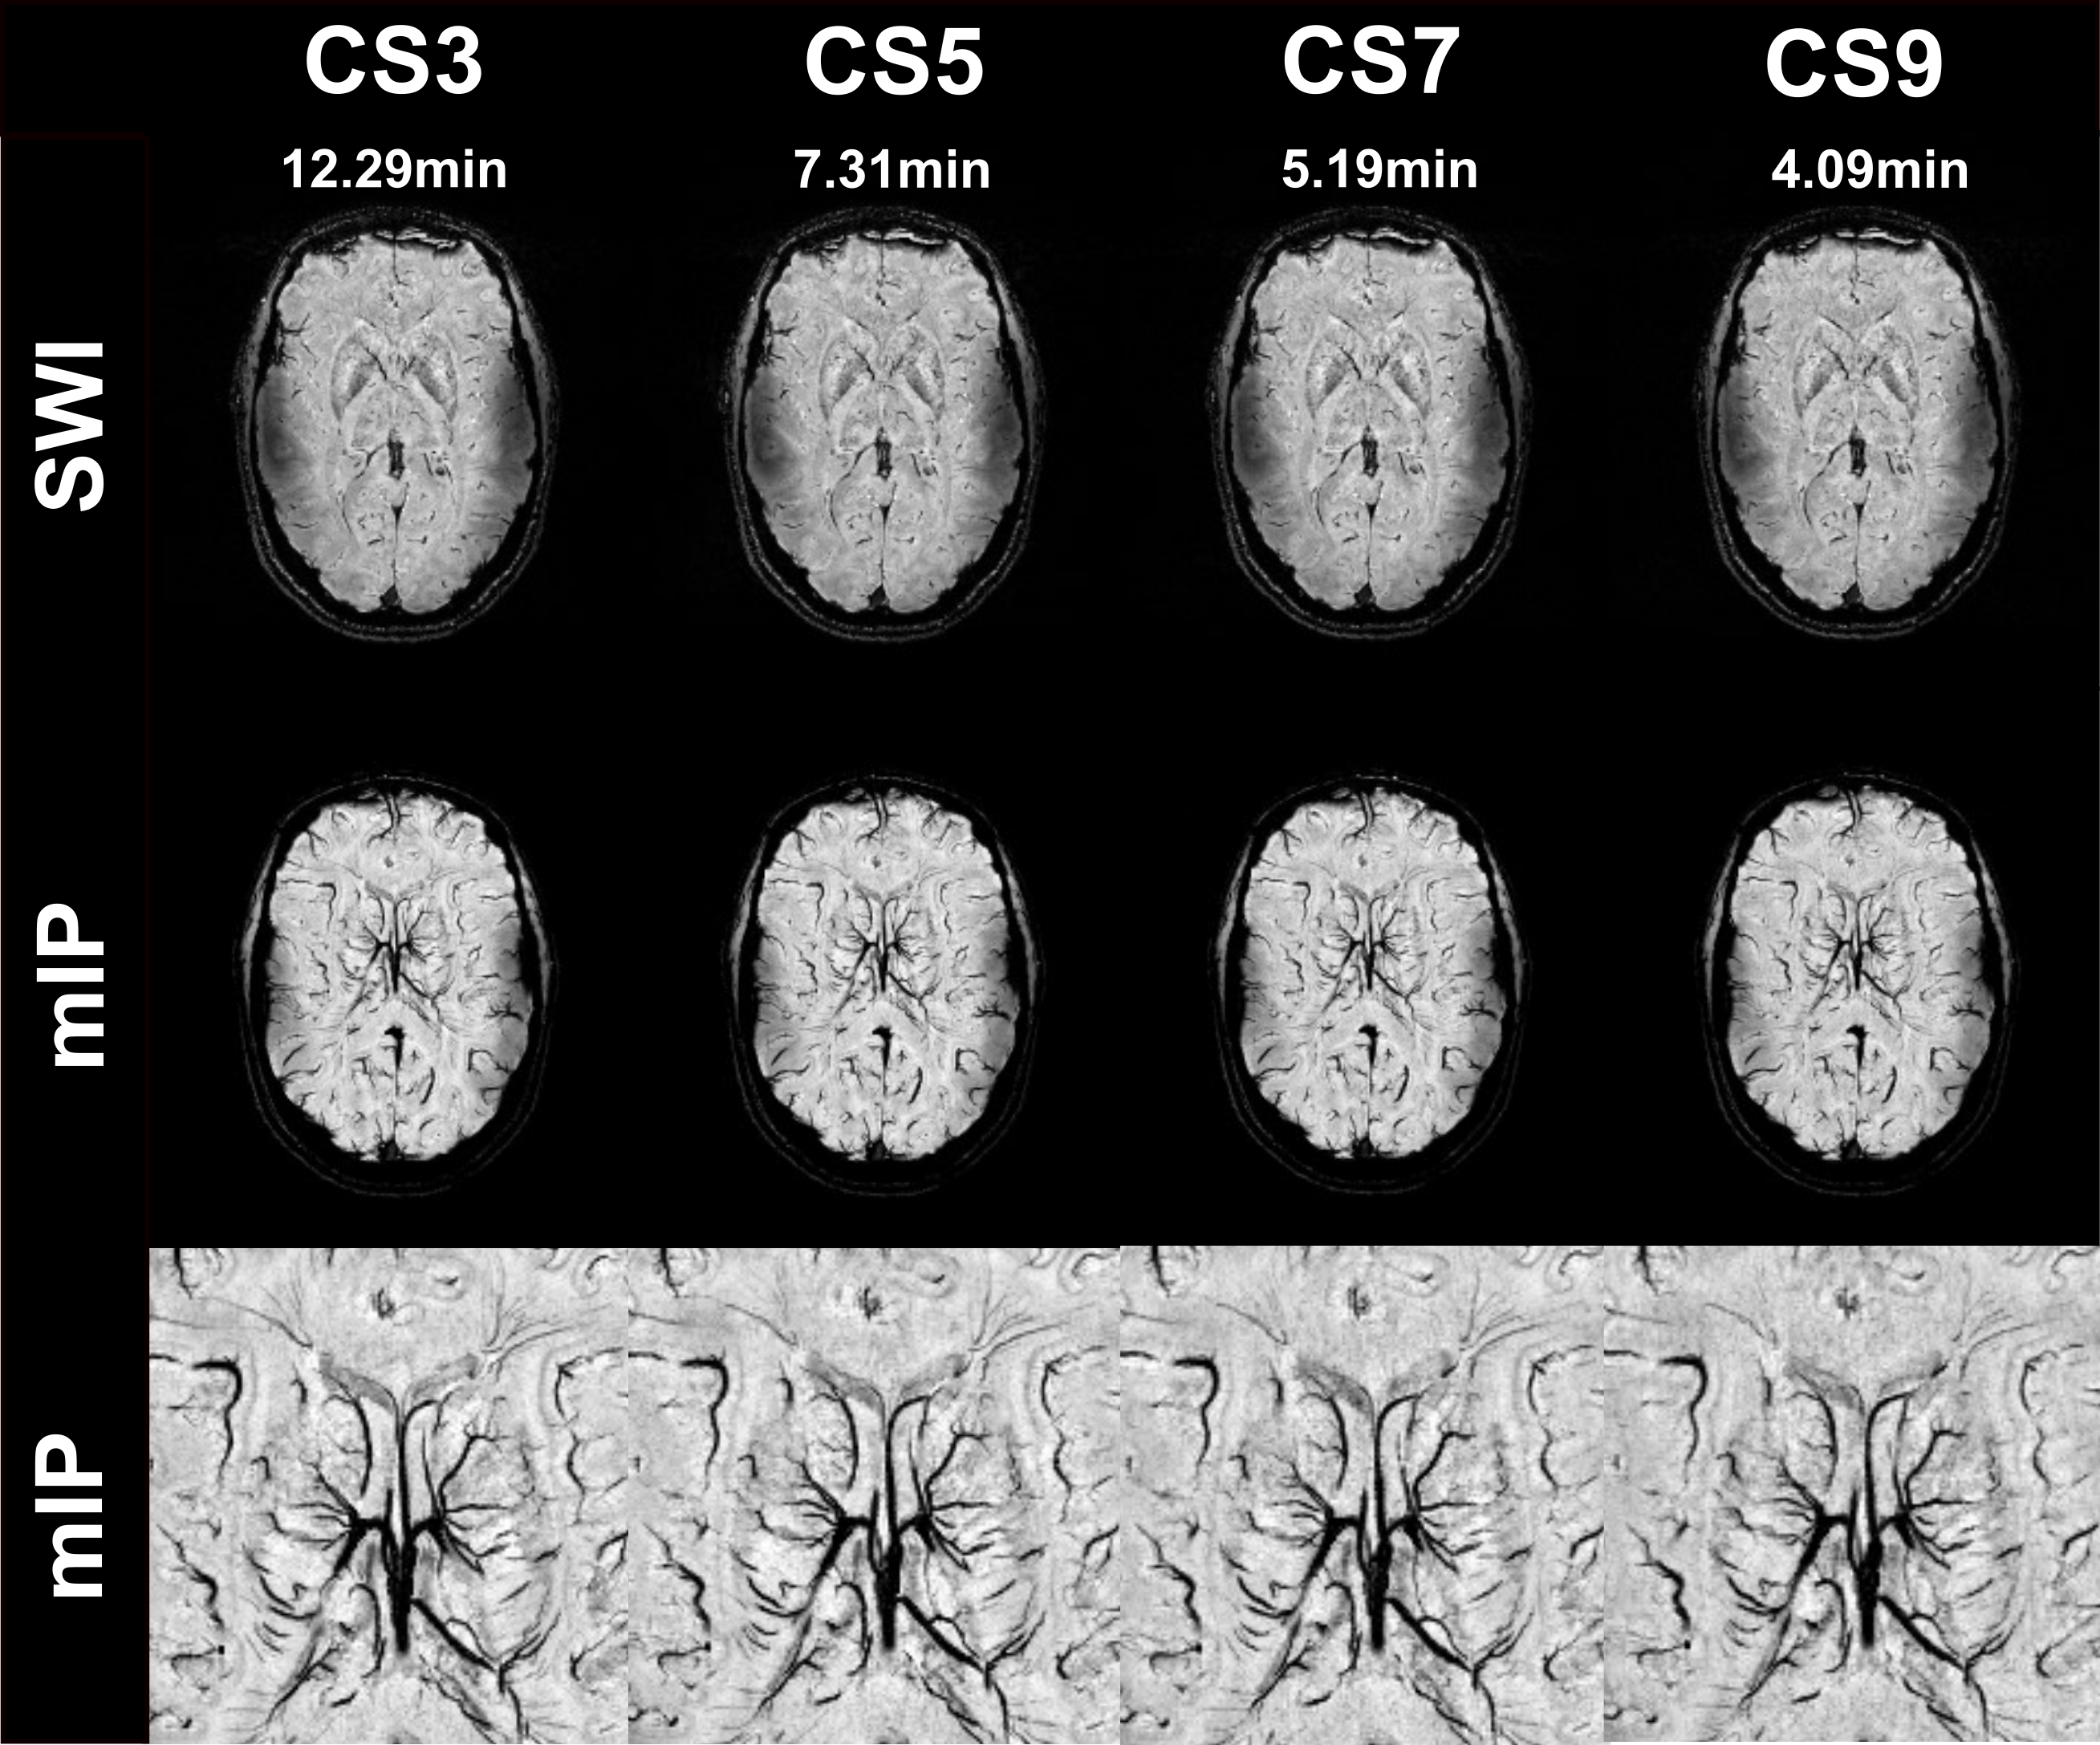
Figure 2:
Transversal SW images obtained from compressed sensing (CS)
reconstructions 3, 5, 7, 9 (top), corresponding minimum intensity projections
(mIP) (middle), and a zoomed minimum intensity projection for a region of
interest (bottom).
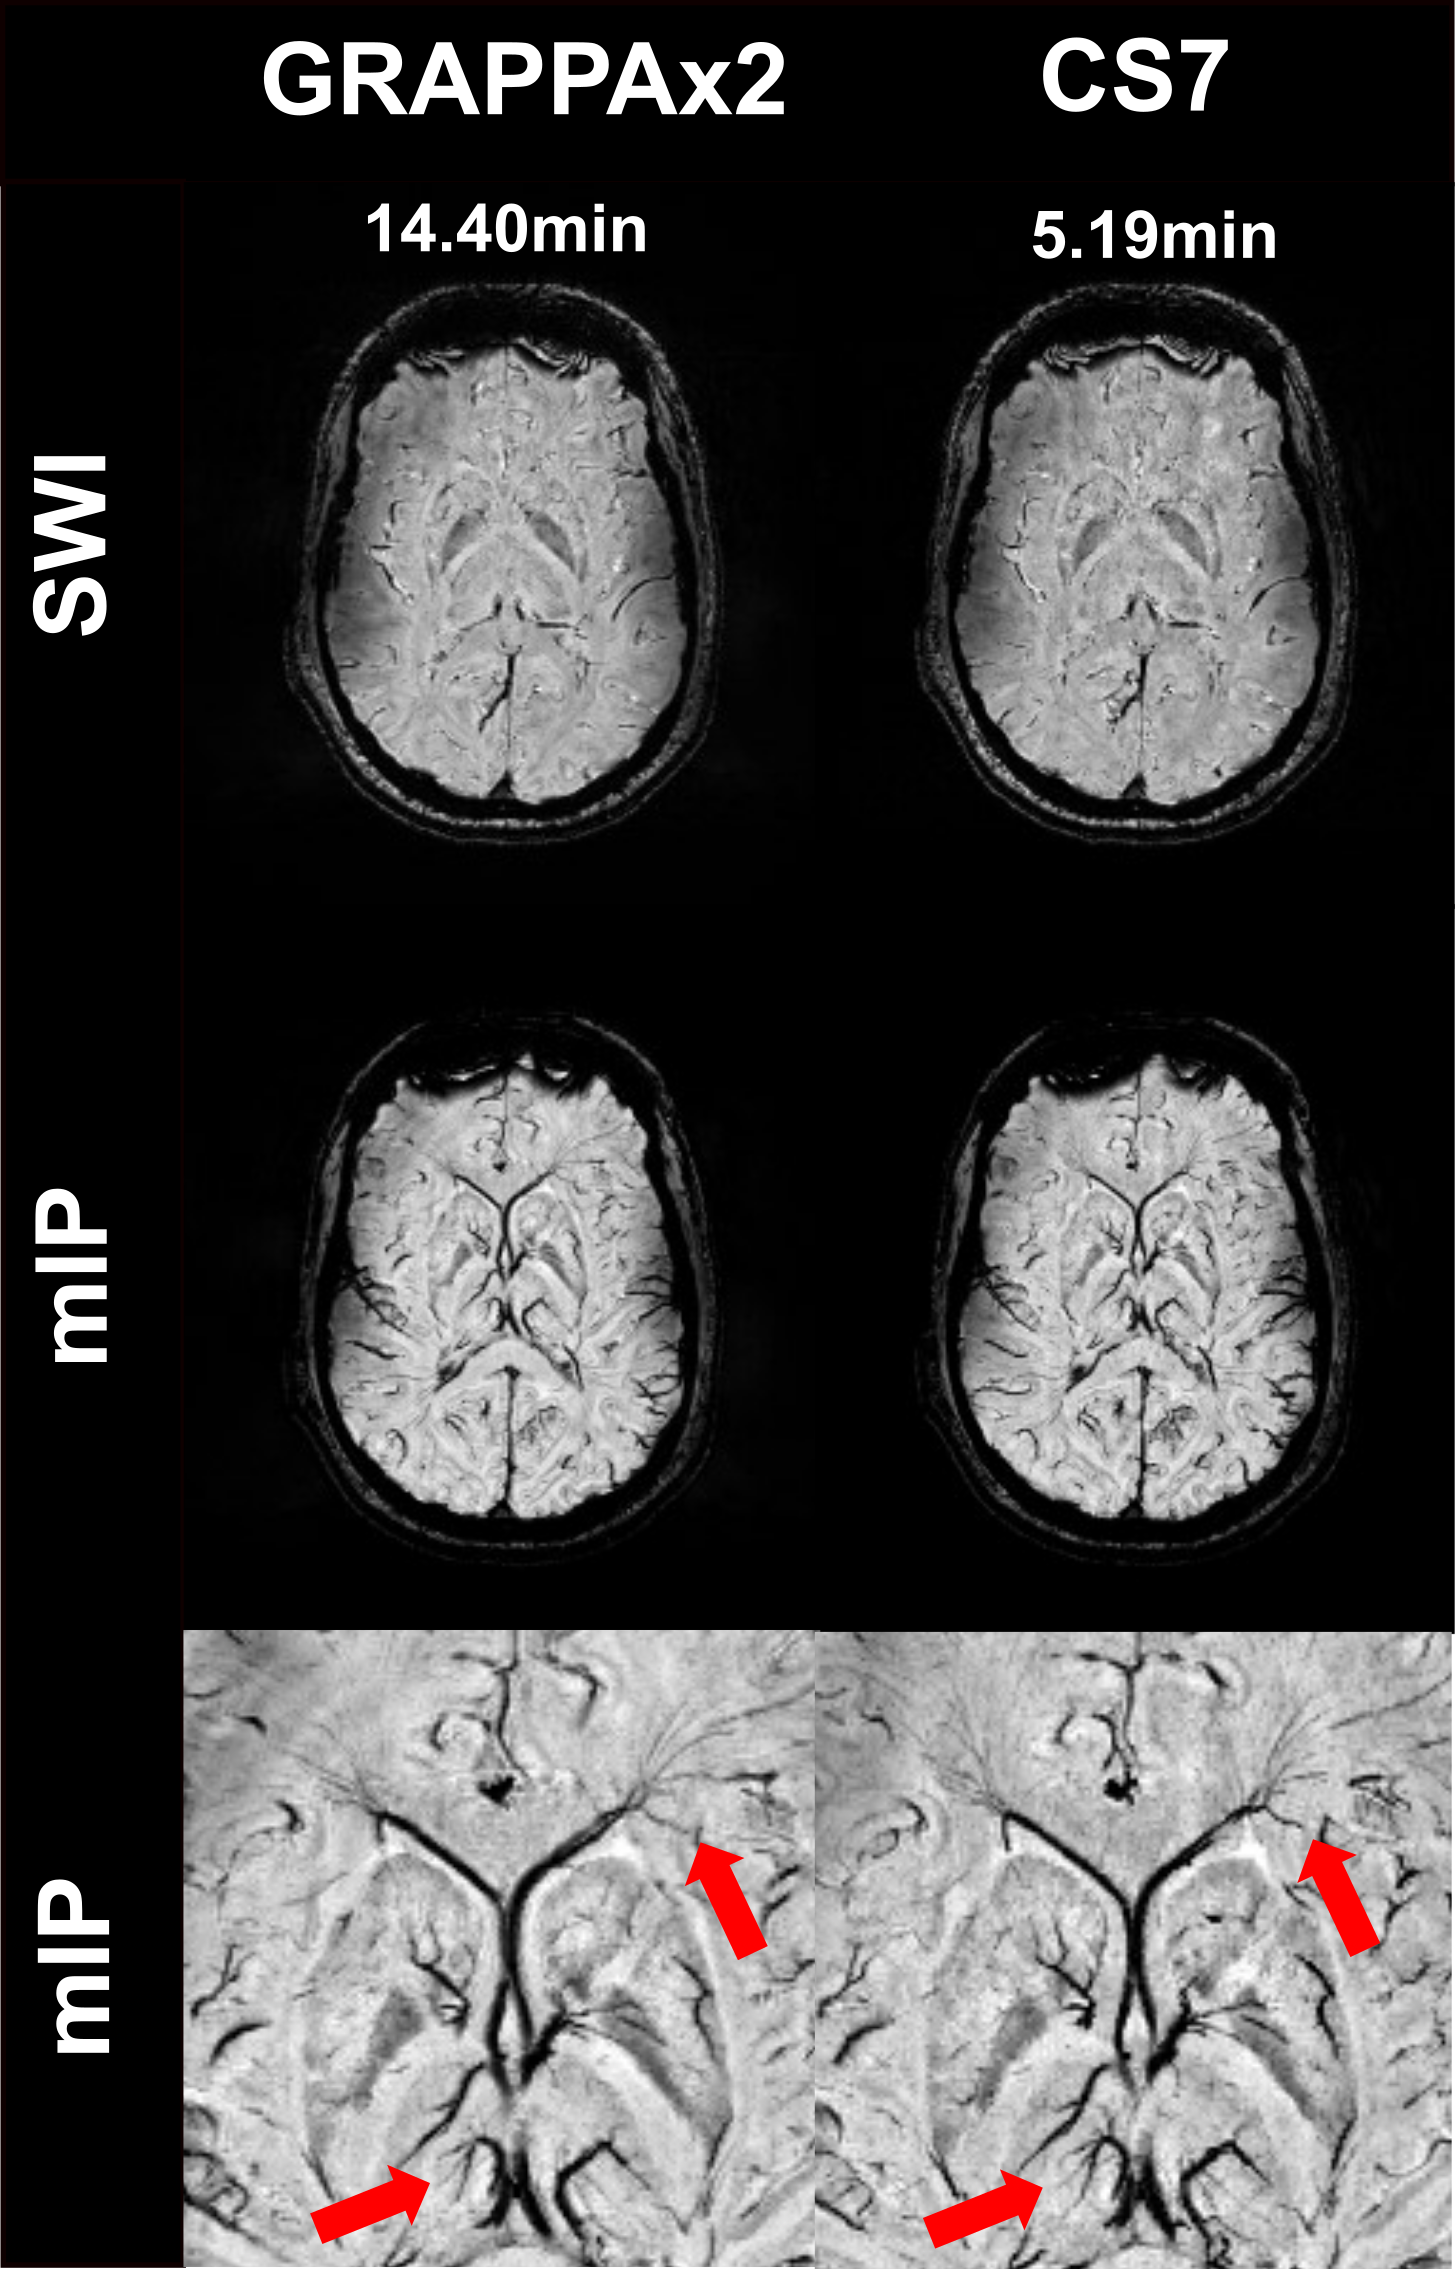
Figure 3:
Transversal SW images obtained from GRAPPAx2 and CSx7 reconstructions
(top) with corresponding minimum intensity projections (mIP) (bottom).
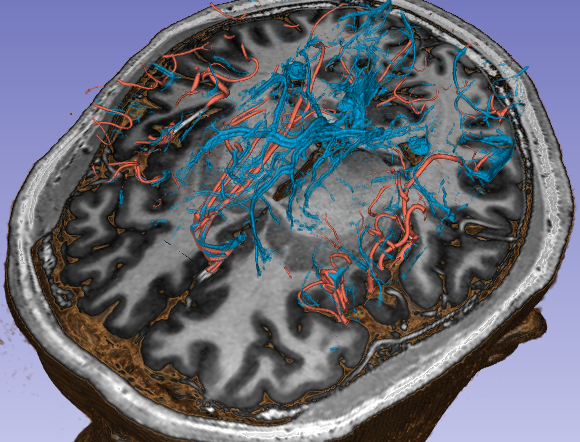
Figure 4:
Combination of volume renderings from CS TOF and CS SWI acquisitions
acquired with acceleration factor 6 and 7, respectively. Arteries (i.e.,
hyperintensities in TOF) are shown in red and veins (i.e., hypointensities in
SWI) are shown in blue. The vessel volume renderings are shown on a brain image
obtained from a CS-MP2RAGE acquisition.
DOI: https://doi.org/10.58530/2022/1388