1385
Assessment of Fat Fractions of Tongues, Pharyngeal Walls, and Soft Palates by GOOSE and DIXON methods1Diagnostic Imaging, St Jude Children's Research Hospital, Memphis, TN, United States, 2Department of Radiology, Penn State Health Milton S Hershey Medical Center, Hershey, PA, United States, 3Research Imaging NSW, University of New South Wales, Sydney, Australia, 4Division Nursing Research, St Jude Children's Research Hospital, Memphis, TN, United States, 5Department of Epidemiology and Cancer Control, St Jude Children's Research Hospital, Memphis, TN, United States
Synopsis
Among 63 participants, the fat fractions (FFs) were estimated and compared in tongues, posterior pharyngeal walls (PPWs), and soft palates (SPs) using two-point DIXON and GOOSE (Globally Optimal Surface Estimation) methods. DIXON was seriously impaired by B0 inhomogeneity and underestimated FF relative GOOSE. There was a strong correlation between these two methods in the tongues and SPs, and a weak one in the PPWs. In our opinion, an IDEAL-based method is preferred for estimating fat content. Extra attention is needed when using the two-point DIXON method.
INTRODUCTION
The fat fraction (FF) of the tongue and muscles surrounding the airway may elucidate mechanisms of obstructive sleep apnea; therefore, there is increased interest in MRI quantification of the FF of the tongue and airway muscles1–5. The two-point DIXON method has previously been used to quantify the FF1-4, but is a semi-quantitative method that is susceptible to B0 field offset/inhomogeneities6. Ideally, a quantitative method, such as iterative decomposition of water and fat with echo asymmetry and least-squares estimation (IDEAL) methods, is preferable to measure FF. FF was quantified by a three-point IDEAL acquisition in 28 human subjects in 20087. However, this method may be hindered by the fat water phase swaps on neck and tongue images. Fat-water decomposition using globally optimal surface estimation (GOOSE)8 provides a means to circumvent the challenge of fat water phase swaps. The method was validated with 2012 ISMRM Challenge dataset and is robust to yield FF estimation8. In this study, the FF of the tongue, posterior pharyngeal wall (PPW), and soft palate (SP) were measured and compared using the six-point GOOSE and two-point DIXON methods.METHODS
Imaging protocols were approved by the local Institutional Review Board, and written informed consent was obtained from participants. Analyses were conducted on 63 healthy adult participants (39 Female; age = 41.0 ± 9.6 years). Six participants were excluded from analyses of tongue FF due to dental implant artifacts. A custom pulse sequence called dual shot GRE (gradient echo) was used, which includes two interleaved GRE sequences to reduce the effective echo spacing. The tongue and neck were imaged by the dual shot GRE and DIXON VIBE (Volumetric Interpolated Breath-hold Examination) sequences using 3T Siemens MRI scanners. The following measurement parameters were used: DIXON: TR = 5.76 s, two echoes with TE1 = 2.46 ms and TE2= 3.69 ms, and voxel size = 1 × 1 × 1 mm3; GRE: TR = 10 s, 6 echoes with TE1 = 1.7 ms and ΔTE = 1.19 ms, voxel size = 2 × 2 × 2 mm3. In the DIXON method, FF was estimated by using If/(Iw + If), where Iw and If were water and fat images, respectively6. In the GOOSE method, FF was estimated by using a MATLAB program available online (research.engineering.uiowa.edu/cbig/content/goose). Tongue, PPW, and SP ROIs were drawn on DIXON water images using Vitrea (www.vitalimages.com, see Fig. 1). GOOSE FF maps were coregistered to DIXON FF maps via dual shot GRE images and DIXON in-phase images using SPM12 (www.fil.ion.ucl.ac.uk/spm). The same ROIs were used for both GOOSE and DIXON. The volumes of the tongue, PPW, and SP ROIs were also measured.RESULTS
Fig. 2 shows the FF maps generated by GOOSE and DIXON for the tongue, PPW, and SP overlaid on a VIBE water image for a participant. The mean FF values were 9.9%/6.4% (GOOSE/DIXON) for the tongue. 10.6%/6.7% (GOOSE/DIXON) for the PPW, and 9.3%/8.1% (GOOSE/DIXON) for SP. Means and standard deviations of FF and volume for all participants are listed in Table 1. The tongue volume measured in this study is 75.2±15.2 cm3, which is consistent with previous studies9, 10. The mean DIXON FFs were lower for all three ROIs. Fig. 3 shows the relationship between FFs estimated using GOOSE and DIXON, along with 95% confidence intervals, for the tongue (top), SP (middle), and PPW (bottom). Very strong correlations were found between GOOSE and DIXON in tongues (R2 = 0.87) and SPs (R2 = 0.63), respectively, but the correlation was weak in PPW (R2 = 0.36). The slopes were 0.7 for tongue and SP, and 0.5 for PPW.DISCUSSION
Although the semi-quantitative DIXON method has been used to assess the fat fraction of tongues1–4, it has not been systematically validated with IDEAL based methods. Our study shows that DIXON underestimates FF relative to GOOSE with slopes of 0.7 for tongue and SP, and 0.5 for PPW. It is well known that the FF estimation by two-point DIXON is severely affected by B0 field offset/inhomogeneities6. B0 inhomogeneity, and hence susceptibility, varies greatly in the PPW because of the thin volume adjacent to the airway. As a result, the estimated FFs of the PPW as measured by DIXON and GOOSE are weakly correlated. The FF of the tongue was strongly correlated between DIXON and GOOSE approaches. While the DIXON approach may be fine for FF of the tongues for relative comparison1–4, it is not appropriate for the PPW. Caution must be taken because DIXON FF values are substantially biased depending on the tissues being measured and their surroundings. In general, the FF maps of DIXON are smoother than those of GOOSE as shown in Fig. 2, mainly because an FF map is simply a ratio of fat image and in-phase image, but fitting is performed in GOOSE for accurate estimation of FFsCONCLUSIONS
We measured and compared DIXON and GOOSE for fat fraction quantification in tongues, soft palates and posterior pharyngeal walls. DIXON was seriously impaired by B0 inhomogeneity and underestimated FF relative to GOOSE in the tissues we studied. For estimating fat fraction, an IDEAL based method using complex data is preferred. Extra consideration must be paid when using the two-point DIXON method.Acknowledgements
We acknowledge grant funding R01CA215405 from the National Cancer Institute and ALSAC.
References
1. Wang SH, Keenan BT, Wiemken A, et al. Effect of weight loss on upper airway anatomy and the apnea–hypopnea index the importance of tongue fat. Am. J. Respir. Crit. Care Med. 2020;201:718–727 doi: 10.1164/rccm.201903-0692OC.
2. Kim AM, Keenan BT, Jackson N, et al. Tongue fat and its relationship to obstructive sleep apnea. Sleep 2014;37:1639-1648D doi: 10.5665/sleep.4072.
3. Richardson A. Effect of upper airway fat on tongue dilation during inspiration in awake people with obstructive sleep apnea. Biomedgerontology 2020:1–10.
4. Nakao Y, Yamashita T, Honda K, et al. Association Among Age-Related Tongue Muscle Abnormality, Tongue Pressure, and Presbyphagia: A 3D MRI Study. Dysphagia 2021;36:483–491 doi: 10.1007/s00455-020-10165-4.
5. Reeder SB, Pineda AR, Wen Z, et al. Iterative decomposition of water and fat with echo asymmetry and least-squares estimation (IDEAL): Application with fast spin-echo imaging. Magn. Reson. Med. 2005;54:636–644 doi: 10.1002/mrm.20624.
6. Ma J. Dixon techniques for water and fat imaging. J. Magn. Reson. Imaging 2008;28:543–558 doi: 10.1002/jmri.21492.
7. Humbert IA, Reeder SB, Porcaro EJ, Kays SA, Brittain JH, Robbins J. Simultaneous estimation of tongue volume and fat fraction using IDEAL-FSE. J. Magn. Reson. Imaging 2008;28:504–508 doi: 10.1002/jmri.21431.
8. Cui C, Wu X, Newell JD, Jacob M. Fat water decomposition using globally optimal surface estimation (GOOSE) algorithm. Magn. Reson. Med. 2015;73:1289–1299 doi: 10.1002/mrm.25193.
9. Lauder R, Muhl ZF, Lauder, Robert; Muhl Z. Estimation of tongue volume from magnetic resonance imaging. Angle Orthod. 1991;61:175–184 doi: 10.1043/0003-3219(1991)061<0175:EOTVFM>2.0.CO;2.
10. Liégeois F, Albert A, Limme M. Comparison between tongue volume from magnetic resonance images and tongue area from profile cephalograms. Eur. J. Orthod. 2010;32:381–386 doi: 10.1093/ejo/cjp105.
Figures

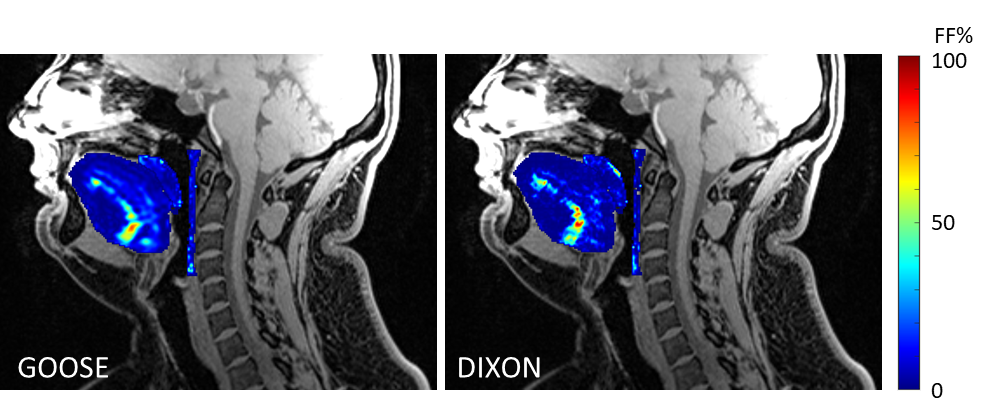
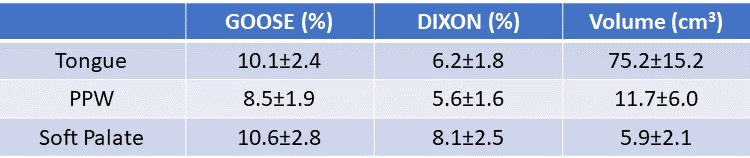
Table 1. Mean and standard deviation of fat fractions and volumes measured by GOOSE and DIXON . PPW: Posterior Pharyngeal wall

Fig. 3. The correlation plots of fat fractions measured by DIXON and GOOSE in tongues, soft palate and posterior pharyngeal walls.