1384
Multi-delay pseudo-continuous arterial spin labeling in head and neck healthy tissues1Department of Radiotherapy, Erasmus MC Cancer Institute, Rotterdam, Netherlands, 2Department of Radiology and Nuclear Medicine, Erasmus MC, Rotterdam, Netherlands, 3Department of Medical Physics and Informatics, HollandPTC, Delft, Netherlands
Synopsis
Arterial spin labeling (ASL) has potential for response prediction of tumor and healthy tissue in the head and neck region after radiotherapy. Since little is known about blood flow (BF) values in this region, we measured BF and the repeatability of BF in several tissues simultaneously using multi-delay pseudo-continuous ASL. This enables investigation of the correlation between perfusion and severity of radiotherapy side-effects in a future study. Of the tissues we assessed, we found the parotids have the highest and the tonsils have the lowest perfusion.
Introduction
Recently, the potential value of measuring perfusion with arterial spin labeling (ASL) in the head and neck (H&N) region has been demonstrated for detection, characterization, and early treatment response assessment after (chemo-)radiotherapy of head and neck tumors1-7. Additionally, blood flow (BF) obtained from ASL could be a potential imaging biomarker for predicting radiotherapy side-effects. However, little is known about BF values in the organs at risks involved in these side effects. Therefore, the aim of this study is to measure the values and repeatability of BF with ASL in several healthy tissues in the H&N region.Methods
Nine healthy subjects were scanned on a 3T MR750 Discovery with a 12 channel H&N coil (GE Healthcare, Waukesha, WI). The scan protocol consisted of 3D MAGiC8 (0.5x0.5x2 mm3 voxels, scan time 4 min 4 s) and four repeats of three-delay pseudo-continuous ASL (pCASL) (Post-labeling delay (PLD): 1000, 1634, 2483 ms, Labeling Duration (LD): 3000 ms, 2x2x4 mm3 voxels, 26 slices, scan time 5-7 min). For the ASL acquisition, the most caudal slice of the acquisition was placed on the chin to ensure the labeling plane, which is automatically placed 2 cm below the most caudal slice, was situated in the neck area (Figure 1). The ASL acquisition yielded a perfusion weighted (control-labeled) image for each PLD and a saturation recovery image. The 3D MAGiC acquisition yielded synthetic T1-weighted (T1w), T2-weighted (T2w) and proton density weighted (PDw) images, and a T1 map. The synthetic T1w and T2w images were used to manually delineate the tissues of interest: the parotid and submandibular glands, and the tonsils. For reference purposes, a region of interest (ROI) was also placed in the cerebellum. For each of the ASL acquisitions, the saturation recovery image was rigidly registered to the synthetic PDw image and the ROIs were propagated to the ASL image. To minimize the contribution of any delineation or registration uncertainty all ROIs were eroded by 2 mm in 3D.ASL BF was quantified voxel-wise for each tissue ROI by fitting the following equation:
$$BF=\frac{6000\lambda e^{\delta/T1_a}}{2\varepsilon T1_t(e^{-\frac{max(PLD-\delta,0)}{T1_t}}-e^{-\frac{max(LD+PLD-\delta ,0)}{T1_t}})}\frac{SI_{PW}}{\frac{SI_{SR}}{S_c}}$$
Where SIPW is the signal intensity of the perfusion weighted image and SISR is the signal intensity in the 2 second saturation recovery image, which is scaled by a factor $$$S_c=1-e^{-\frac{2}{T1_t}}$$$ to correct for partial signal recovery. δ is the arterial transit time that is estimated by the signal weighted delay method9. λ is the blood-tissue partition coefficient, which is set to 1 g/ml10. ε is a correction factor to account for labeling efficiency and background suppression and is set to 0.6 conform manufacturer guidelines. T1a is the T1 of arterial blood and is set to 1664 ms11,12. T1t is the T1 of tissue and was taken voxel-wise from the T1 map obtained from MAGiC. Next, the mean BF was determined in each ROI of each repeated acquisition, unless the ROI contained >20% negative voxels, in which case it was deemed corrupted and not taken into account in further analyses. Subsequently, the overall mean over the repeats was determined per volunteer and the within subject coefficient of variation (wCV) was determined for each ROI. Additionally, the T1 values of the tissues are reported.
Results
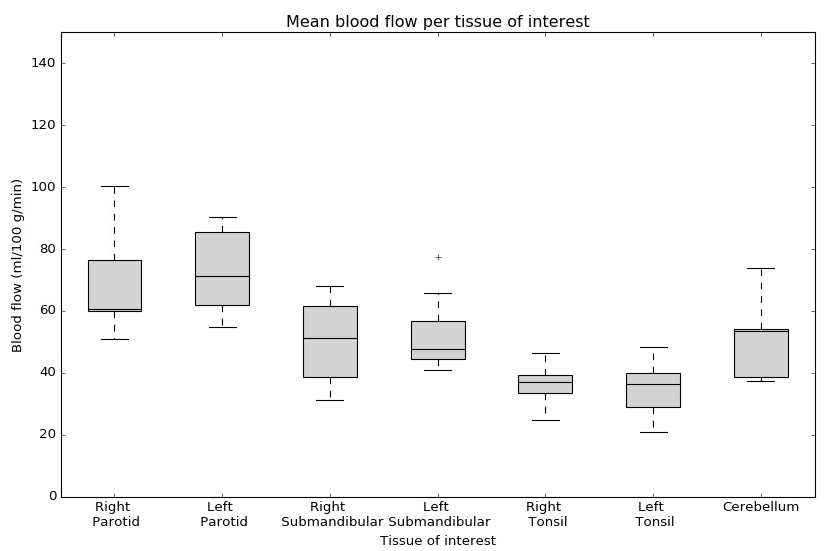
Figure 2 shows an example of a synthetic T2w image, T1 map, and BF map overlayed on a synthetic T2w image with the ROIs indicated. As shown in Figure 3, mean BF over the parotid glands ranged from 51 to 100 ml/100 g/min, mean BF of the submandibular glands was slightly lower at 31 to 77 ml/100 g/min, and the mean BF in tonsils ranged from 21 to 48 ml/100 g/min. The wCV was 16% for both parotid glands, 19% for both submandibular glands, and 18% and 22% for the right and left tonsil respectively. The cerebellum (control) had a BF range from 37 to 74 ml/100 g/min and a wCV of 9%. Figure 4 shows the mean T1 per tissue of interest, which ranged from 916 to 1521 ms for the parotid glands, from 1075 to 1755 ms for the submandibular glands, from 1902 to 2551 ms for the tonsils, and from 1282 to 1678 ms for the cerebellum.Discussion
For BF and T1, boxplots show similar values for both parotid glands, both submandibular glands and both tonsils, as expected. Additionally, the BF and T1 we measured in the cerebellum is in the same range as reported in literature for grey matter13,14. The wCV in all tissues in the H&N is notably larger than in the cerebellum. This might be caused by motion that is affecting this region, especially the tonsils and submandibular glands. Motion correction for ASL would be an interesting topic for further research. Nevertheless, we can distinguish differences in perfusion according to tissue.Conclusion
Using multi-delay pCASL it is possible to assess BF in several tissues in the H&N simultaneously. This enables investigation of the correlation between perfusion and severity of radiotherapy side-effects in a future study. Of the tissues we assessed, we found the parotids to have the highest perfusion (range 51-100 ml/100 g/min), followed by the submandibular glands (range 31-77 ml/100 g/min), while the tonsils (range 21-48 ml/100 g/min) showed the lowest perfusion.Acknowledgements
No acknowledgement found.References
1. Fujima N, Kudo K, Yoshida D, et al. Arterial spin labeling to determine tumor viability in head and neck cancer before and after treatment. J Magn Reson Imaging. 2014;40:920-928.
2. Fujima N, Yoshida D, Sakashita T, et al. Usefulness of Pseudocontinuous Arterial Spin-Labeling for the Assessment of Patients with Head and Neck Squamous Cell Carcinoma by Measuring Tumor Blood Flow in the Pretreatment and Early Treatment Period. AJNR Am J Neuroradiol. 2016;37:342-348.
3. Kato H, Kanematsu M, Watanabe H, et al. Perfusion imaging of parotid gland tumours: usefulness of arterial spin labeling for differentiating Warthin's tumours. Eur Radiol. 2015;25:3247-3254.
4. Yamamoto T, Kimura H, Hayashi K, Imamura Y, Mori M. Pseudo-continuous arterial spin labeling MR images in Warthin tumors and pleomorphic adenomas of the parotid gland: qualitative and quantitative analyses and their correlation with histopathologic and DWI and dynamic contrast enhanced MRI findings. Neuroradiology. 2018;60:803-812.
5. Abdel Razek AAK, Helmy E. Multi-parametric arterial spin labeling and diffusion-weighted imaging in differentiation of metastatic from reactive lymph nodes in head and neck squamous cell carcinoma. Eur Arch Otorhinolaryngol. 2020.
6. Abdel Razek AAK, Nada N. Arterial spin labeling perfusion-weighted MR imaging: correlation of tumor blood flow with pathological degree of tumor differentiation, clinical stage and nodal metastasis of head and neck squamous cell carcinoma. Eur Arch Otorhinolaryngol. 2018;275:1301-1307.
7. Li Y, Li X, Yu X, et al. Investigating the value of arterial spin labeling and intravoxel incoherent motion imaging on diagnosing nasopharyngeal carcinoma in T1 stage. Cancer Imaging. 2020;20:62.
8. Tanenbaum LN, Tsiouris AJ, Johnson AN, et al. Synthetic MRI for Clinical Neuroimaging: Results of the Magnetic Resonance Image Compilation (MAGiC) Prospective, Multicenter, Multireader Trial. AJNR Am J Neuroradiol. 2017;38:1103-1110.
9. Dai W, Robson PM, Shankaranarayanan A, Alsop DC. Reduced resolution transit delay prescan for quantitative continuous arterial spin labeling perfusion imaging. Magn Reson Med. 2012;67:1252-1265.
10. Fujima N, Kudo K, Tsukahara A, et al. Measurement of tumor blood flow in head and neck squamous cell carcinoma by pseudo-continuous arterial spin labeling: comparison with dynamic contrast-enhanced MRI. J Magn Reson Imaging. 2015;41:983-991.
11. Alsop DC, Detre JA, Golay X, et al. Recommended implementation of arterial spin-labeled perfusion MRI for clinical applications: A consensus of the ISMRM perfusion study group and the European consortium for ASL in dementia. Magn Reson Med. 2015;73:102-116.
12. Lu H, Clingman C, Golay X, van Zijl PC. Determining the longitudinal relaxation time (T1) of blood at 3.0 Tesla. Magn Reson Med. 2004;52:679-682.
13. Hales PW, Kawadler JM, Aylett SE, Kirkham FJ, Clark CA. Arterial spin labeling characterization of cerebral perfusion during normal maturation from late childhood into adulthood: normal 'reference range' values and their use in clinical studies. J Cereb Blood Flow Metab. 2014;34:776-784.
14. Zavala Bojorquez J, Bricq S, Acquitter C, Brunotte F, Walker PM, Lalande A. What are normal relaxation times of tissues at 3 T? Magn Reson Imaging. 2017;35:69-80.
Figures