1377
Efficient Dixon-Based 3D Fast Spin-Echo MR Neurography of Lumbosacral Plexus1Radiology and Biomedical Imaging, University of California, San Francisco, San Francisco, CA, United States, 2Center for Digital Health Innovation, University of California, San Francisco, San Francisco, CA, United States
Synopsis
MR neurography (MRN) provides direct visualization of peripheral nerves and allows for detecting pathologies. Isotropic 3D MRN has been suggested as an effective method to evaluate overall nerve structures and subtle morphological changes; however, its clinical applications to the lumbosacral plexus have been limited. In this work, we optimized 3D FSE acquisition combined with a Dixon fat-water separation technique to provide uniform signal over the large volume and to suppress vessel signal. In vivo experiments with patients having a lower back pain at 3T demonstrated the clinical feasibility of using the proposed methods for evaluating nerve pathologies.
Introduction
The lumbosacral plexus is a complex network of nerves, which provides both motor and sensory innervation to various structures in the pelvis and lower extremities. MR neurography (MRN), performed primarily by using fat-suppressed T2-weighted imaging, provides direct visualization of nerves and allows for detecting peripheral nerve pathologies based on alterations of nerve signal and caliber1-2. In particular, isotropic 3D MRN has been suggested as an effective method to evaluate overall nerve structures and subtle morphological changes3-5. However, its clinical applications to lumbosacral plexus have been limited due to a lower in-plane spatial resolution than conventional 2D MRN and signal inhomogeneity over a large volume6. In this work, we demonstrated the clinical feasibility of an optimized 3D fast spin-echo (FSE) sequence combined with a Dixon fat-water separation technique7-8 to evaluate pathologies in the lumbosacral plexus.Methods
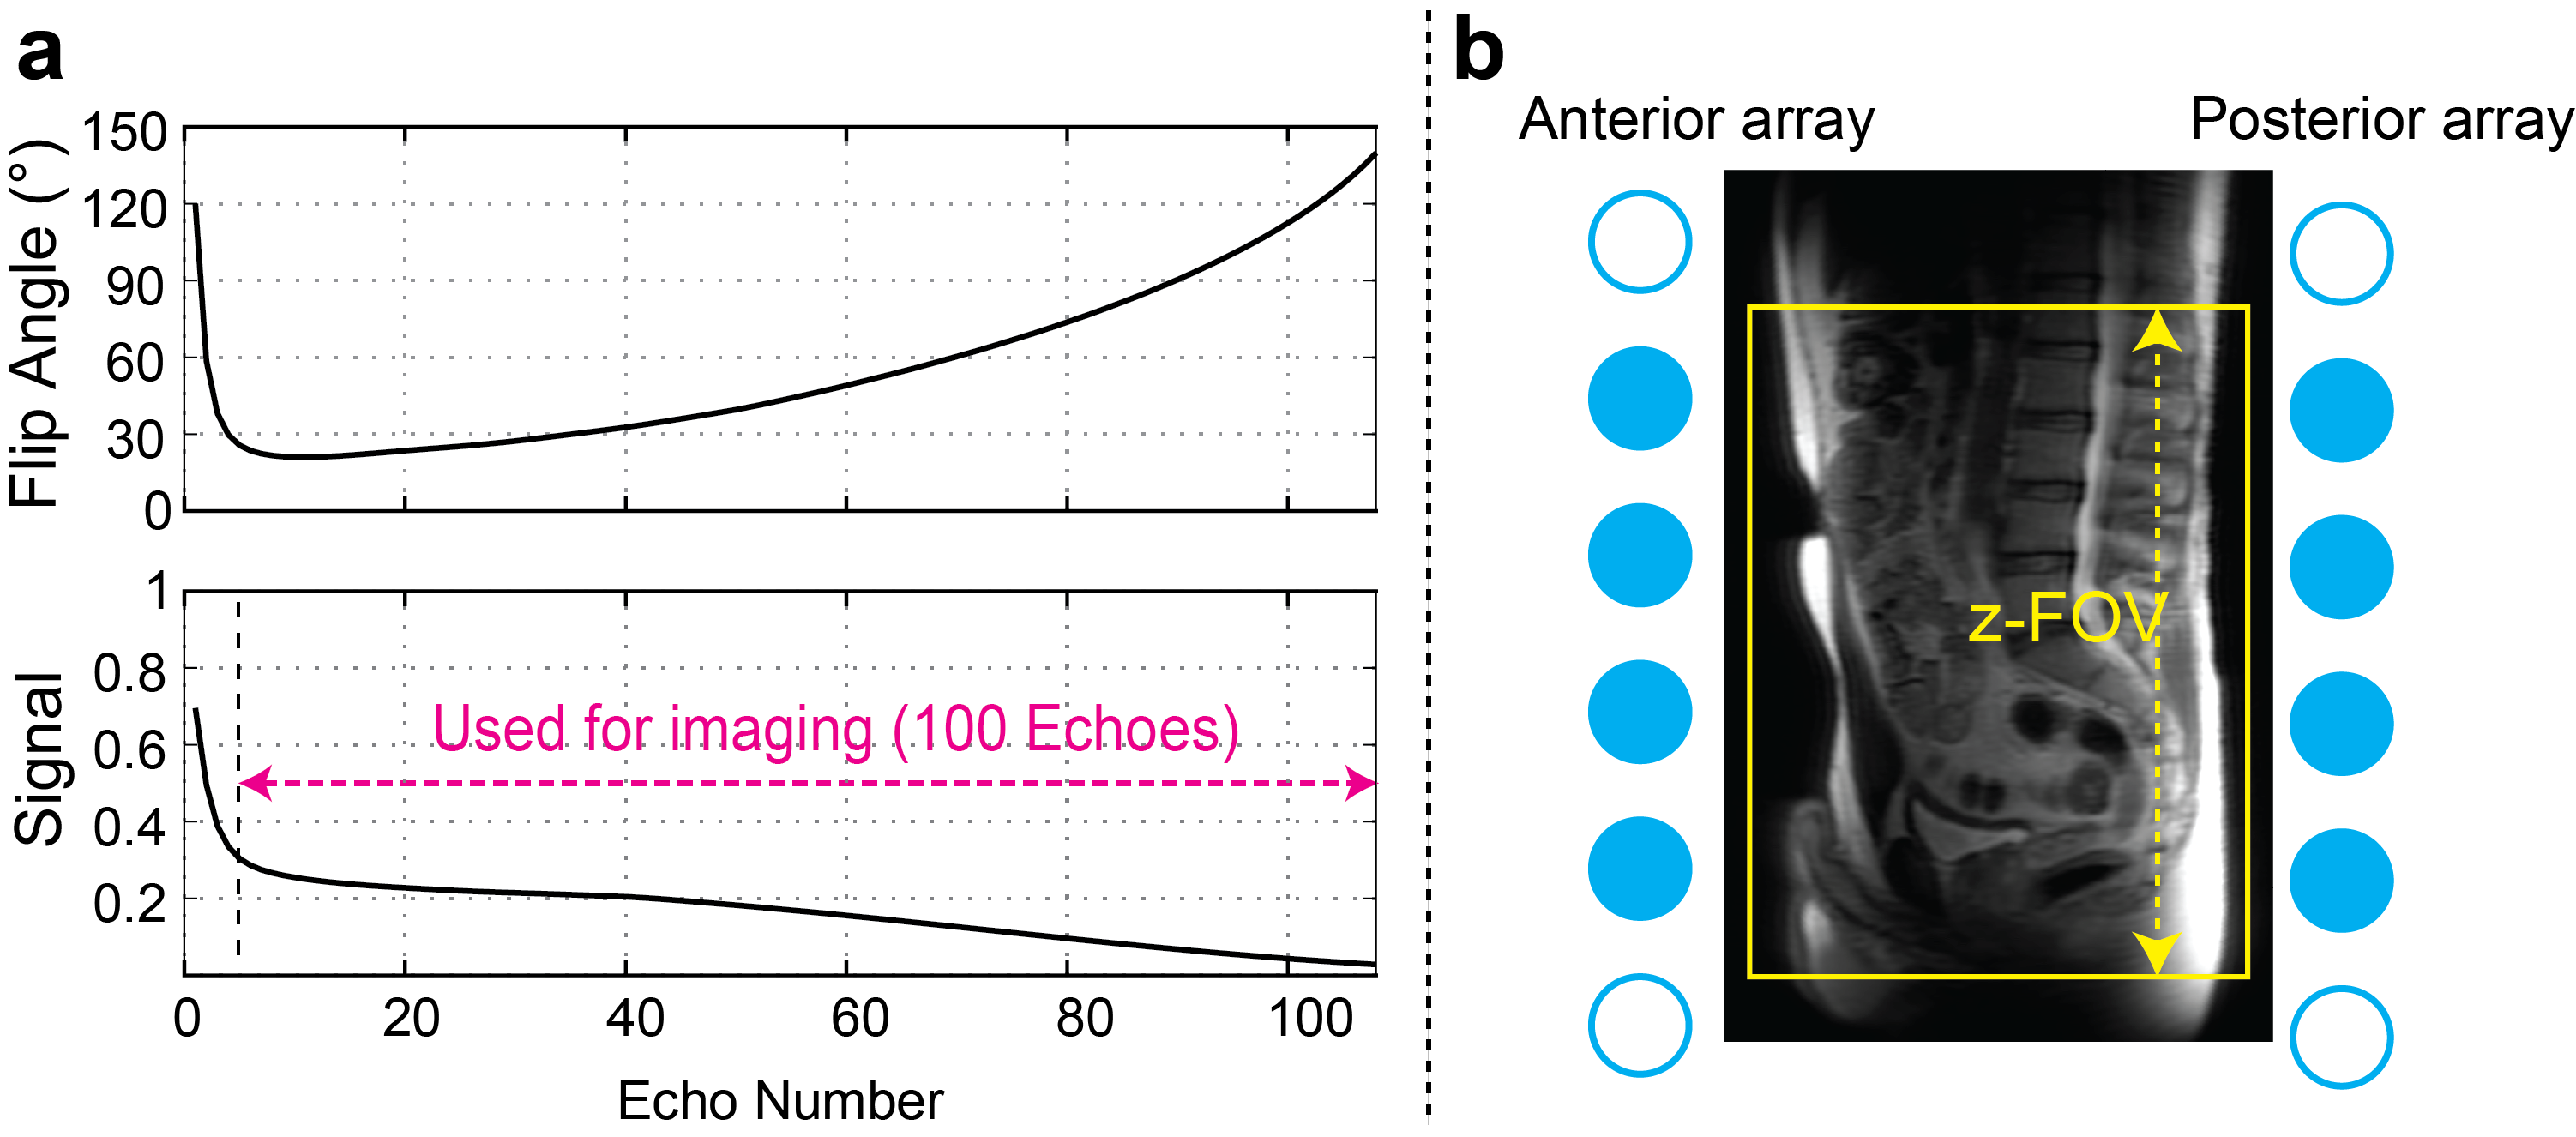
All experiments were performed using a GE Signa Premier 3T scanner (GE Healthcare, Waukesha, WI) having a maximum gradient amplitude of 7 G/cm and a maximum slew rate of 150 mT/m/ms. For 3D FSE acquisition (Cube), a single-TR, triple-echo technique with joint water-fat estimation was used for Dixon-based fat-water separation9 (Cube-Flex), and variable refocusing flip angles were used to minimize T2-induced blurring10 as shown in Figure 1(a). Prescribing low refocusing flip angles can also yield significant dephasing of flowing spins by crusher gradients8,10, suppressing vessel signal that can confound nerve visualization. Crusher gradients were located along all x, y, and z axes (commercially available sequence was modified to add y-crusher gradients). Non-selective hard pulses were used for both the excitation pulse and refocusing pulses to minimize B0 and B1 inhomogeneity effects.In vivo experiments were performed using a 30 channel adaptive image receive (AIR) anterior-array coil and a 60 channel spine posterior-array coil embedded in the table, after getting informed consent. Cube Flex was prescribed with 1.2 mm isotropic resolution, 36 x 25.2 cm2 in-plane FOV (or increased y-FOV for a bigger subject), and 300 slices in the axial orientation, with other imaging parameters of 2500 ms TR, 70-80 ms TE, ±166.7 kHz readout bandwidth, and 100 echo train length. Only coil elements located inside the imaging volume were turned on to limit signal from outside the slab-direction FOV (Figure 1b). Data-driven ARC and compressed-sensing (CS) acceleration11 (phase/slab/CS acceleration=1.7/1.7/1.3) were applied to yield a scan time of 6.5 – 7.5 mins. For two healthy subjects, Cube-Flex with both selective and nonselective excitation and clinical axial and coronal 2D FSE-Flex MRN sequences were performed for comparison. Axial 2D FSE Flex used TR/TE=7700/100 ms, 24 x 24 cm2 FOV, 332 x 238 matrix size, and 3 mm slice thickness while coronal FSE Flex used TR/TE=10000/66 ms, 34 x 34 cm2 FOV, 340x256 matrix size, and 3 mm slice thickness. With other four healthy subjects and ten patients having symptomatic lower back pains, clinical lumbar spine images were acquired prior to 3D Cube-Flex for clinical lumbar spine evaluation.
Results
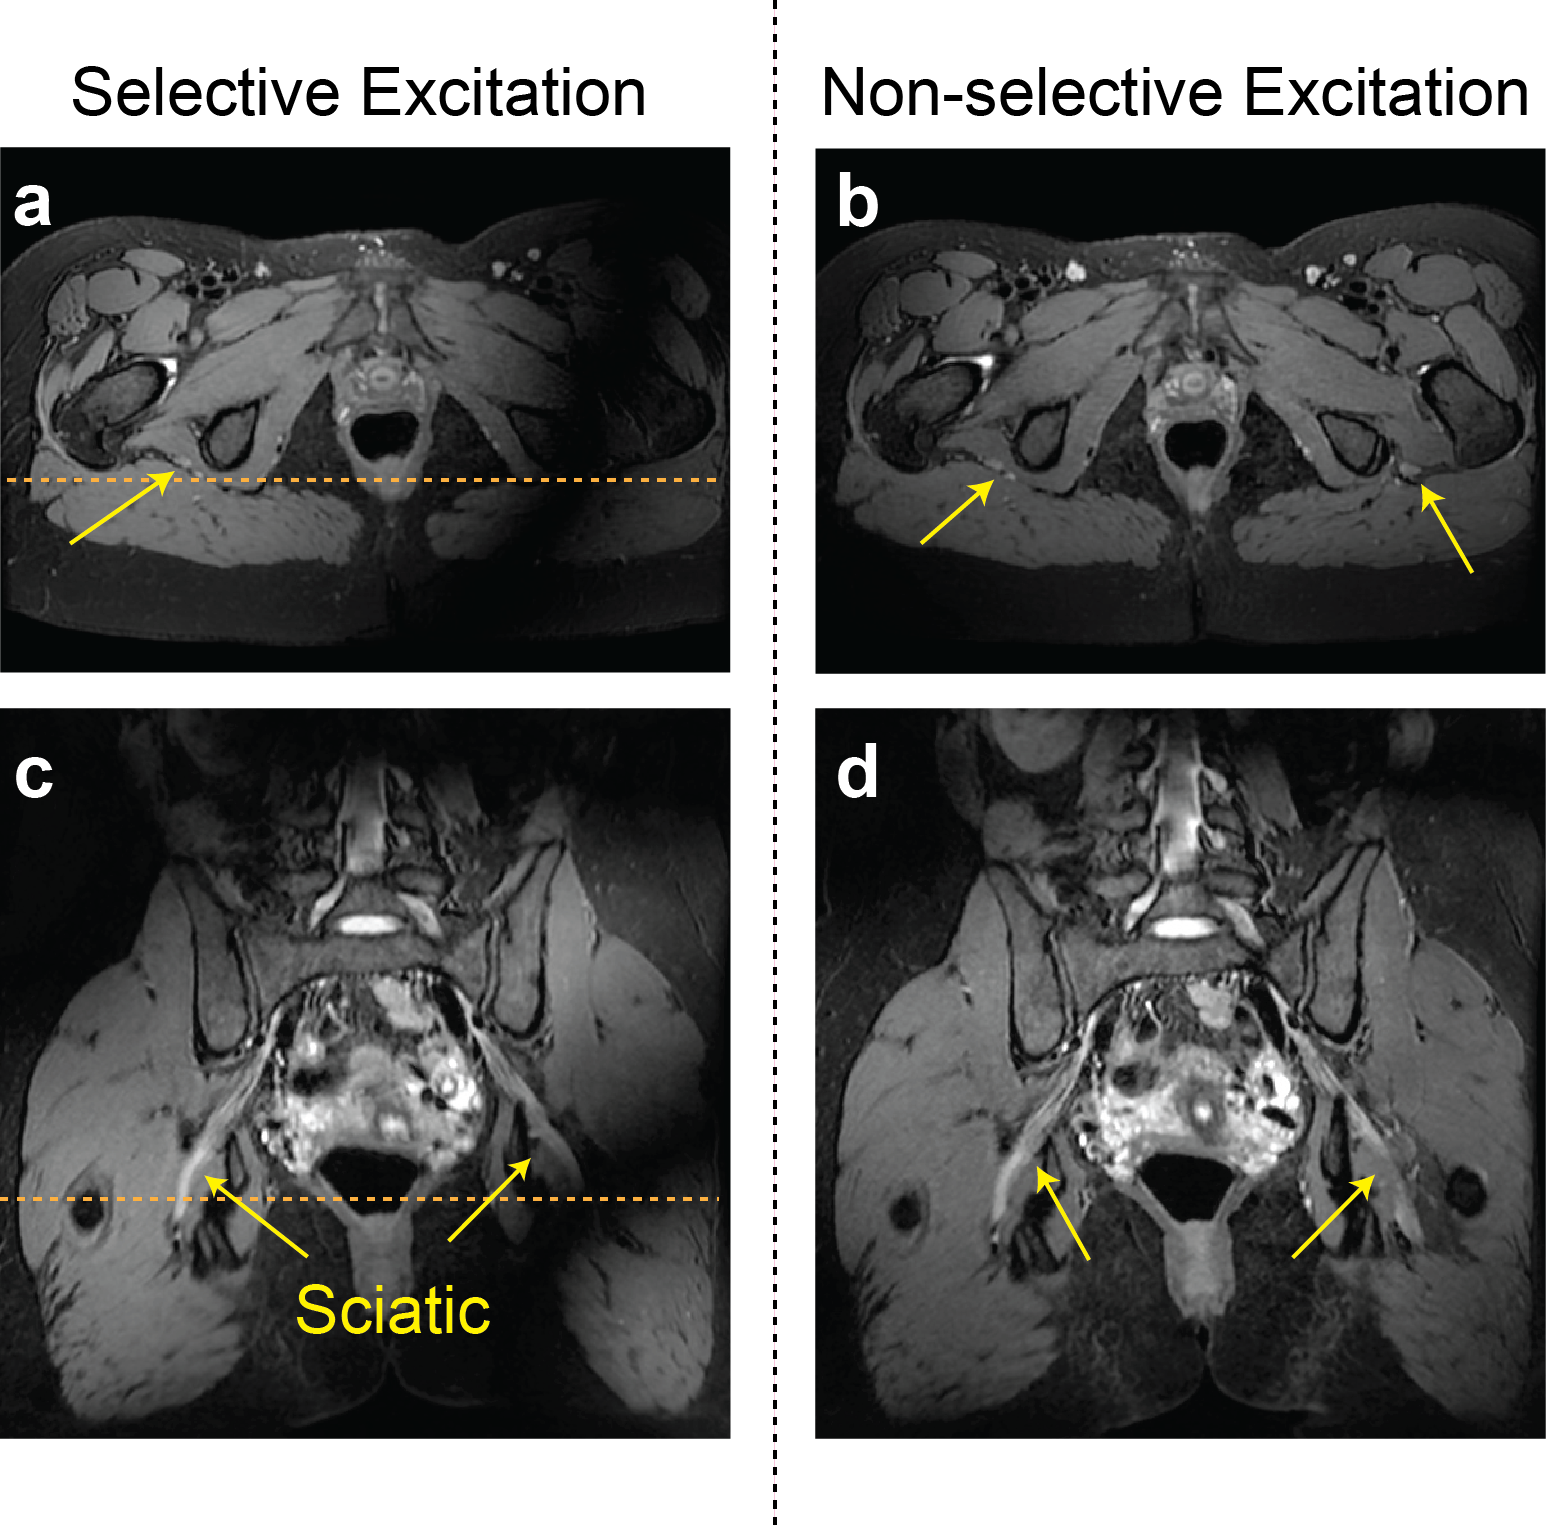
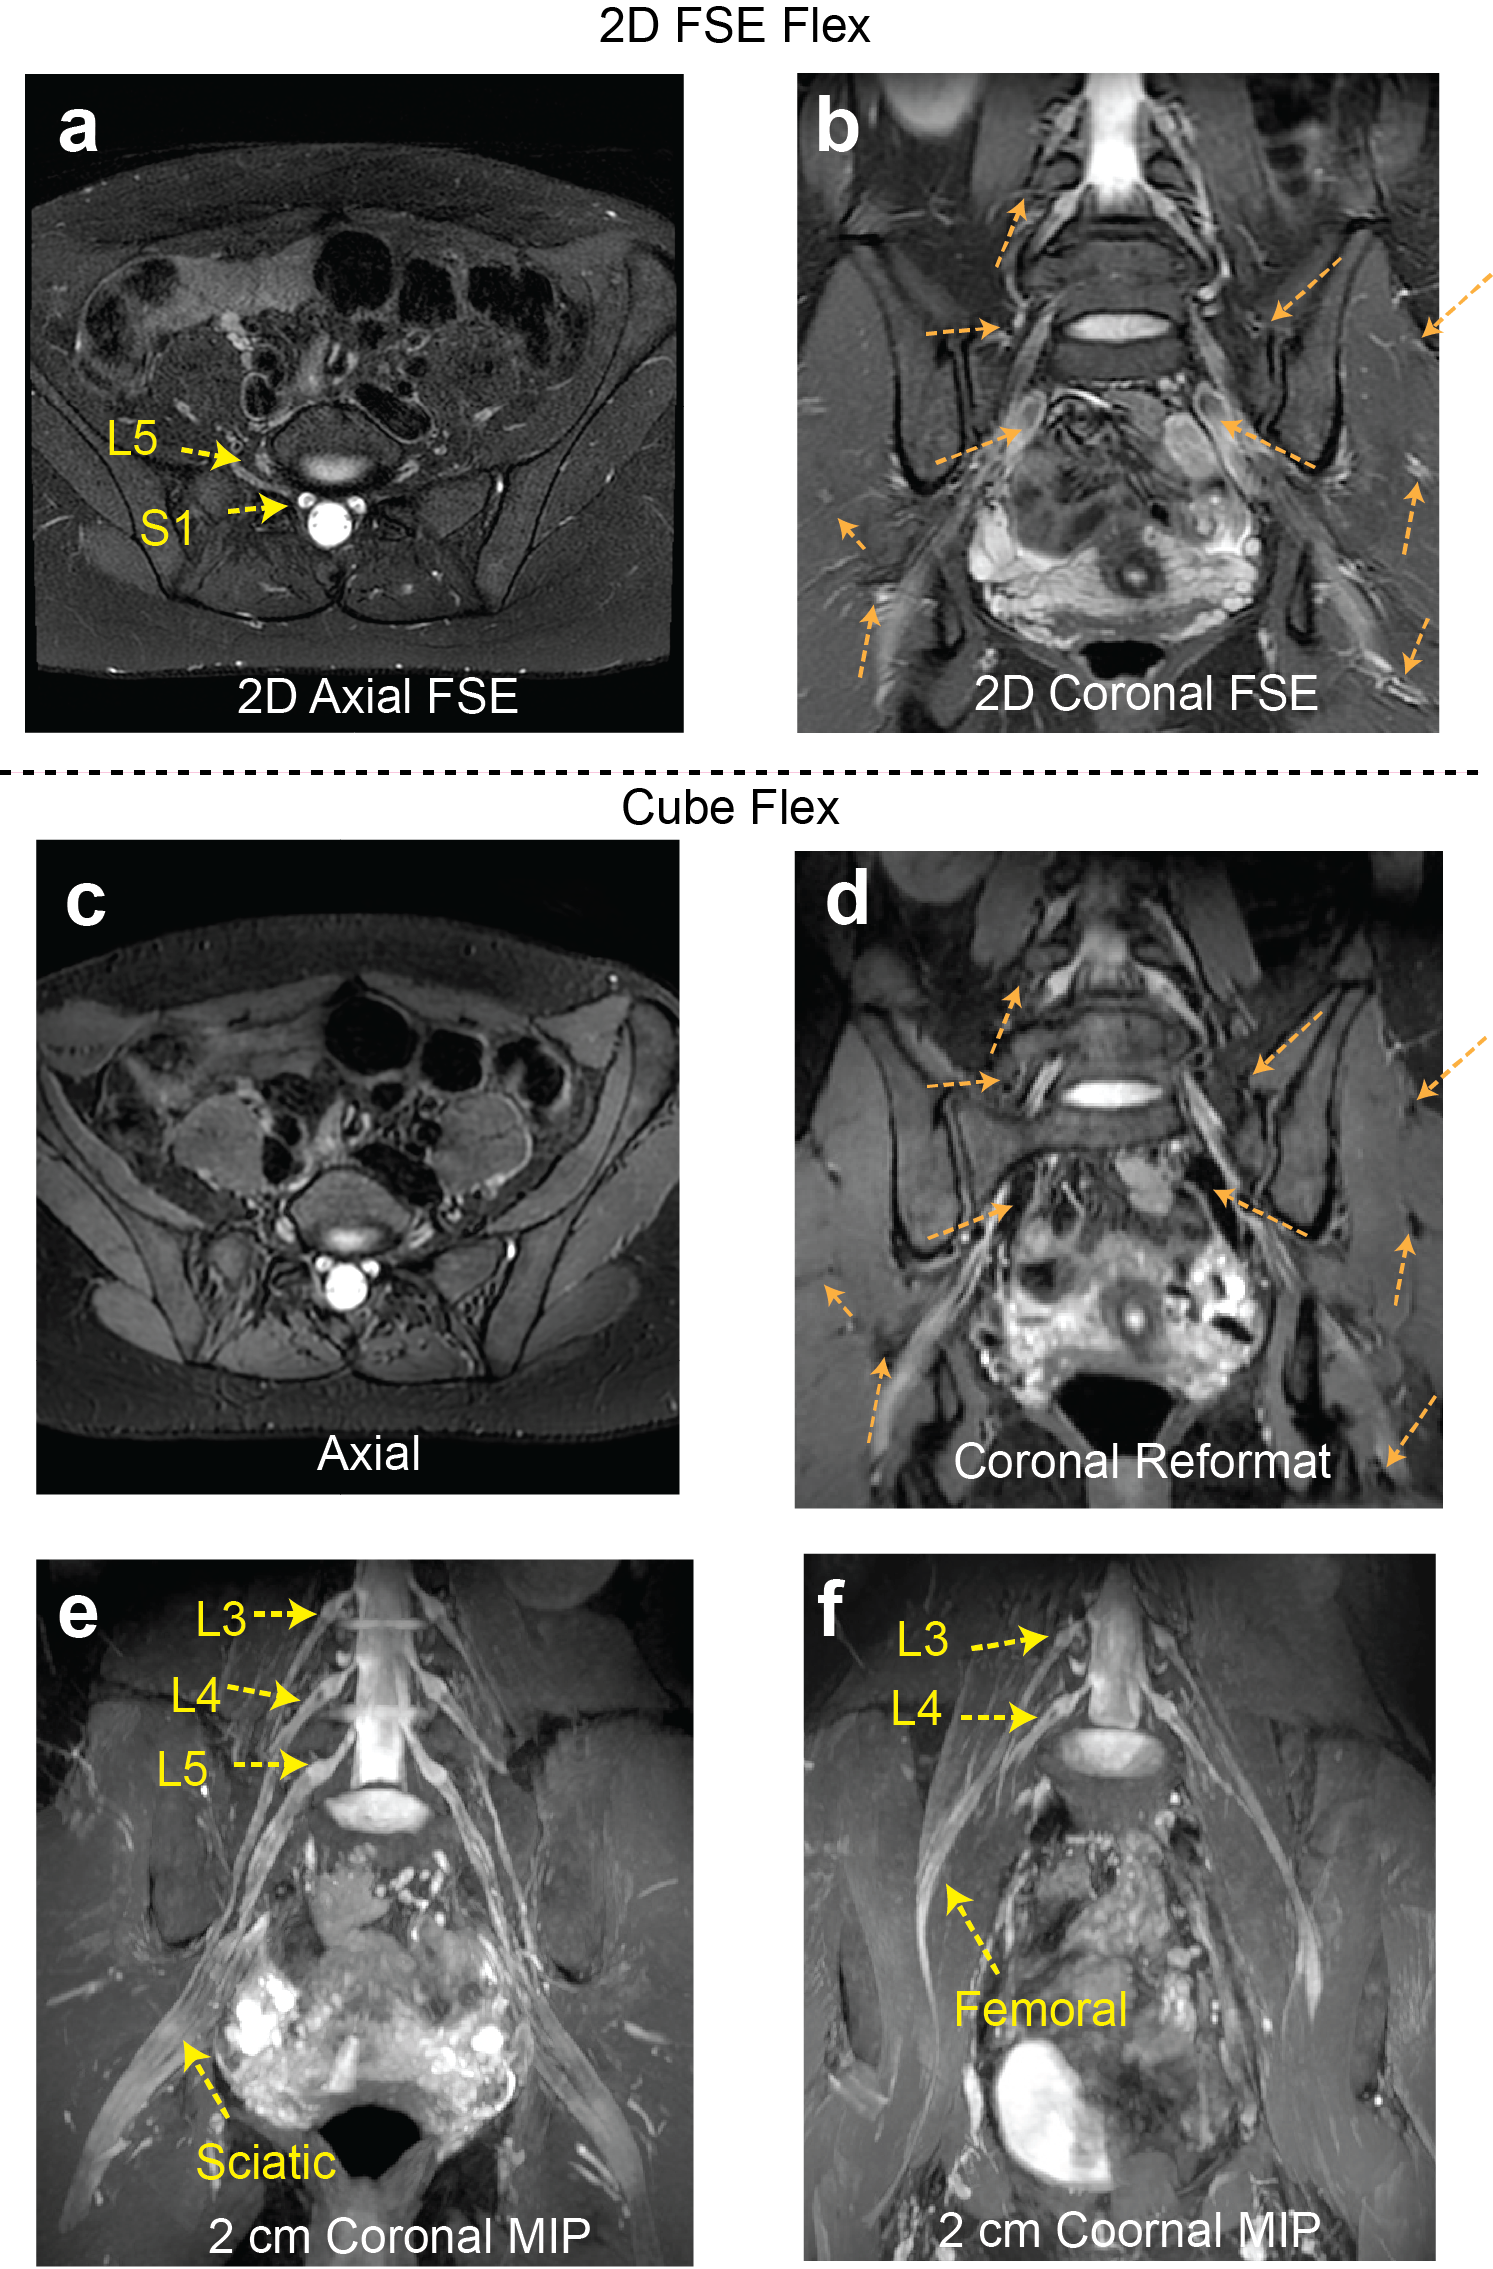
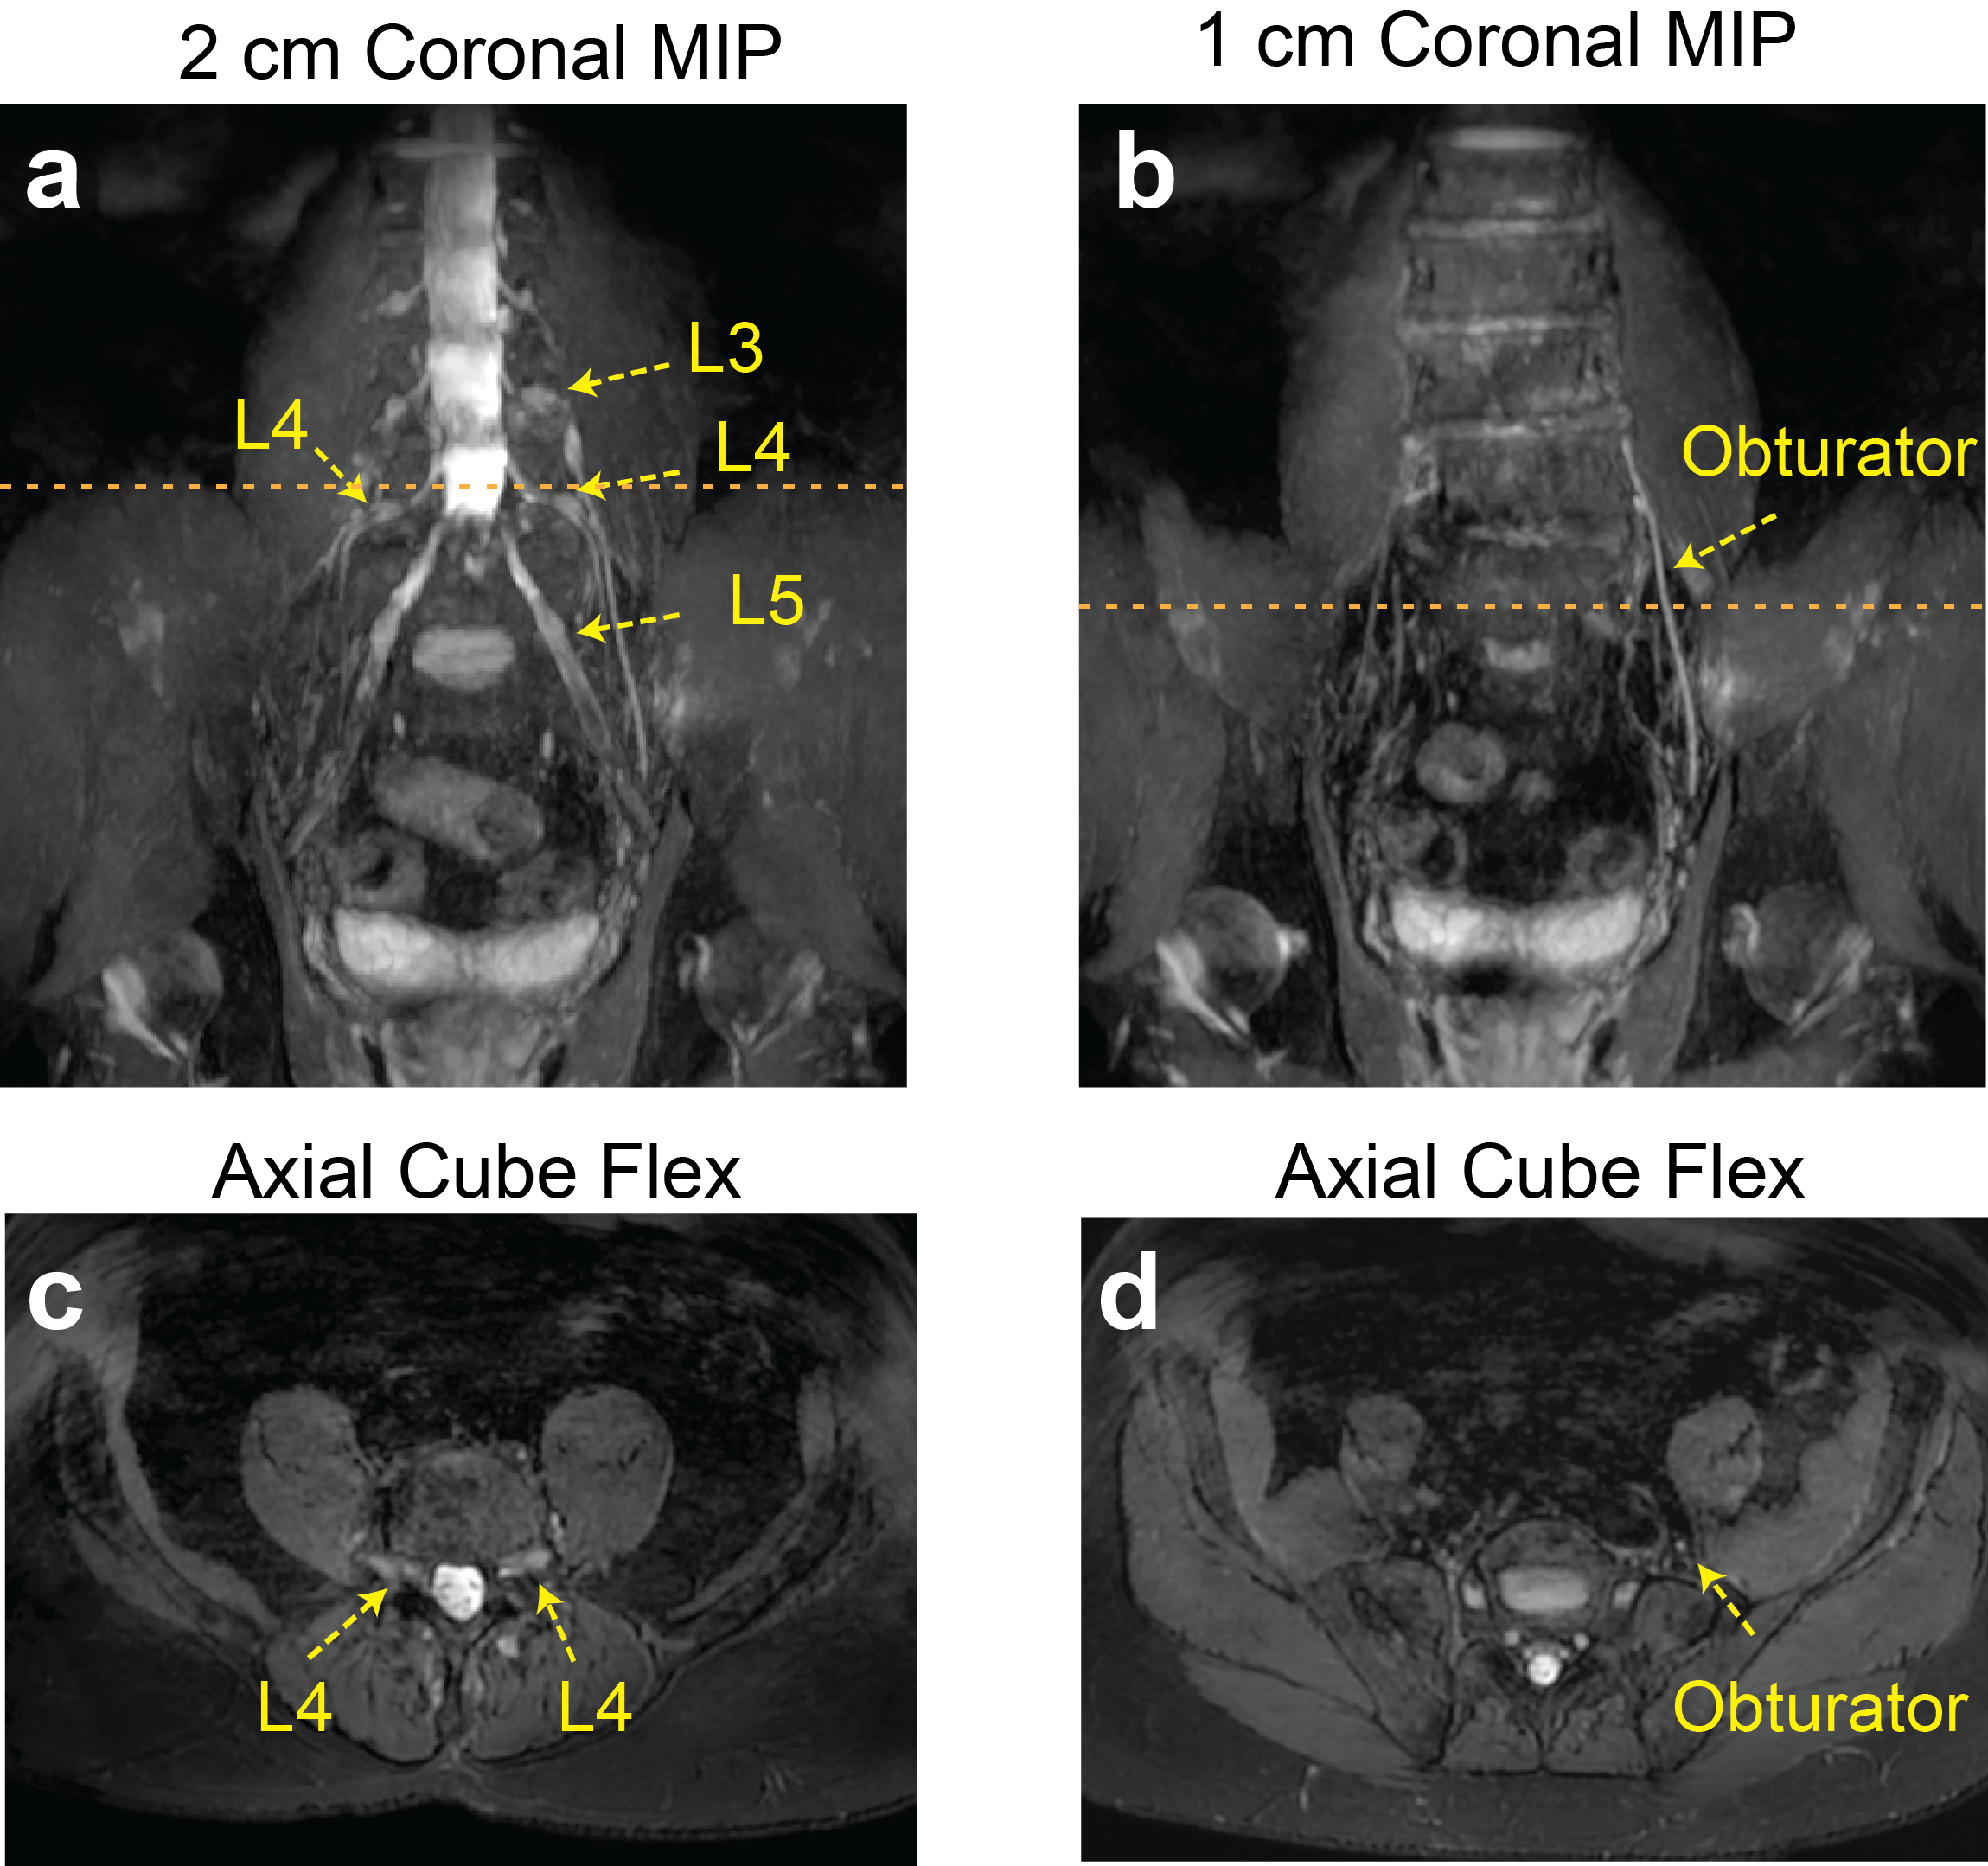
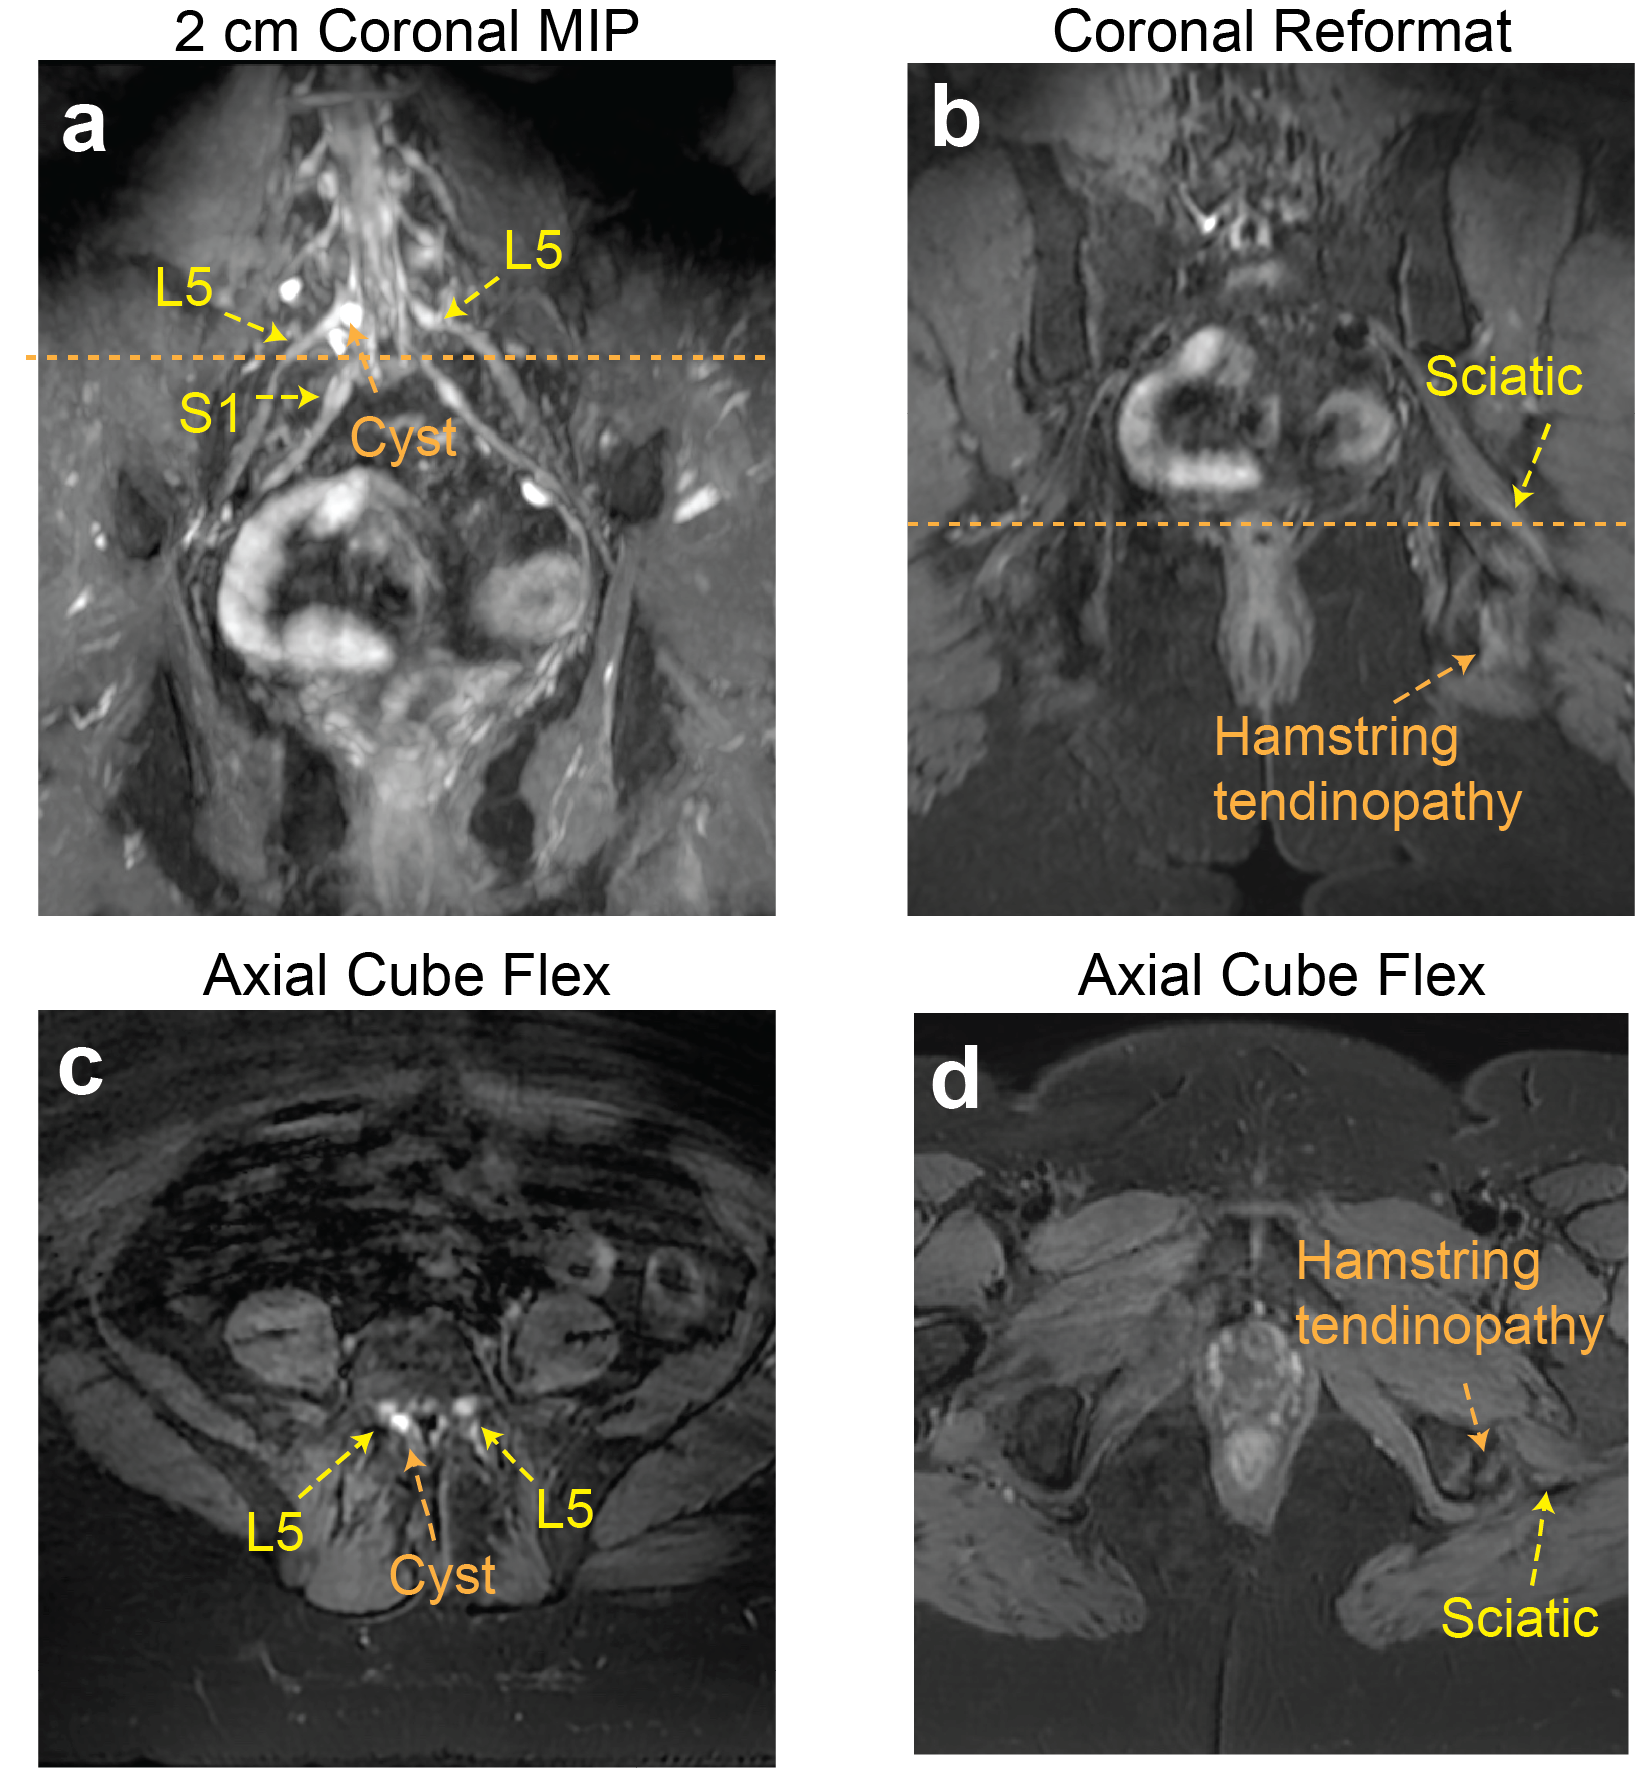
Figure 2 compares signal homogeneity of overall images when either selective or nonselective excitation was used with Cube-Flex. Employing nonselective excitation can significantly reduce shading artifacts and improve nerve visualization over the large imaging volume. 2D FSE-Flex images and Cube-Flex images from the same healthy subject are shown in Figure 3. Cube-Flex delineated nerve structures similarly to clinical 2D FSE-Flex, albeit a lower in-plane resolution, and provided significant reduction of blood signal. Maximum intensity projection (MIP) over two different 2 cm-thick slabs from Cube Flex provided good depiction of normal bilateral L3, L4, and L5 nerve roots, and femoral and sciatic nerves, without being obscured by vessels.Figure 4 shows Cube-Flex images from a patient having multi-level degenerative changes in the lumbar spine, most severe at the L4-L5 disc level due to advanced bilateral facet arthropathy. Nerve root compression and inflammation was observed in the left L3 root, bilateral L4 roots, and left L5 root. Inflamed, enlarged L4 nerve roots were depicted in the axial slice. The left obturator nerve, arising from left L2, L3, and L4 nerve roots, was hyperintense in Figure 4b,d, indicating inflammation. Images from another patient having cyst at the L5-S1 disc level are shown in Figure 5. The cyst compressed the right L5 and S1 nerve roots, and bilateral L5 and right S1 nerve roots were shown as abnormal. The patient also had left sciatic nerve inflammation depicted in Figure 5b,d, resulted from hamstring tendinopathy on the left hip.
Discussion
Our Cube-Flex sequence allows for good depiction of various nerves in the lumbosacral plexus and assessing nerve abnormality such as inflammation. Employing hard pulse excitation with limited coil element selection provided overall signal uniformity without visible aliasing artifacts, and vessel signal was well suppressed without additional flowing suppression techniques. Even though only limited clinical cases have been applied, we believe that this sequence can depict various nerve injuries resulted from spinal/disc degeneration, trauma, tumors, and radiation treatment.Conclusion
We demonstrated that an optimized 7 min Cube-Flex sequence can be used for 3D MRN of the lumbosacral plexus to assess nerve abnormality by providing good delineation of peripheral nerves resulted from uniform fat suppression, more homogenous signal level, and well-suppressed blood vessels.Acknowledgements
We would like to acknowledge GE Healthcare for general research support and our funding sources, NIH/NIAMS UH3AR076724 and NIH/NIAMS K01AR075895.References
[1] Howe FA, Filler AG, Bell BA, Griffiths JR. Magnetic resonance neurography. Magn Reson Med 1992;28(2):328-338.
[2] Maravilla KR, Bowen BC. Imaging of the peripheral nervous system: evaluation of peripheral neuropathy and plexopathy. AJNR Am J Neuroradiol 1998;19(6):1011-1023.
[3] Chhabra A, Thawait GK, Soldatos T, Thakkar RS, Del Grande F, Chalian M, Carrino JA. High-resolution 3T MR neurography of the brachial plexus and its branches, with emphasis on 3D imaging. AJNR Am J Neuroradiol. 2013;34(3):486-497.
[4] Delaney H, Bencardino J, Rosenberg ZS. Magnetic resonance neurography of the pelvis and lumbosacral plexus. Neuroimaging Clin N Am. 2014;24(1):127-150.
[5] Sims GC, Boothe E, Joodi R, Chhabra A. 3D MR neurography of the lumbosacral plexus: obtaining optimal images for selective longitudinal nerve depiction. AJNR Am J Neuroradiol. 2016;37(11):2158-2162.
[6] Sneag DB, Queler S. Technological Advancements in Magnetic Resonance Neurography. Curr Neurol Neurosci Rep. 2019;19:75.
[7] Taviani V, Mitsuharu M, Wang K, et al. A Flexible Technique for Flow-Sensitive Fat-Suppressed High-Resolution Peripheral Nerve Imaging. In: Proceedings of the 25th Annual Meeting of ISMRM, Honolulu, Hawaii, USA, 2017, p.96.
[8] Wang X, Harrison C, Mariappan YK, Gopalakrishnan K, Chhabra A, Lenkinski RE, Madhuranthakam AJ. MR neurography of brachial plexus at 3.0 T with robust fat and blood suppression. Radiology. 2017;283(2):538-546.
[9] Ma J, Son JB, Zhou Y et al. Fast Spin-Echo Triple-Echo Dixon (fTED) Technique for Efficient T2-Weighted Water and Fat Imaging. Magn Reson Med. 2007; 58(1): 103–109.
[10] Busse RF, Brau AC, Vu A, Michelich CR, Bayram E, Kijowski R, Reeder SB, Rowley HA. Effects of refocusing flip angle modulation and view ordering in 3D fast spin echo. Magn Reson Med. 2008;60(3):640-649.
[11] Beatty PJ, King KF, Marinelli L, Hardy CJ, Lustig M. Sequential Application of Parallel Imaging and Compressed Sensing. In: Proceedings 17th Annual Meeting ISMRM, Honolulu, Hawaii, USA, 2009. p.2824.
Figures