1371
Vibration measurements of the SC72 gradient versus field strength in the Iseult magnet1University Paris-Saclay, CEA, CNRS, BAOBAB, NeuroSpin, Gif sur Yvette, France, 2University Paris-Saclay, CEA, Irfu, Gif sur Yvette, France, 3Siemens Healthcare GmbH, Erlangen, Germany
Synopsis
The whole-body Iseult 11.7T CEA magnet has delivered its first images after nearly 20 years of research and development. Before reaching this long-waited step, a gradient coil–magnet interaction test campaign was run for several months at 3T, 7T, 10.2T and 11.7T on the same identical system. It included acoustics, vibrations, magnet safety system voltage and power deposition in the He bath measurements. Some vibration results versus field strength are presented here. Vibration amplitudes are shown to increase less than with B0 field strength.
Introduction
MRI at UHF offers great promises in SNR and CNR. In the quest of reaching ever higher magnetic fields, one crucial aspect beforehand remains the design of the magnet, the gradient coil and their interaction. The time-varying fields generated by the gradient cause eddy-currents in the structure which, under the influence of a strong B0 field, generate vibrations, which engender themselves electric fields and power deposition in the He bath. In addition to these power losses which can be critical for the integrity of the magnet, mechanical resonances also can be detrimental for imaging performance (e.g. ghosting). In this context, we report in this work vibration measurements on the SC72 Siemens Healthineers whole-body gradient in the bore of the Iseult magnet at 3T, 7T, 10.2T and 11.7T.Methods
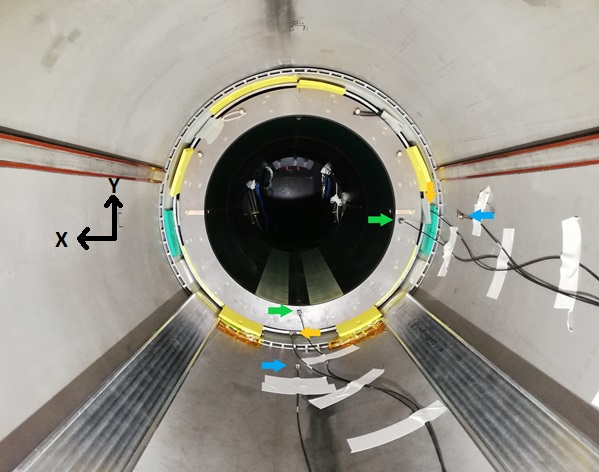
The Iseult magnet1 is 5 m long/wide and weighs 132 tons. The main superconducting coil is immerged into a He bath of 7000 liters cooled down to 1.8 K, where He is superfluid. The gradient coil is surrounded by a lead tube to screen gradient-magnet interactions at some frequencies2. Six mono-axial accelerometers (Hottinger Bruel & Kjaer, Naerum, Denmark) were glued on the gradient, the lead tube and the cryostat to measure accelerations along the X and Y directions (Fig. 1). Vibrations were measured by applying a 1-min chirp excitation on the 3 gradient axis separately with G=1 mT/m over the 0-3200 Hz range. Close to a well-defined natural frequency ω0, the response of the accelerometers on the gradient was temptingly modeled with a damped harmonic oscillator: $$$\ddot{u}+\eta \dot{u} + \omega_0^2u=F(t)/m$$$, where m is an effective mass and where the damping coefficient η shall vary with B0. Because of the Lorentz force, the force should be proportional to the current (thus gradient strength) and the static field, i.e. $$$F \propto I B_0$$$. For an oscillating force at angular frequency ω, assuming a large quality factor, solving the differential equation in the steady state yields approximately for the peak displacement $$$u_{max} \propto IB_0/\eta$$$. To verify this simple model, measurements were performed at 0.1, 1 and 5 mT/m to confirm the linearity of the response versus I, for B0 constant. They were finally repeated on the same identical system at 3T, 7T, 10.2T and 11.7T to study the response and the dependence of η on B0 over a broad frequency range.Results
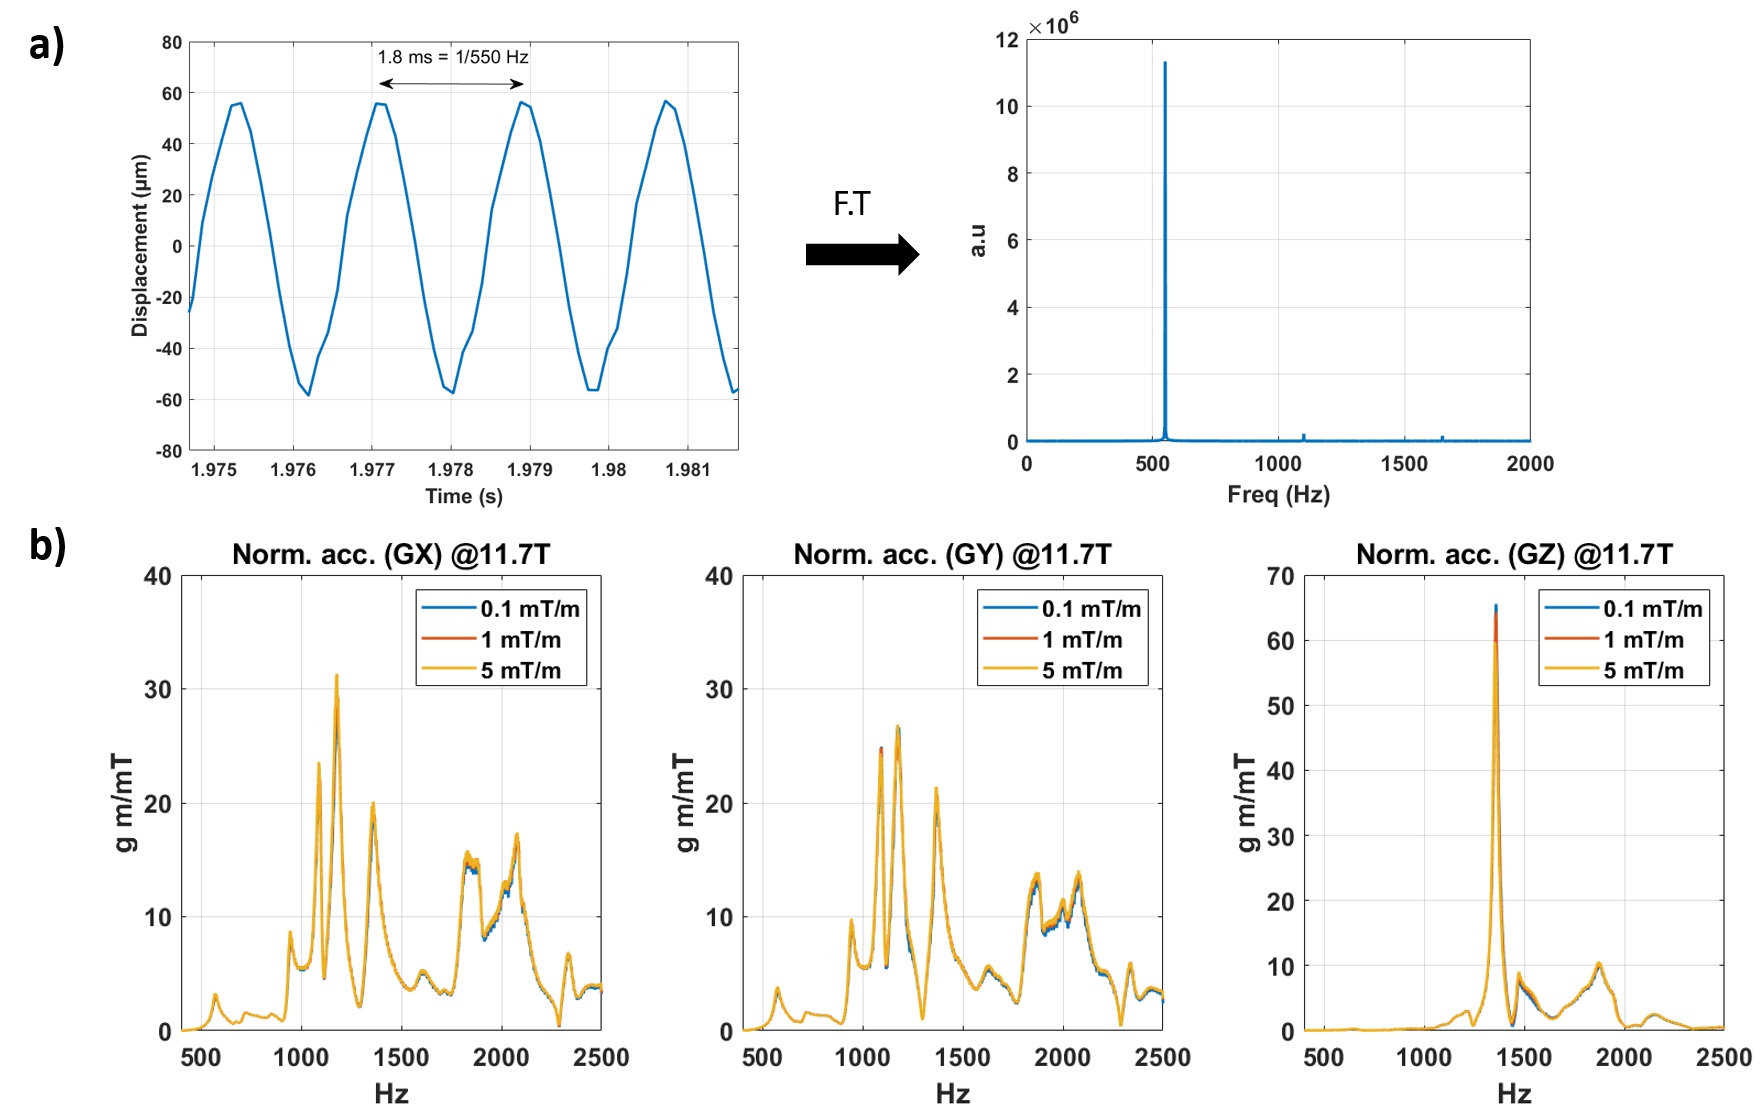
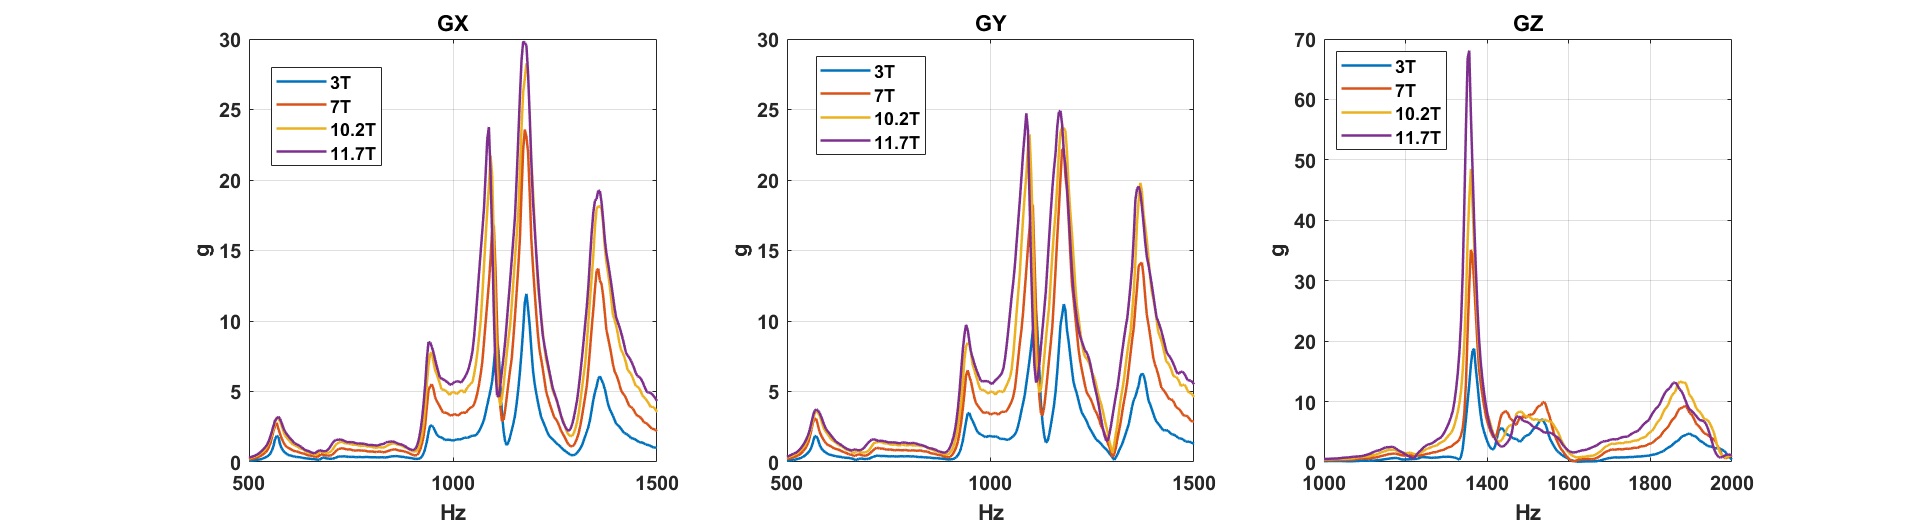
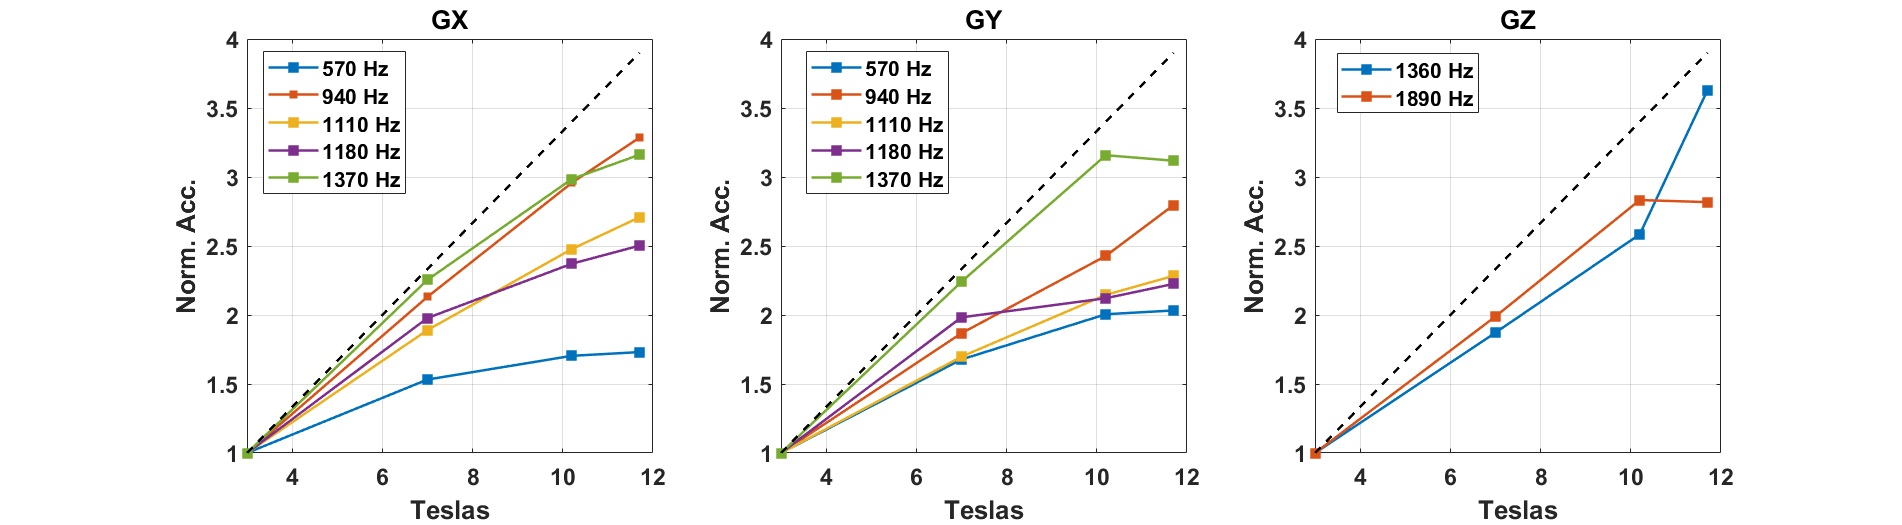
Fig.2.a. shows the measured temporal displacement along the Y axis for a sine excitation of GY=20 mT/m at 550 Hz and at 7T, with its Fourier transform. Fig.2.b shows acceleration spectra acquired at 11.7T for the three gradient axis and normalized by the different gradient strengths. The plots being nearly identical and the system responding at the frequency of the excitation indicate a behavior consistent with a harmonic oscillator. Fig. 3 shows the acceleration spectra under a G=1 mT/m excitation at different B0 field strengths and for the three gradient axis, showing qualitatively the same behavior aside from expected increased amplitudes versus field strength. The amplitudes of the peaks, normalized to the ones at 3T, are shown in Fig. 4 and reveal a response that grows slower than the B0 field.Discussion and conclusion
To a good approximation, the experimental results show that the vibration response at one location of the gradient coil is consistent with a damped harmonic oscillator. The data reveal a less severe dependence for the response than with B0, which could explain moderate increases of acoustic noise versus field strength3 for a same set up. Having $$$\eta \propto B_0$$$ would yield a nearly constant amplitude response versus B0, which is not the case. Interestingly, some resonances also exhibit a plateau which could be consistent with a dependence of the damping coefficient as $$$\eta(\omega) \propto \eta_0(\omega) + \alpha B_0$$$ (with α being a scalar). The data, at least up to 11.7T, on the other hand cannot verify a dependence as $$$\eta(\omega) \propto \eta_0(\omega) + \alpha B_0^2$$$ as suggested in the literature4 which would imply an increase of the response until a maximum is reached, followed by a drop versus field strength.Acknowledgements
NB is funded by the European Union’s Horizon 2020 research and innovation program under grant agreement No 885876 (AROMA project). We thank Hermann Landes for valuable discussions. François Nunio and Loris Scola are also thanked for the fruitful discussions about the mechanics during the tests.References
[1] D. Le Bihan, T. Schild, Human Brain MRI at 500MHz, scientific perspectives and technological challenges, Supercond. Sci. Techno. 2017;30:1-19.
[2] G. Aubert. NMR imaging system with reduced cryogenic losses and reduced acoustic noise. US patent no 8,410,777 B2.
[3] G. Metzger. Future Directions in UHF MR Safety from the Perspective of 10.5T. Proceedings of MR safety workshop of the ISMRM, 2019, Utrecht, The Netherlands.
[4] S. Winkler et al. On the Accurate Analysis of Vibroacoustics in Head Insert Gradient Coils. MRM 78:1635-1645 (2017).
Figures