1366
Metabolic information in APT-CEST - A combined 1H and 31P MRS study1Neuroradiology, Goethe University Hospital Frankfurt, Frankfurt am Main, Germany, 2Goethe University Hospital Frankfurt, Frankfurt am Main, Germany, 3Brain Imaging Center, Goethe University, Frankfurt am Main, Germany
Synopsis
In this work, APT-CEST imaging in combination with 1H and 31P spectroscopy was performed to investigate 17 patients with different brain tumors. A synergistic analysis should help for a better understanding of the APT-CEST contrasts such as MTRasym with regard to tumor metabolism and further physiological relationships such as the pH-sensitivity.
Introduction
The magnetization transfer ratio asymmetry (MTRasym) obtained through Amide-Proton Transfer – Chemical Exchange Saturation Transfer (APT-CEST) imaging has been discussed as an additional marker for the distinction of tumors. It could be shown that the MTRasym can either be used as a marker to assess tumor proliferation or to discriminate between histological changes, such as the IDH-status 1,2,3,4,5. Using a multislice CEST-EPI sequence6 in combination with 1H and 31P spectroscopy, different tumors were examined with APT-CEST regarding its metabolite dependency and to explore the pH sensitivity7.Methods
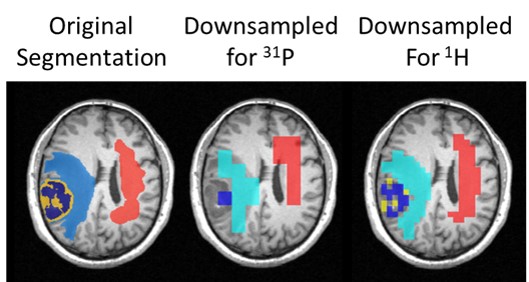
Seventeen patients with different brain tumors were scanned at 3T, including 10 glioblastomas, 4 metastases, 3 astrocytomas and 1 lymphoma. The study was performed using a multislice CEST-EPI sequence, as well as a 2D CSI-sLaser and 3D FID-CSI sequence for the detection of 1H and 31P spectroscopic data. In addition, quantitative T1 imaging was performed by using the variable flip angle method (VFA)8. Necrotic, contrast-enhancement (CE) and edema (E) volumes-of interest (VOIs) were obtained by using the multimodal brain tumor segmentation tool (BRATS), which creates multiple tumor tissue segmentation based on clinically available MR data (FLAIR, MPRAGE, T1_CE and T2) followed by a final fusion of all segmentations 9. In addition, contralateral normal-appearing white matter (CNAWM) was selected manually and added to the segmentation datasets. Subsequently, the segmentations were used for a VOI-based analysis on the basis of the co-registered CEST and spectroscopic data. To reduce the impact of partial volume effects due to the lower resolution of 1H and 31P data, a grid at the respective spatial resolution was created. In this grid, voxels were assigned to specific tissue types employing a threshold of at least 60% (Fig.1). In a first analysis we investigated the MTRasym of the amide protons with metabolic markers known to be altered in tumor tissue. In order to correct for the dependence of T1, the apparent exchange-dependent relaxation (AREX) CEST contrast was calculated according to the work of Zaiss and Bachert 10. Boxplot analysis were performed for the different APT-CEST metrics and tissue segmentations.Results
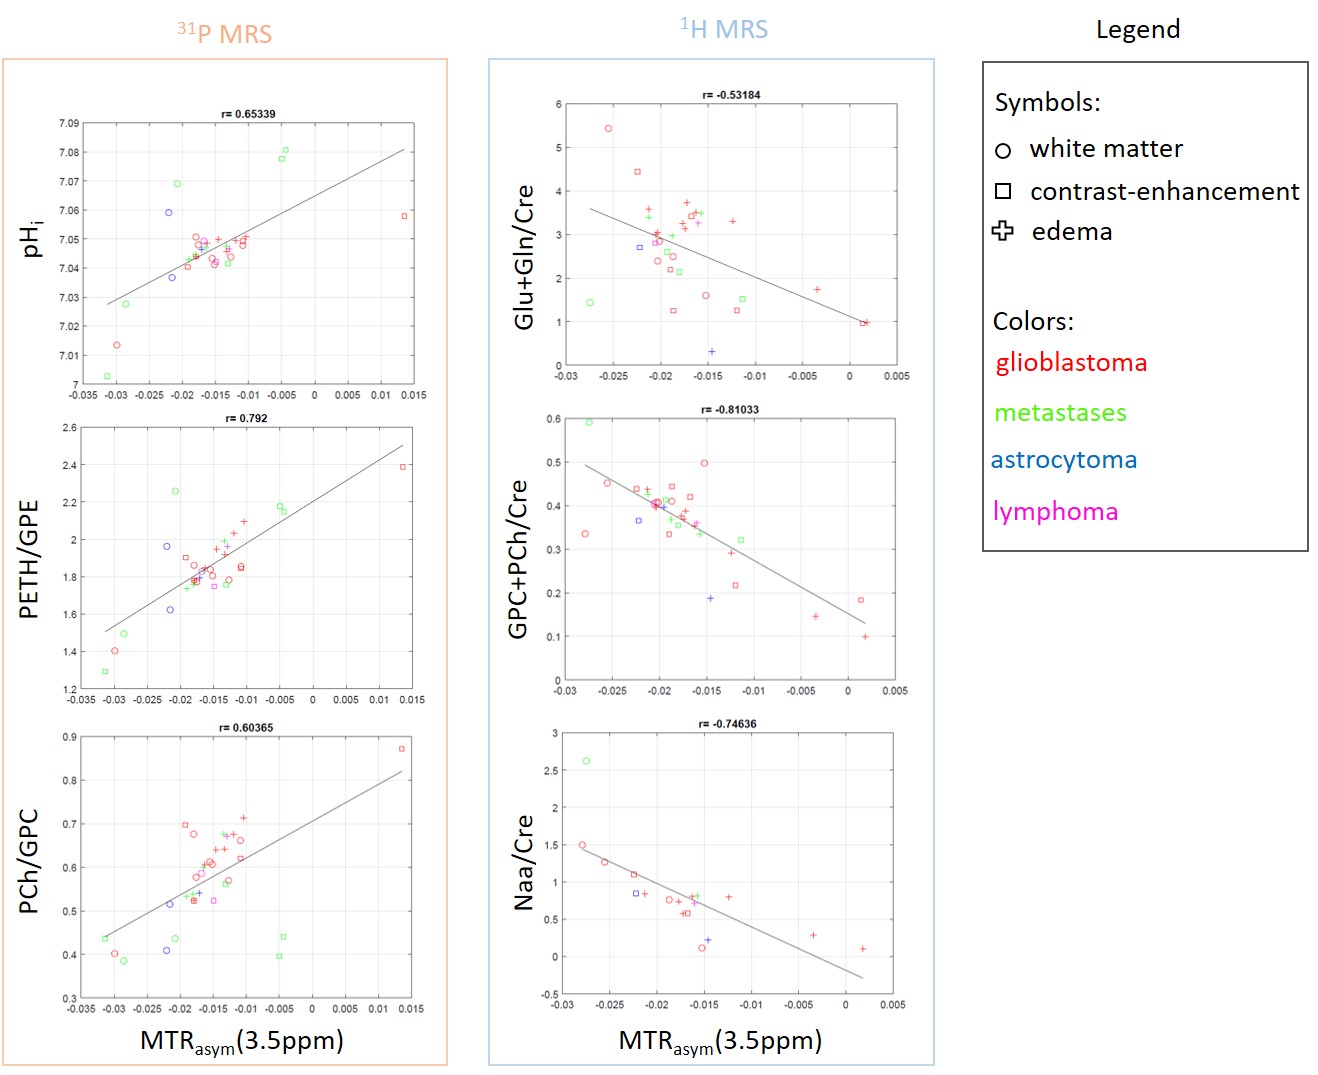
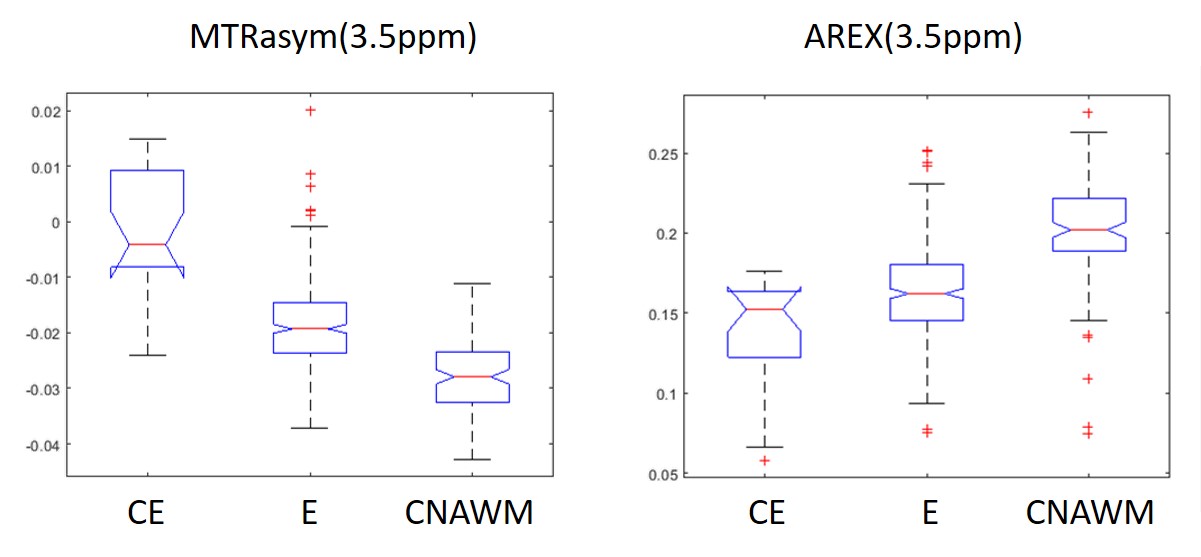
Results for the correlation of metabolite concentrations with MTRasym are shown in figure 2. Increased MTRasym values correlate with an increased PETH/GPC ratio (r=0.79), higher PCh/GPC (r=0.6) and elevated pHi (r=0.65). Metabolites from proton spectroscopy showed a negative correlation with increasing MTRasym such as (Glu+Gln)/Cre (r=-0.53), Naa/Cre (r=-0.75) and (GPC+PCh)/Cre (r=-0.82). In addition, a weak but positive correlation could be found for Lac/Cre (r=0.36) and for the macromolecular included in the baseline (r=0.4). The VOI based analysis of the MTRasym and AREX (Fig.3) indicates changes in contrast according to the different tissue types and confirms significant alterations between CE and E vs. CNAWM for MTRasym , while for AREX significant differences were found between CE and WM (p<0.05).Discussion
For the evaluated data, MTRasym and AREX can be used to characterize the different tissue types. Further, MTRasym correlates with typical metabolic markers for tumor tissue. The results are in line with previous findings for the 31P MR detectable metabolites (i.e. increased PME/PDE and pHi for tumor tissue. For 1H, the decrease of Naa/Cre also indicates a reduction in neuronal cells. However, the decrease of (GPC+PC)/Cre seems to contradict the hypothesis of choline as a proliferation marker. This may be caused by the fact, that the decrease is due mainly to data from glioblastoma, which are known to show a reduced choline signal.In addition, a lower correlation was found between AREX and the observed metabolites.
Acknowledgements
No acknowledgement found.References
1 Su et al. - Amide Proton Transfer Imaging Allows Detection of Glioma Grades and Tumor Proliferation: Comparison with Ki-67 Expression and Proton MR Spectroscopy Imaging,AJNR Am J Neuroradiol., 2017
2 Philips Healthcare - Verbesserungen von Hirntumor-MRT mit APT- gewichteter Bildgebung, https://www.philips.de/healthcare/education-resources/publications/fieldstrength/enhancing-brain-tumor-mri-with-apt. Accessed Nov.2021
3 Paech et al. - Assessing the predictability of IDH mutation and MGMT methylation status in glioma patients using relaxation-compensated multipool CEST MRI at 7.0 T, Neuro Oncol, 2018
4 Schüre et al. - The pH sensitivity of APT-CEST using phosphorus spectroscopy as a reference method, NMR in Biomedicine,2019
5 Vernone et al. - The analysis of glutamate and glutamine frequencies in human proteins as marker of tissue oxygenation, R Soc.Open Sci.,2019
6 Schüre et al. - A fast and novel method for amide proton transfer-chemical exchange saturation transfer multislice imaging, NMR in Biomedicine, 2021
7 Zhou J, Payen J, Wilson DA, Traystman RJ, Zijl v, Peter CM. Using the amide proton signals of intracellular proteins and peptides to detect pH effects in MRI. Nat Med. 2003;9(8):1085-1090.
8 Preibisch et al. - Influence of RF spoiling on the stability and accuracy of T1 mapping based on spoiled FLASH with varying flip angles, Mag.Reson. Med, 2009
9 F. Kofler et al., Translating BraTS Brain Tumor Segmentation Algorithms into Clinical and Scientific Practice, Neuroscience, 2020
10 Zaiss and Bachert - Chemical exchange saturation transfer (CEST) and MR Z-spectroscopy in vivo: a review of theoretical, Phys. Med. Biol.,2013
Figures