1365
Functional 31P MRS in the visual cortex at 9.4 T1Magnetic Resonance Center, Max Planck Institute for Biological Cybernetics, Tübingen, Germany, 2Biomedical Magnetic Resonance, University of Tübingen, Tübingen, Germany
Synopsis
Even after a large number of studies with varying outcome, the effect of brain activation on the 31P spectrum is still unclear. Here, the SNR gain expected from a field strength of 9.4 T is used to determine changes in the metabolite peaks during a 5 min stimulus. In spite of the high SNR and spectral quality, no significant variations were found. Especially the amplitude and linewidth of the PCr-peak did not change, and, while the signal of extracellular inorganic phosphate was well visible after averaging over all subjects, no variations in its amplitude or position were observed.
Introduction
While 31P MRS has been very successful in observing the decay in PCr during exercise in the muscle, the effect of brain activity on the 31P spectrum is still unclear. A large number of studies was performed at different magnetic fields with strongly varying outcome1-5. However, 31P spectroscopy is expected to profit particularly from increasing field strength, and two recent studies at 7 T have yielded excellent spectra, one, however, finding no activity-induced changes at all4, while the other observed, in addition to a small decrease in the PCr-linewidth during activation, a small frequency shift in the signal of intracellular anorganic phosphate Pi,ex, which was only detectable after adding spectra from all examined subjects3.The aim of this study was to use the still higher magnetic field strength of 9.4 T in combination with a highly sensitive multi-channel receive coil to determine if a long (5 min) visual stimulus has a measurable effect on the 31P spectrum of the visual cortex.
Methods
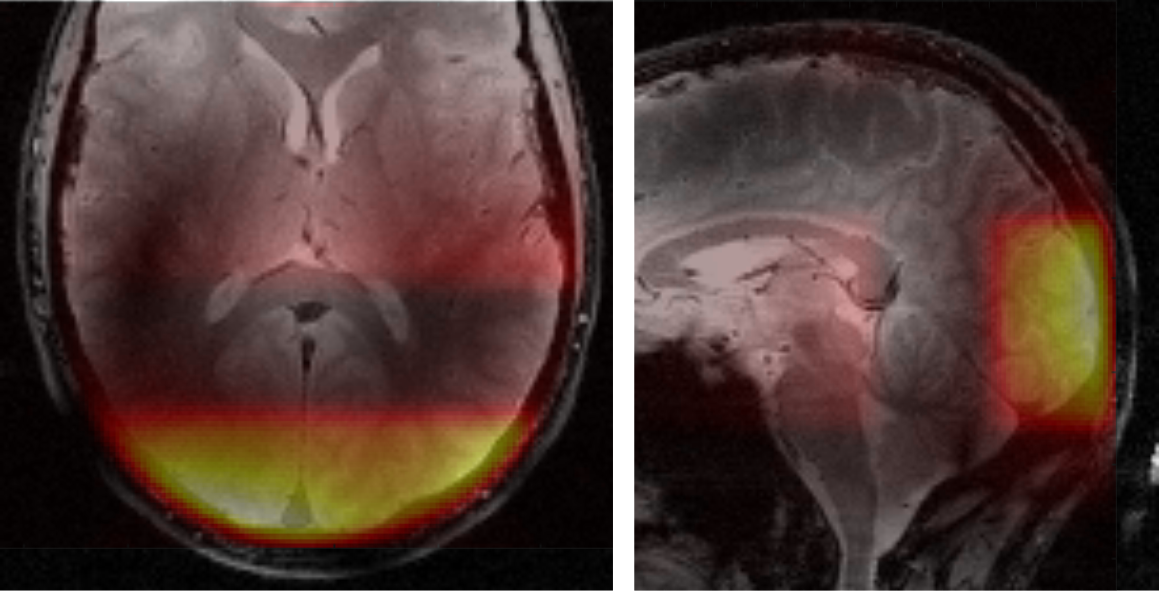
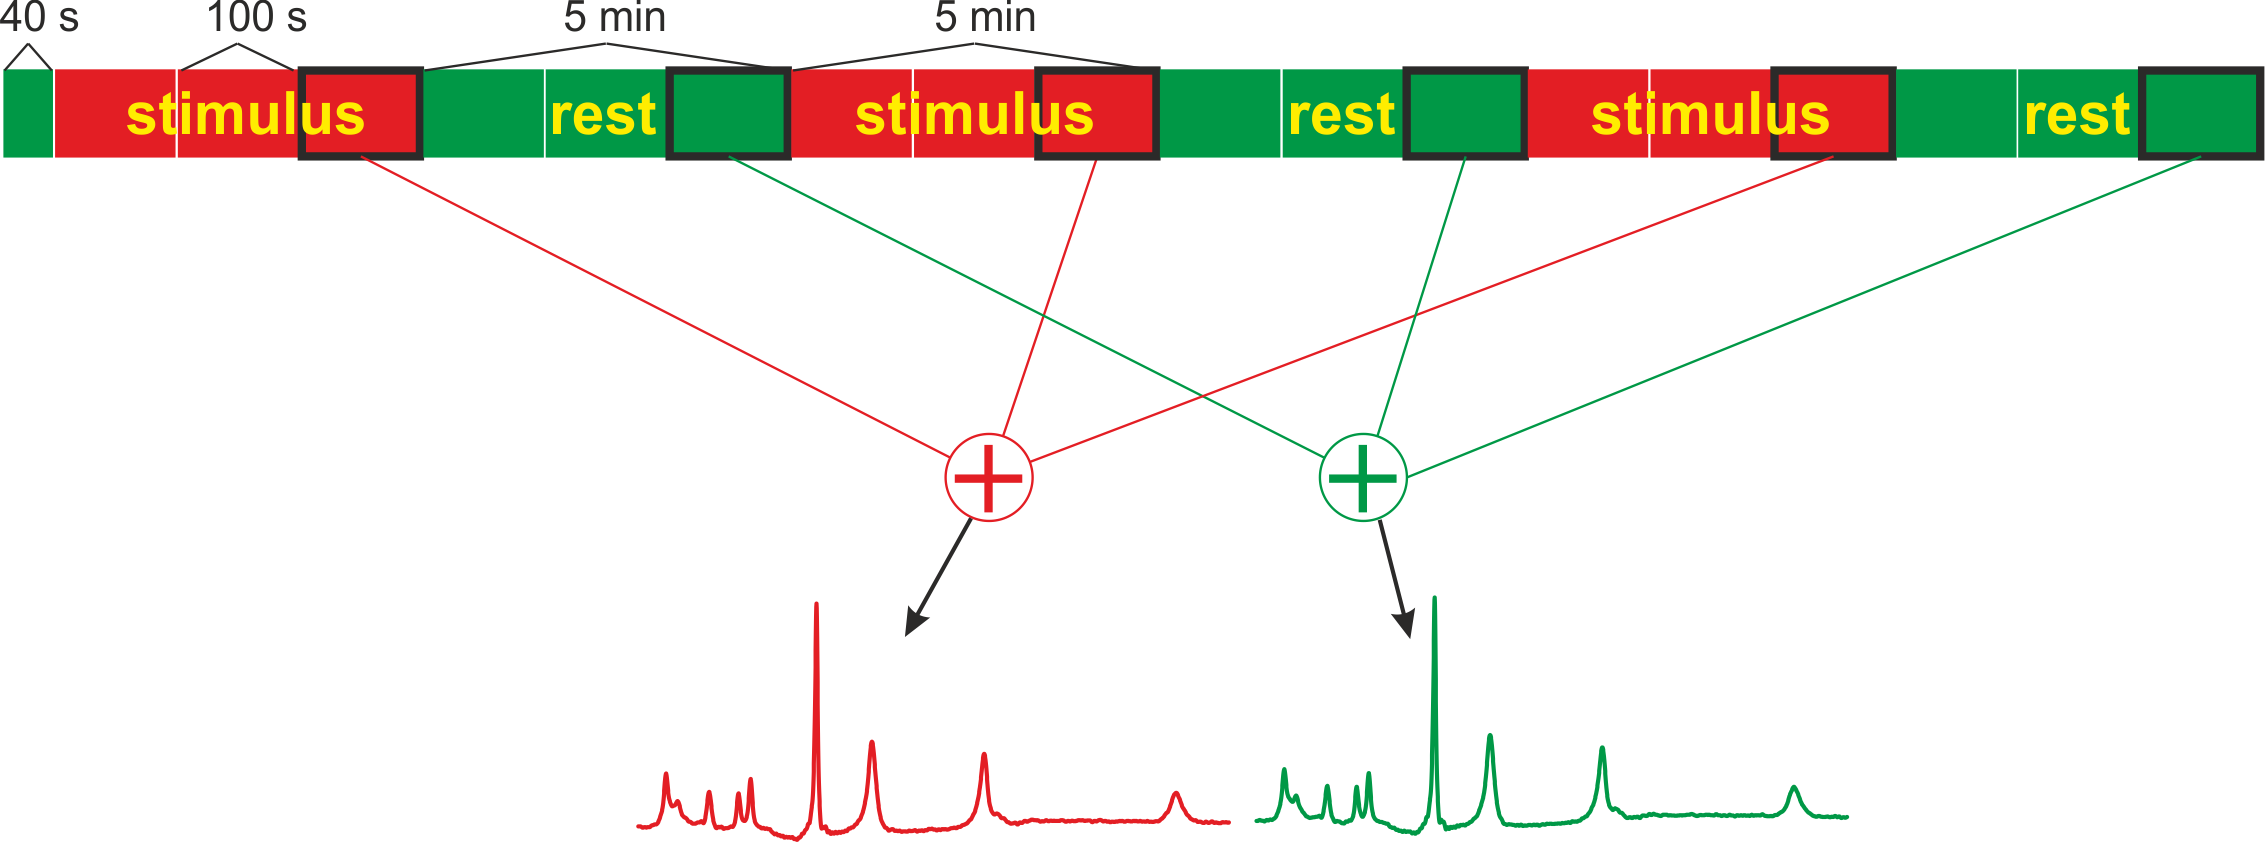
Measurements on ten healthy volunteers were performed on a 9.4 T whole body magnet, using a 1H/31P coil with 31 receive channels placed on a tight-fitting helmet6. The spectra were acquired with a simple fid-sequence, where three additional saturation pulses before the excitation suppressed signal from outside of the visual cortex. In addition, only signals from the two receive coil elements closest to the visual cortex are used for analysis. This combination of coil sensitivity and saturation slices for localization leads to a high spatial selectivity (Fig. 1).A total of 5520 spectra were acquired with a TR of 330 ms (due to SAR constraints) within slightly more than 30 min using the Ernst angle of 28° for excitation. For visual stimulation, a rotating checkerboard was presented to the subject. After 120 scans at rest, the paradigm consisted of 3 repetitions of 5 min stimulus and 5 min rest periods (Fig. 2).
For analysis, only the last third of each stimulus and rest period were used to allow sufficient time for equilibrium to be reached. Those 100 signals from all three epochs were averaged, Fourier-transformed and quantified using the Amares algorithm from the jMRUI package. In addition, spectra from all ten subjects were added to better detect small signals like Pi,ext.
Results
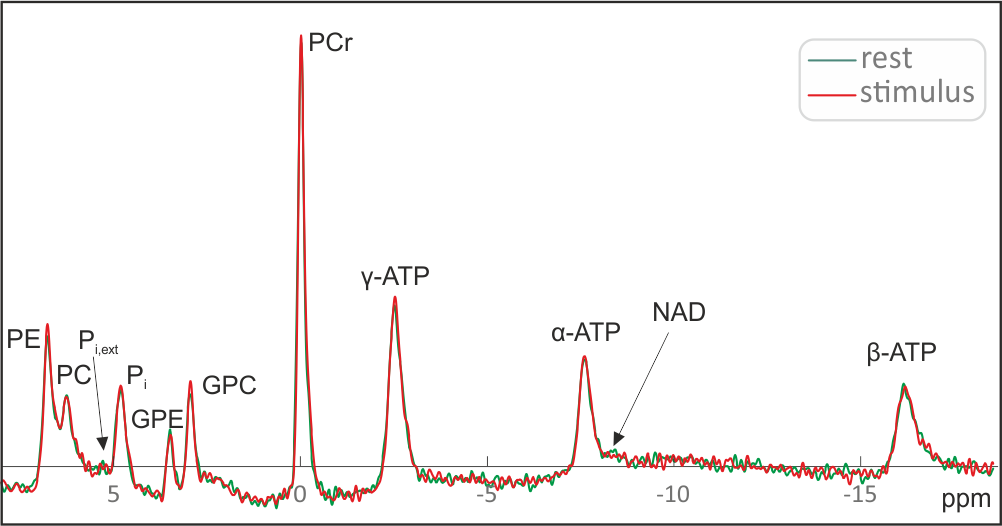
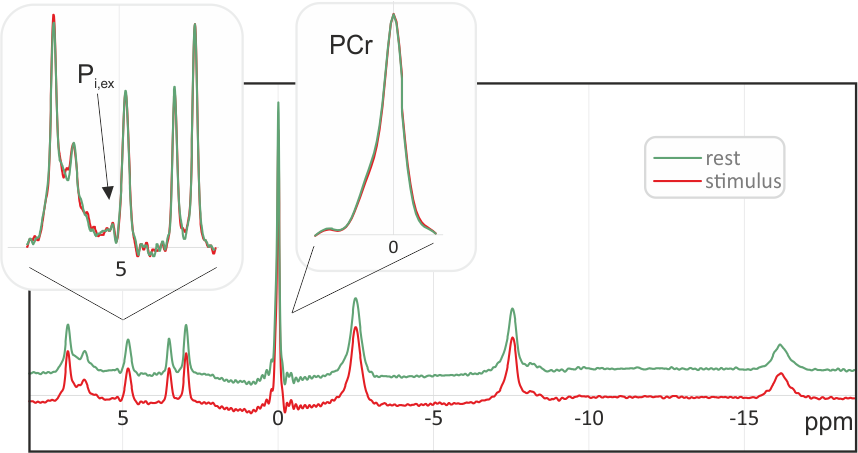
All measurements on all ten subjects resulted in spectra with excellent spectral quality and SNR (Fig. 3). A direct comparison of single spectra from rest and stimulation periods does not show any clear differences between the two states. Accordingly, jMRUI does not detect significant differences in the amplitude or linewidth of the PCr peak, which would be a manifestation of the BOLD effect. While the Pi,ext signal can be identified in several of the spectra, its signal-to-noise ratio is not sufficient for reliable quantification.Figure 4 shows the resulting spectra after averaging of all ten subjects. Due to the significantly improved SNR, the Pi,ex peak can be clearly identified. However, no significant changes in the position or amplitude of the Pi,ex signal, nor in the amplitude and linewidth of the PCr peak can be found.
Discussion
In spite of the high SNR and spectral quality that was reached due to the combination of the high field strength, the highly sensitive multi-channel coil and the applied acquisition technique, we were not able to find any significant differences between spectra acquired at rest and during a relatively long stimulation. To further decrease the size of the ROI might help to better localize the area with the strongest stimulus, however, this would require even longer experiments for sufficient averaging of the inherently insensitive 31P signals.Acknowledgements
No acknowledgement found.References
1. Barreto FR, Costa TB, Landim RC, Castellano G, Salmon CE. (31)P-MRS using visual stimulation protocols with different durations in healthy young adult subjects. Neurochem Res 2014; 39(12): 2343-50.
2. Da Silva Costa TB, Landim RCG, Barreto FR, Da Silva EL, Salmon CEG, Castellano G. Investigation of possible high-energy phosphate concentration changes in the visual cortex for different stimulus frequencies. Research on Biomedical Engineering 2019; 35(3-4): 203-11.
3. Hendriks AD, van der Kemp WJM, Luijten PR, Petridou N, Klomp DWJ. SNR optimized 31P functional MRS to detect mitochondrial and extracellular pH change during visual stimulation. NMR in Biomedicine 2019; 32(11): e4137.
4. Van De Bank BL, Maas MC, Bains LJ, Heerschap A, Scheenen TWJ. Is visual activation associated with changes in cerebral high-energy phosphate levels? Brain Structure and Function 2018; 223(6): 2721-31.
5. Yuksel C, Du F, Ravichandran C, et al. Abnormal high-energy phosphate molecule metabolism during regional brain activation in patients with bipolar disorder. Mol Psychiatry 2015; 20(9): 1079-84.
Figures