1359
Performance of a TEM 2H/1H 7T head coil1Wolfson Brain Imaging Centre, University of Cambridge, Cambridge, United Kingdom, 2Virtumed LLC, Minneapolis, MN, United States
Synopsis
Deuterium metabolic imaging (DMI) has been proposed as a means to probe glucose uptake and metabolism. It is expected that DMI will reveal important changes in cancer and neurodegeneration. We constructed a dual-tuned 7T 2H/1H array coil and assessed appropriate RF power limits by EM modelling. The coil performance has been assessed with phantom scans on a D2O-enriched agar phantom. We are now ready to start human in vivo scanning.
Introduction
Many diseases such as cancer, diabetes or neurodegeneration involve critical changes to metabolism.1 Magnetic resonance spectroscopy (MRS) and spectroscopic imaging (MRSI) are powerful non-invasive tools to probe metabolism in vivo. The new method of deuterium metabolic imaging (DMI) has been proposed to track glucose uptake and metabolism into glycolysis and the TCA cycle. De Feyter et al2 showed that DMI with a [6,6'-2H2]-glucose substrate could offer an alternative to 18FDG-PET. DMI can attain 1 mL nominal spatial resolution at 7T.3 Our aim is to construct a high-performance deuterium head coil with proton capability for localisation and shimming. Safe RF power limits, B1+ performance and SNR of this new coil are assessed in this work.Methods
Coil designThe coil comprises a 15-element transverse electromagnetic mode (TEM) resonator for 2H transmit, a 16-element loop array for 2H receive, and a 4-element loop array for 1H transmit and receive. The coil is shown in Figure 1 together with a 3D rendering of the 2H and 1H transmit structures. It was built by Virtumed LLC.
Electromagnetic field simulations
Simulations were performed in CST Studio Suite 2021 (Dassault Systemes). Specific absorption rate (SAR) and B1+ fields were computed for a saline phantom (conductivity 1.0 S/m) and for the Laura and Gustav human voxel models. The 1H and 2H transmit elements were simulated separately, since with the significant difference in the resonance frequencies, they have negligible coupling. B1+ field histograms were computed based on voxels with “brain” material type in the voxel models.
Phantom studies
An agar phantom was prepared in a cylindrical phantom (Fisher) comprising water enriched to 2% abundance for HOD (singly-labelled water), agar, sufficient NaCl to yield a conductivity of 1.0 S/m4 and a T1 relaxation agent (Dotarem) to target T1=1100 ms for protons at 7T. Images were collected using the GRE pulse sequence (voltages from 20-200 V, pulse length 20 ms, TR 900 ms, TE 10ms, 3 averages, total acquisition time 11’33’’) with 8 slices over a 32×32 matrix. Noise was assessed from an ROI drawn outside the phantom and hence imaging signal-to-noise ratios were calculated. A 3D UTE CSI sequence with a spatial resolution of 12.5× 12.5× 25 mm3 was run. Spectra were fitted using AMARES as implemented in the OXSA toolbox4.
B1+ maps were obtained by non-linear least-squares minimizations to the FLASH signal equations,
$$I(V)=\frac{a (\sin bV)(1-e^{-T_R/T_1})}{(1-\cos bV)e^{-T_R/T_1}},$$
where a is a complex number proportional to the receive sensitivity, and b is the flip angle per volt at that pixel (i.e. the transmit field strength). Maps of b were then converted to B1+ in Hz per volt by multiplication of the number of degrees flip angle per Hz calculated for the rectangular pulse used in the GRE acquisitions.
Results
SARThe maximum SAR-10g was 0.200 kg-1 (Laura) and 0.352 kg-1 (Gustav) for 2H, and 0.508 kg-1 (Laura) and 0.432 kg-1 (Gustav) for 1H. The heating profiles are shown in Figure 2.
B1 maps
Figure 3 shows the simulated B1+ field distribution over the human voxel model, normalised to 1 W input power without accounting for losses. At the centre of the brain, we predict 0.77 uT/sqrt(W) B1+ field strength for 1H and 0.54 uT/sqrt(W) for 2H.
Figure 4 shows measured phantom B1+ maps in comparison to an equivalent slice in the simulated model.
Our fitted 2H T1 was 101ms. This compares to 2H T1=409 ms report at 11.7 T by de Graaf et al.3 Our value is likely due to both the efficient quadrupolar relaxation of deuterium, and to having added Dotarem.
Signal to noise ratio
For the 120V GRE scan acquired in 11’33’’, the average SNR across all slices is 48.7 for voxels within the masked region (see Figure 5(a)). This is sufficient for clear 2H imaging and promising for highly resolved 2H-MRSI applications in the brain. Peak SNR was >200 in peripheral voxels. We see evidence of some B1+ shading in the centre of the phantom.
Spectroscopy
Figure 5(c) shows an example spectrum from the phantom. There is a single clear HOD peak as expected. Taking 8 central voxels, the linewidth was 9 ± 4 ppm (mean±SD).
Discussion and conclusions
Our TEM 2H/1H coil design delivers homogeneous B1+ fields at both the 2H and 1H 7T frequencies. Phantom scans and EM modelling results are in good agreement, allowing us to recommend appropriate k-factors of 1.83 kg-1 for 2H and 2.96 kg-1 for 1H for human in vivo scans. We expect to perform in vivo scans imminently.Acknowledgements
This research was supported by the NIHR Cambridge Biomedical Research Centre (BRC-1215-20014). The views expressed are those of the author(s) and not necessarily those of the NIHR or the Department of Health and Social Care. C.T.R. is funded by the Wellcome Trust and Royal Society (098436/Z/12/B). M.Z. is funded by the Medical Research Council (MR N013433-1) and the Cambridge Trust.
References
1. Di Gialleonardo, V., Wilson, D. M. & Keshari, K. R. The Potential of Metabolic Imaging. Semin Nucl Med 46, 28–39 (2016).
2. De Feyter, H. M. et al. Deuterium metabolic imaging (DMI) for MRI-based 3D mapping of metabolism in vivo. Sci Adv 4, eaat7314 (2018).
3. De Graaf, R. A. et al. On the magnetic field dependence of deuterium metabolic imaging. NMR Biomed 33, e4235 (2020).
4. Purvis, L. A. B. et al. OXSA: An open-source magnetic resonance spectroscopy analysis toolbox in MATLAB. PLoS One 12, e0185356 (2017).
Figures
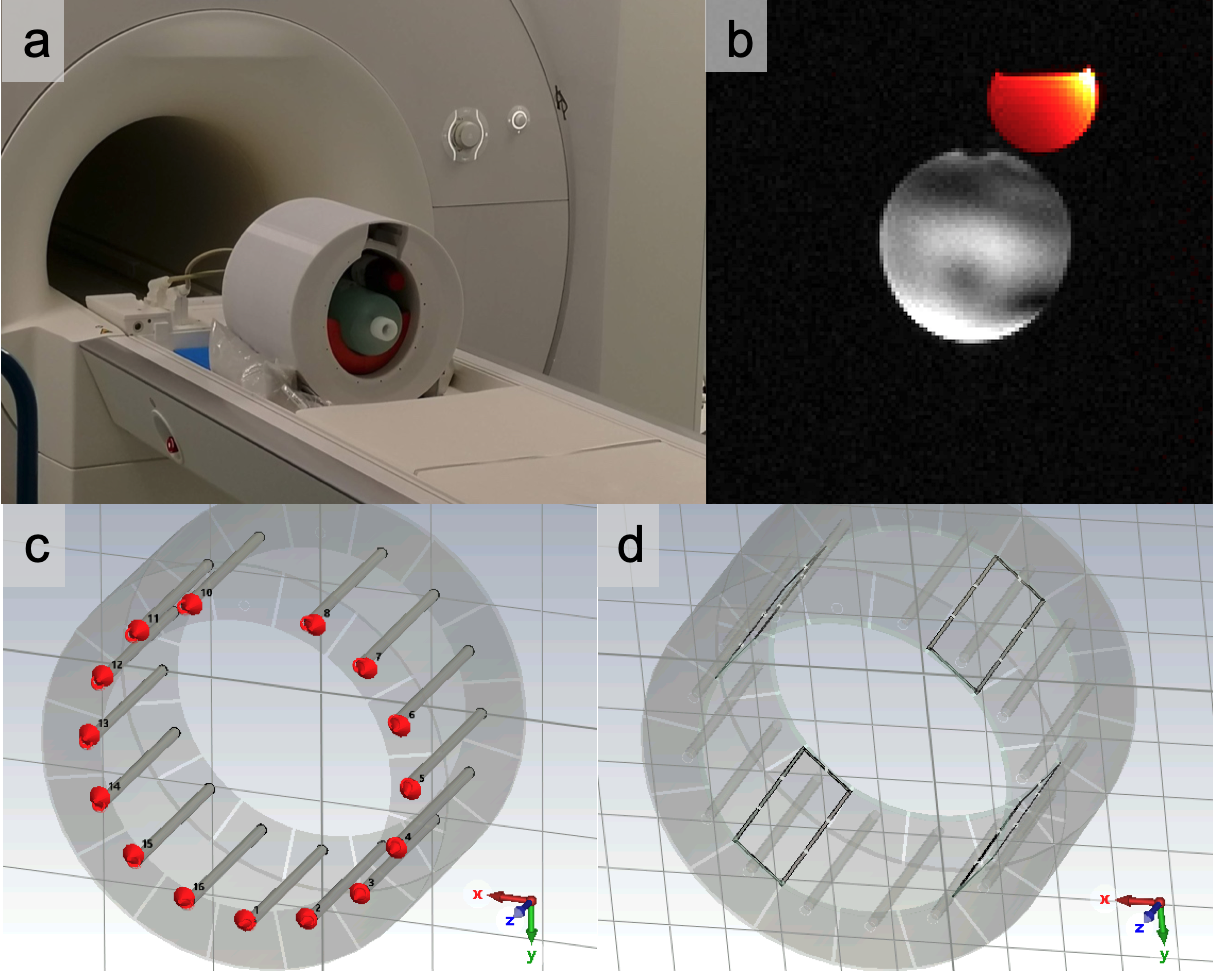
Figure 1 (a) The Virtumed TEM 2H/1H 7T head coil. (b) Phantom test image of 1H GRE (grey) and 2H GRE (orange). (c) The simulation model in CST Studio Suite with the 2H Tx component highlighted and (d) the 1H component highlighted.
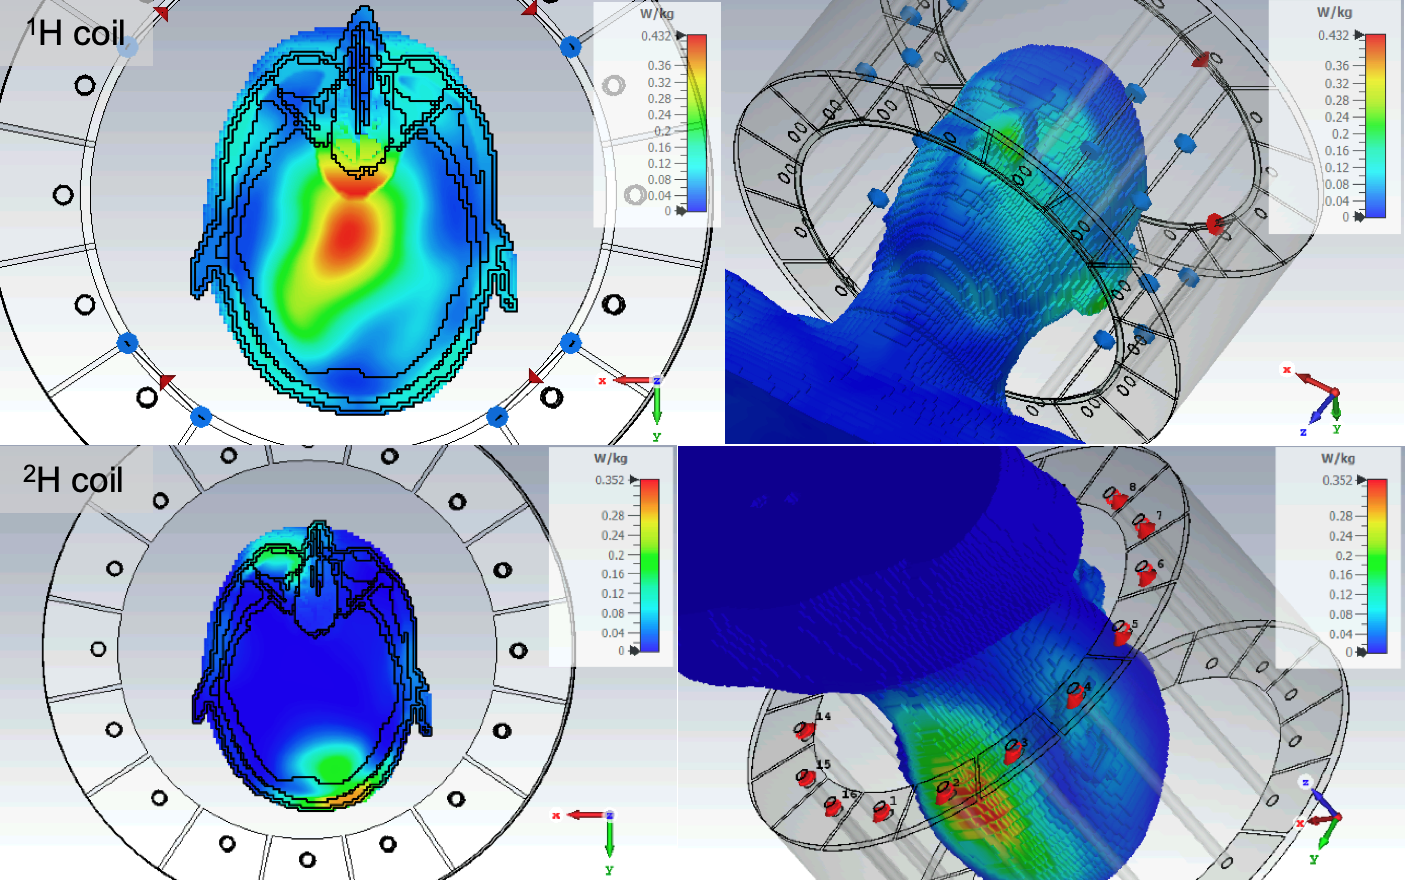
Figure 2 The heating profiles (10 g SAR plot) for 1H (top) and 2H (bottom) coils for the simulated Gustav voxel model.
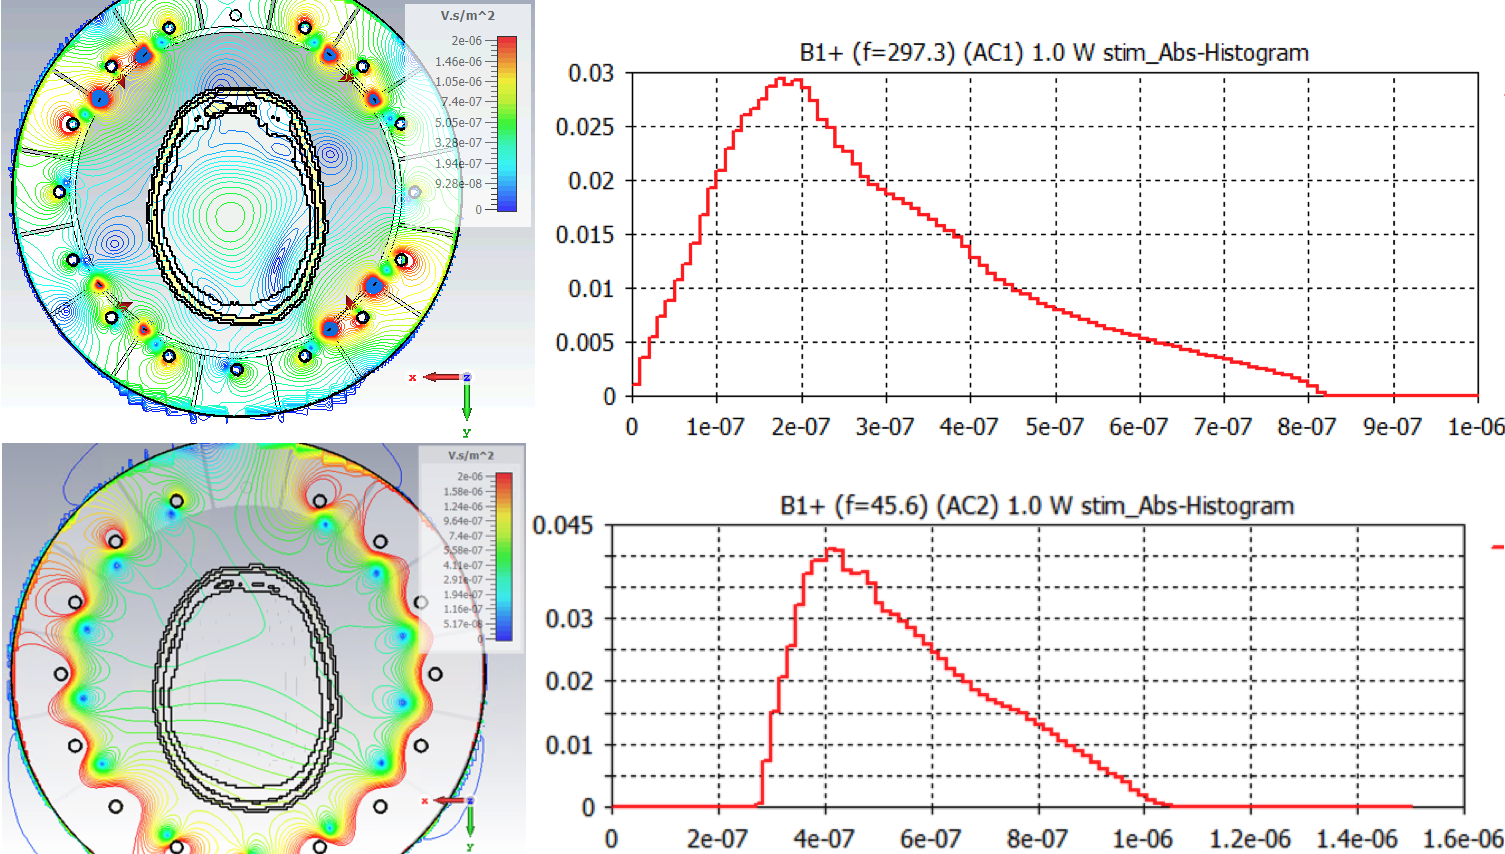
Figure 3 Simulated B1+ field and field histogram in brain for the 1H (top) and 2H (bottom) components.
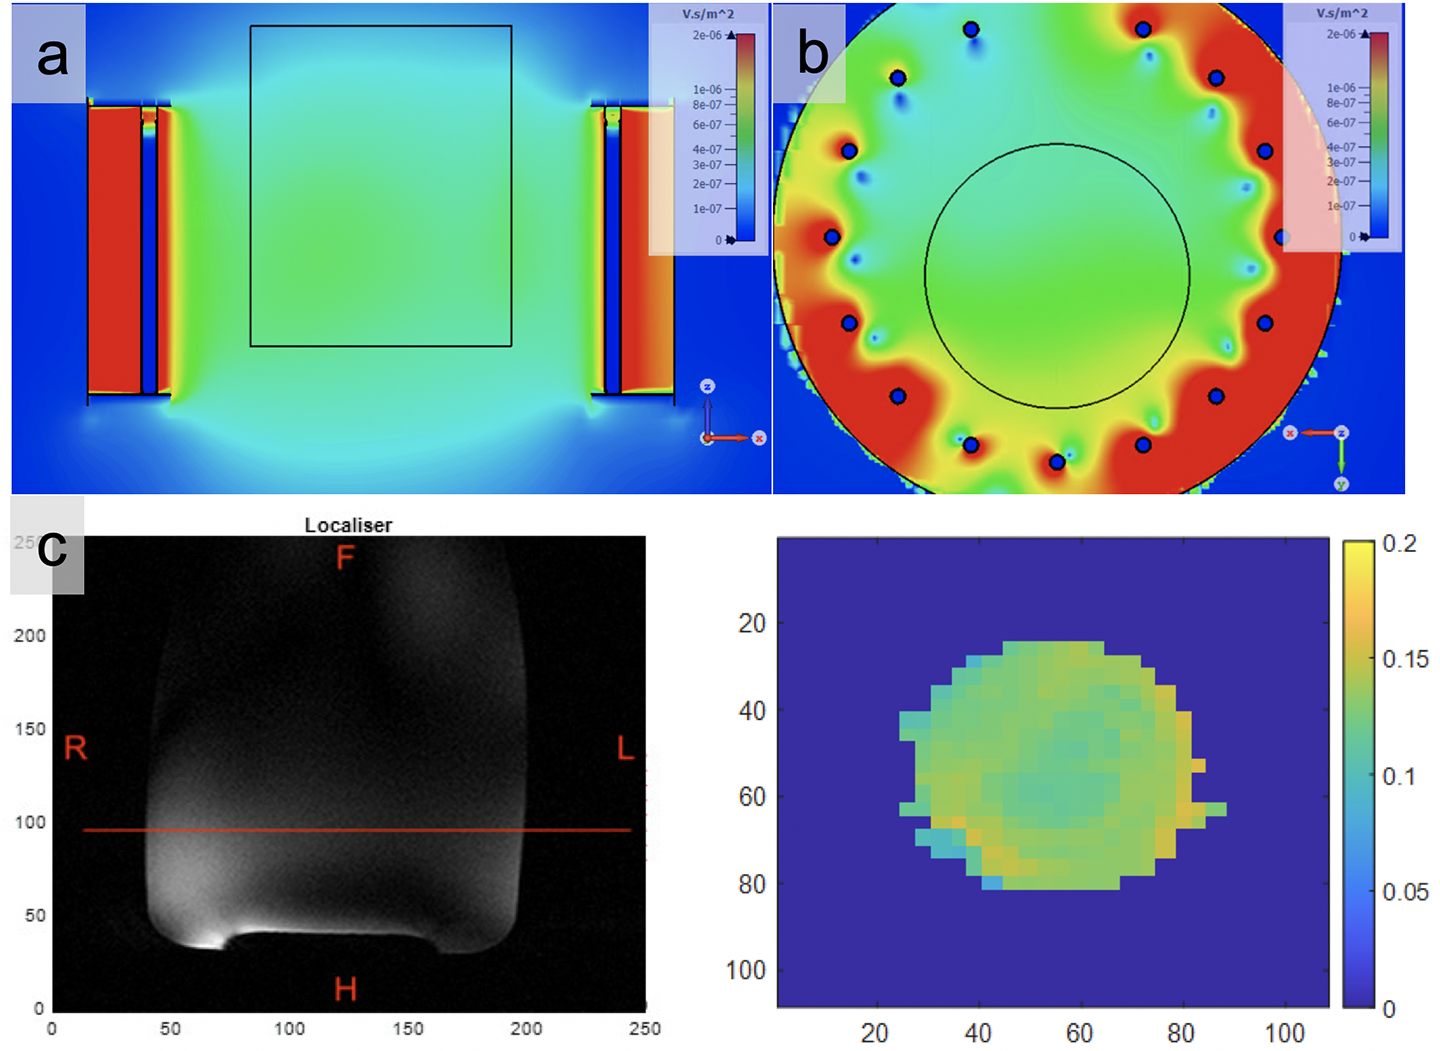
Figure 4 Comparison between the simulated and measured B1+ field maps for a cylindrical agar phantom of 1.0 S/m conductivity. (a) Coronal and (b) transverse views of the simulated field in units of uT/sqrt(W) input power. (c) Measured phantom B1+ map in uT/sqrt(W) at the slice position indicated on localiser (expected location of the centre of brain). Based on a 32x32 matrix and interpolated. Localiser scale in mm and B1 map scale in pixels.
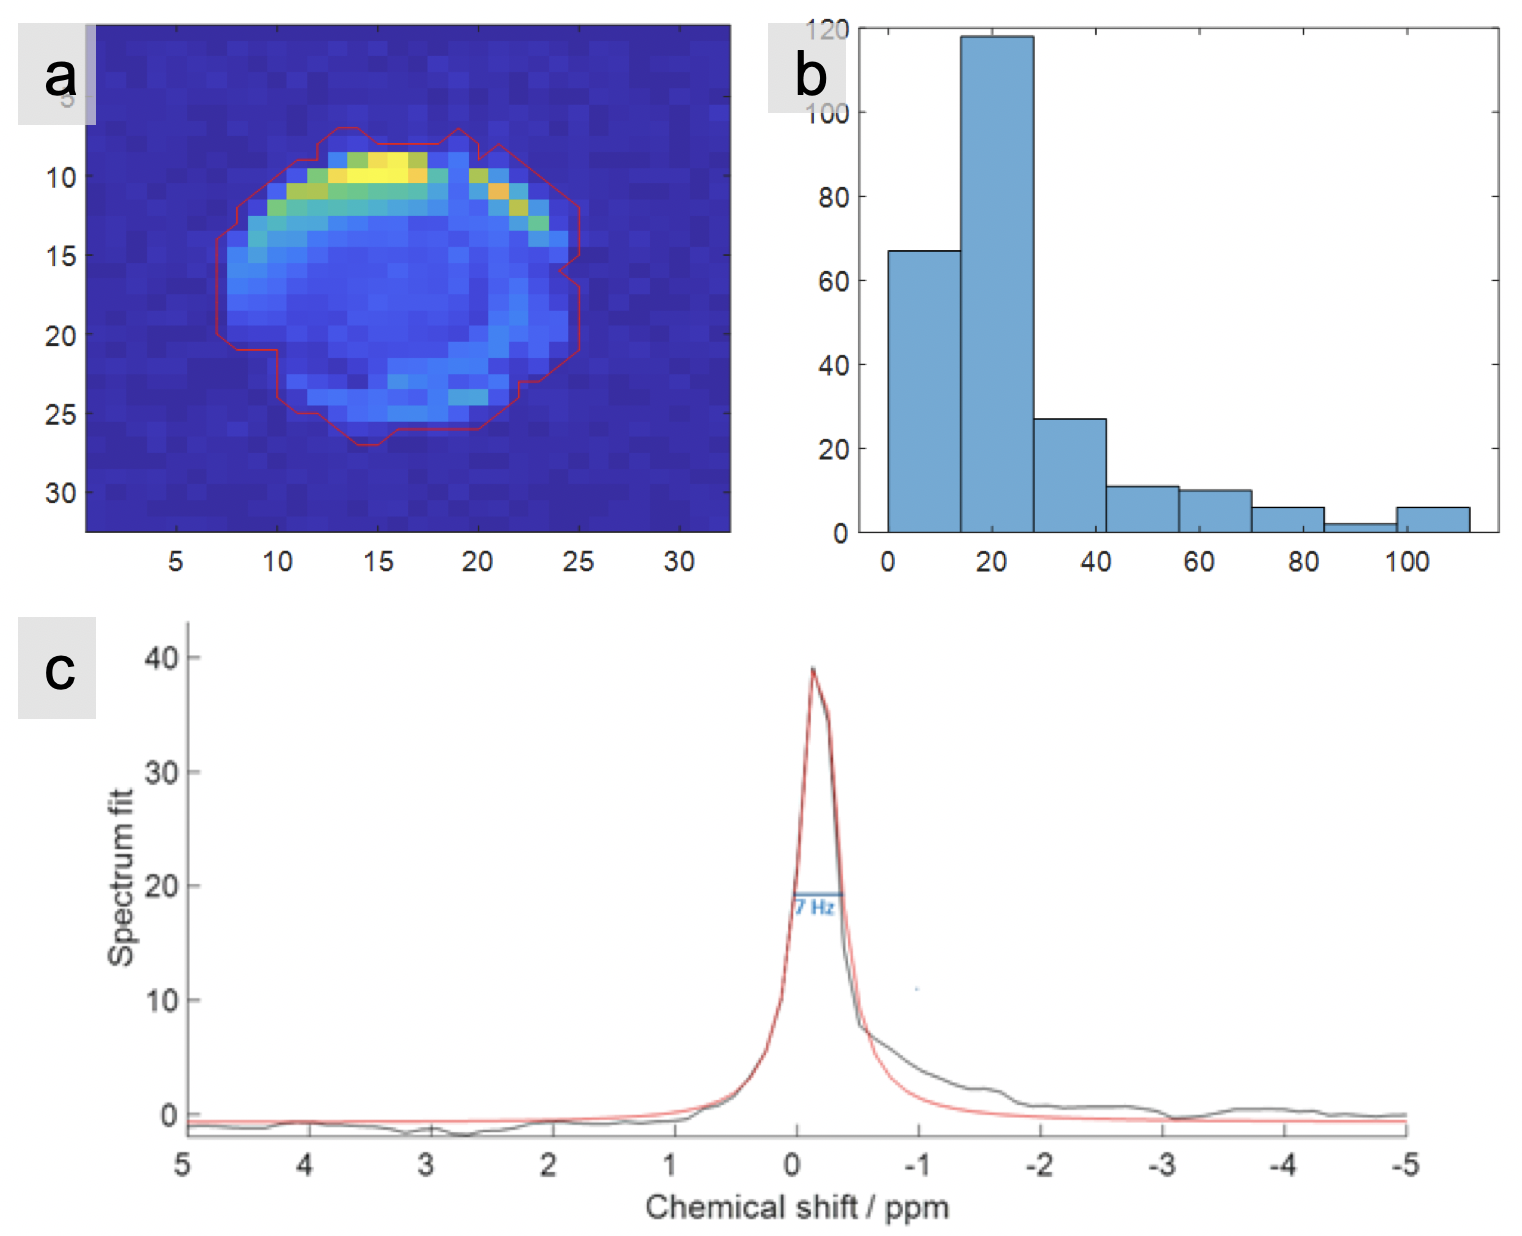
Figure 5 (a) One slice of 2H image (slice position as in Figure 4) at maximum voltage of 120V with (b) accompanying histogram of pixel SNR after masking. The red line connects the centres of excluded pixels at the boundary of the mask. (c) 2H spectrum from a pixel and single-peak fitting by AMARES.