1358
Monitoring water uptake in the human body during oral loading of heavy water using deuterium magnetic resonance1School of Physics and Astronomy, University of Nottingham, Nottingham, United Kingdom, 2Sir Peter Mansfield Imaging Centre, University of Nottingham, Nottingham, United Kingdom, 3Mental Health and Clinical Neuroscience, School of Medicine, University of Nottingham, Nottingham, United Kingdom, 4NIHR Nottingham Biomedical Research Centre/Nottingham Clinical Research Facilities, Queen's Medical Centre, Nottingham, United Kingdom, 5Division of Cancer and Stem Cells, School of Medicine, University of Nottingham, Nottingham, United Kingdom, 6MRC-Versus Arthritis Centre for Musculosketal Ageing Research, University of Nottingham, Nottingham, United Kingdom, 7Division of Medical Sciences and Graduate Entry Medicine, School of Medicine, University of Nottingham, Nottingham, United Kingdom, 8School of Life Sciences, University of Nottingham, Nottingham, United Kingdom
Synopsis
Deuterium magnetic resonance imaging and spectroscopy at 7T has been used to follow the deuterium concentration in the brain over an ~eight-hour period while subjects orally-loaded with D2O to 100x natural abundance. Changes in deuterium concentration of ~ 0.1% can be readily monitored in 2H spectra acquired in 1 minute and images acquired in 7.5 minutes. The change in deuterium concentration estimated from 2H spectra is in agreement with the value calculated from cumulative D2O dose and body mass and the signal changes measured from ROIs in the brain have similar time-courses, with relative signal strengths dictated by T2*-weighting.
Introduction
Oral loading of heavy water is commonly used for assessment of body composition1 and is increasingly applied in studies of protein turnover2. These approaches involve analysis of body fluid or breath samples, and require knowledge of the temporal variation of the deuterium fraction in water within different tissues. Deuterium magnetic resonance measurements are of growing interest in metabolic imaging3, with the rapid quadrupolar T1 relaxation of 2H allowing faster signal averaging, that partially compensates for its low sensitivity. Deuterium MRI potentially allows direct measurement of the deuterium concentration in water and lipids4 in the different organs and tissues, and so could complement measurements on body fluid samples in loading studies.Here, we used deuterium magnetic resonance at 7T to follow the change in deuterium signals from the brain while two subjects orally loaded with heavy water over an ~eight-hour period.
Method
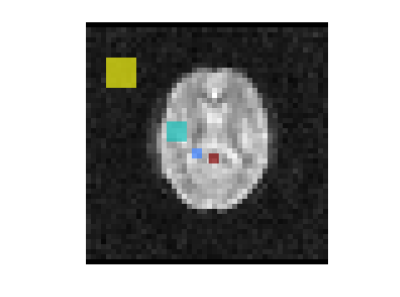
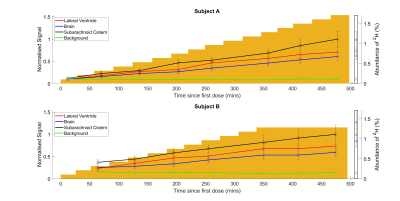
Two male subjects (23 and 54 years age) participated in this study which involved carrying out repeated 2H MR measurements during the initial oral loading with 800 ml of heavy water in a parallel proteomics study, aiming to raise the 2H concentration to around 1.5% (100x natural abundance) over a six-week period. The subjects drank 50 ml of D2O every thirty minutes up to maximum doses of 800 and 600 ml. Immediately after the dosing, a ~15-minute scanning protocol was carried out on a Philips Achieva 7T scanner, using a dual-tuned 2H/1H head birdcage coil (Rapid Biomedical). In addition to a 1H scout-scan, we acquired: (i) 2H spectra from the whole head and (ii) from a 2-cm-thick axial slice positioned over the lateral ventricles (2048 samples, BW = 3000Hz; TR =1s; TAQ = 64s); (iii) axial multi-echo GE (MEGE), 2H images (TAQ = 453s, FOV = 288x288x80mm3, 6x6x10mm3 voxels, FA= 60o TR = 62ms, 5 echoes, TE1 = 8.9ms, ΔTE = 8.4 ms) and (iv) axial 1H GE images (TAQ = 232 s, 32 slices, FOV = 288x288x80mm3, 3x3x2.5mm3 voxels, TE = 5.9ms, TR =39ms) which were used for identifying regions of interest. The 2H images acquired at the five different TEs were averaged together for subsequent analysis. A similar set of measurements was also acquired after 12 days of loading.Spectroscopy measurements of signals produced by the 0.015% concentration of 2H in water at natural abundance were also acquired before D2O loading and used to scale the subsequent measurements to provide an MR-based estimate of the deuterium concentration. The proportion of heavy water in the body at each time-point was also estimated from the ratio of the imbibed D2O volume in litres to 0.73*body weight in kg1. Regions of interest in brain tissue, the lateral ventricles, subarachnoid cistern (SC) and a background region were defined on the 1H image (Figure 1). The average 2H signal strength in each ROI was scaled by the largest signal value measured (in SC) and then plotted against time to allow comparison of the 2H-signal changes in each compartment.
Results
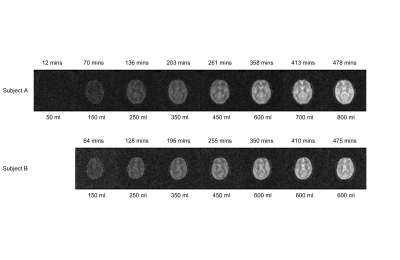
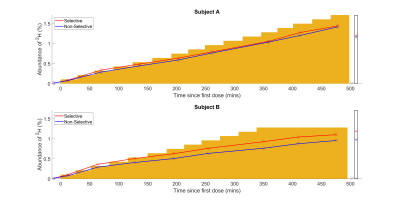
Figure 2 shows axial 2H images acquired at different times during the loading process. The increase in signal strength with time/D2O dose shown in these images is also evident in the temporal variation of 2H concentration estimated from the spectroscopy data shown in Figure 3. Figure 4 shows the variation of average signal in the four ROIs during the loading, with all signals scaled to the signal measured in the SC at the latest time point during initial loading. Figures 3 and 4 also show the 2H concentration estimated from the cumulative D2O dose and body weight, for comparison.Discussion
The results show that changes in concentration of deuterium of the order of 0.1% can be readily monitored in 2H spectra acquired over 1 minute and images acquired over 7.5 minutes. In the TE-averaged MEGE images used here, image contrast is dominated by T2*-weighting, with the CSF appearing hyperintense relative to grey and white matter (Figure 2). At an estimated concentration of 0.5% 2H, the ratio of signal to background noise varied from ~2.7 (brain) to ~3.1 (subarachnoid cistern) and these values increased approximately linearly with concentration as expected (Figure 4) to ~steady state levels over the 8 hour loading. The change in deuterium concentration estimated from the 2H spectra is in reasonable agreement with the value calculated from cumulative dose and body mass (Figure 3). In addition, the signal changes measured from ROIs in the brain have similar time-courses maintaining relatively constant ratios, dictated mainly by differences in T2*-weighting (Figure 4). This implies that the 2H MR measurements are robust and that the dispersal kinetics of deuterium following oral ingestion of D2O are rapid throughout the body on the timescale of the measurements. This is consistent with previous measurements based on blood sampling which indicate that the half-life of absorption into blood is ~12min, with similar time constants for dispersal into other body water compartments4,5.Conclusion
Deuterium MR measurements at 7T have been successfully used to track the increase in concentration of 2H in brain during heavy water loading. In future work we aim to track uptake from a single dose on a shorter time scale, using faster, interleaved acquisition of 2H images and spectra.Acknowledgements
The pilot study into immune cell responses in cancer is supported by Cancer Research UK [A29820]. The 2H imaging research is co-funded by the NIHR Nottingham BRC and CRF. DC’s Ph.D. studies are funded by the Precision Imaging Beacon at the University of Nottingham.
References
- International Atomic Energy Agency (IAEA) (2011). Introduction to Body Composition Assessment Using the Deuterium Dilution Technique with Analysis of Saliva Samples by Fourier Transform Infrared Spectrometry. IAEA, Vienna.
- Wilkinson, D.J. et al. (2017), Stable isotope tracers and exercise physiology: past, present and future. Journal of Physiology 595.9 2873–2882.
- De Feyter, H. M., et al. (2018). Deuterium metabolic imaging (DMI) for MRI-based 3D mapping of metabolism in vivo. Science Advances 4(8): 7314.
- Brereton, I. M. et al. (1989) The Use of in vivo 2H NMR Spectroscopy to Investigate the Effects of Obesity and Diabetes Mellitus Upon Lipid Metabolism in Mice, NMR in Biomedicine, 2, 55-60.
- Davies, S. et al. (2001) Rapid measurement of deuterium content of breath following oral ingestion to determine body water. Physiological Measurement 22 651–659.
- Péronnet,
F. et al. (2012) Pharmacokinetic analysis of absorption, distribution and
disappearance of ingested water labeled with D2O in humans. European
Journal of Applied Physiology 112, 2213–2222.
Figures

Figure 1. Regions of interest used for following the time-course of signal change during D2O loading. Red = subarachnoid cistern; Blue = lateral ventricle; Turquoise = brain (grey matter, white matter and CSF); Yellow = background noise.

Figure 2. 2H images acquired at different times during the heavy water loading for the two subjects. The time since the first dose is indicated above each image and the cumulative dose of heavy water is indicated below. A single axial slice spanning the lateral ventricles is shown. Each set of 3D MEGE 2H images was acquired in ~7.5 minutes with FOV = 288x288x80 mm3, 6x6x10 mm3 voxels, FA= 60o TR = 62 ms. The images shown are formed from the average over 5 echoes (TE1 = 8.9 ms, ΔTE = 8.4 ms).

