1357
Deuterium metabolic imaging of a healthy human brain after oral glucose uptake on a clinical 3T MRI scanner
Michael Vaeggemose1,2, Rolf F. Schulte3, Christoffer Laustsen2, Esben Søvsø Szocska Hansen2, and Nikolaj Bøgh2
1GE Healtcare, Broendby, Denmark, 2MR Research Centre, Department of Clinical Medicine, Aarhus University, Aarhus N, Denmark, 3GE Healtcare, Munich, Germany
1GE Healtcare, Broendby, Denmark, 2MR Research Centre, Department of Clinical Medicine, Aarhus University, Aarhus N, Denmark, 3GE Healtcare, Munich, Germany
Synopsis
Deuterium metabolic imaging (DMI) has emerged as a novel biomarker comparable to 18FDG PET by adding quantitative metabolic kinetic capabilities at high field (>3T). The main barrier for widespread clinical adoption, is the availability of high field clinical scanners. The aim of this study is to determine if DMI for neurological applications is feasible on a clinical 3T MRI scanner. Our findings suggests that it is indeed feasible, and that metabolic breakdown product (Glutamine/Glutamate) can be quantified around 120 min after ingestion.
Introduction
Deuterium metabolic imaging has emerged as a novel biomarker mimicking 18FDG PET by adding quantitative metabolic kinetic capabilities [1], [2]. The MR method has received renewed interest as imaging was demonstrated in humans at B0 = 4T, a field strength close to conventional clinical MRI scanners [3]. Nevertheless, the challenges of adapting the method (signal-to-noise and spectral separation) to clinical scanners may be the main barrier for widespread adoption. If translation would be possible applications could go beyond 18FDG PET applications to include quantitative analysis of glycolytic pathways [4], determination of glutamate/glutamine (Glx), and lactate conversion in diseases such as brain cancer [2]. Consequently, the aim of this study is to determine if deuterium imaging of a healthy human brain is feasible on a clinical 3T MRI scanner.Methods
The brain of a healthy fasted volunteer was scanned in a 3T (GE 750 MR scanner) at baseline, 15 min, 30 min, 40 min 120 min and 180 min after oral glucose ingestion. Following an initial baseline scan the subject was given 60 g [6,6-2H]-glucose (DLM-349-CTM, Cambridge Isotope Laboratories) dissolved into 50 ml tap water (0.75 g/kg), a dose similar in concentration as described in literature [3]. A commercial dual tuned 1H /2H head coil (PulseTeq) was used for proton and deuterium imaging. Deuterium imaging was performed using a 3D density weighted CSI (matrix 12x12x12, field-of-view = 250 mm, isotropic resolution = 20.8 mm3, repetition time (TR) = 170 ms, flip angle = 70o, bandwidth = 5000 Hz, excitations = 3066, points = 796, acquisition time = 8:41 min) as anatomical reference a fast-spin-echo T2-weigthed proton MRI was applied. Deuterium images were post-processed with spectral integration at D2O chemical shift (4.7 ppm) at a range of 0.76 ppm (50Hz) and filtered with a 3D Gaussian kernel to reduce noise.Results
Deuterium imaging of the brain after oral glucose ingestion showed an increase in deuterium water signal (D2O) after 30 min, peaking at 120 min and with a slight drop after 180 min (Figure 1).Analysis of the total signal spectra, from the images, acquired at baseline and 180 min after glucose ingestion point to an increase in Glx (Figure 2, green dotted line).
Assessment of deuterium spectra in two select voxels, in slice 8, at baseline and 180 min after glucose ingestion indicate low signal-to-noise ratio. Nevertheless, as seen in the spectra of the total signal (Figure 2) an increase in Glx is observed at 180 min (Figure 3, B.3).
Conclusions
Deuterium metabolic imaging (DMI) of a healthy human brain with oral glucose ingestion is feasible on a clinical 3T MRI scanner. DMI images was recorded in 8:41 min, supporting methods feasibility in a clinical application. Findings suggests an optimal time for imaging of 120 min after ingestion followed by a steady state in the following hour. Interestingly, results suggests that Glx can be measured in the brain at 3T.Acknowledgements
No acknowledgement found.References
- F. Kreis, A. J. Wright, F. Hesse, M. Fala, D. E. Hu, and K. M. Brindle, “Measuring tumor glycolytic flux in vivo by using fast deuterium MRI,” Radiology, vol. 294, no. 2, pp. 289–296, 2020, doi: 10.1148/radiol.2019191242.
- H. M. De Feyter and R. A. de Graaf, “Deuterium metabolic imaging – Back to the future,” Journal of Magnetic Resonance, vol. 326. 2021, doi: 10.1016/j.jmr.2021.106932.
- H. M. De Feyter et al., “Deuterium metabolic imaging (DMI) for MRI-based 3D mapping of metabolism in vivo,” Sci. Adv., vol. 4, no. 8, pp. 1–12, 2018, doi: 10.1126/sciadv.aat7314.
- M. Lu, X. H. Zhu, Y. Zhang, G. Mateescu, and W. Chen, “Quantitative assessment of brain glucose metabolic rates using in vivo deuterium magnetic resonance spectroscopy,” J. Cereb. Blood Flow Metab., vol. 37, no. 11, pp. 3518–3530, 2017, doi: 10.1177/0271678X17706444.
Figures
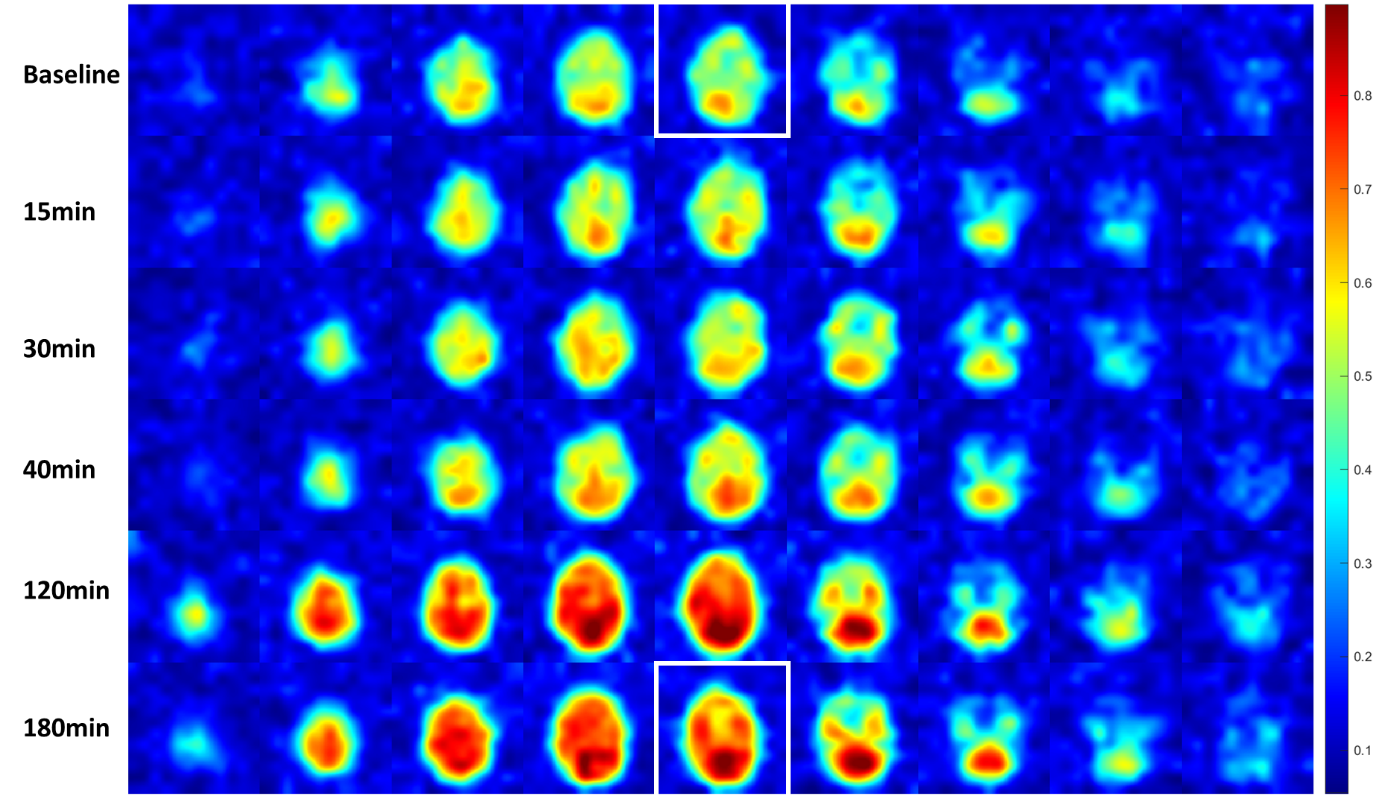
Figure
1 - Deuterium
imaging of healthy volunteer brain at baseline to 180 min after oral glucose ingestion.
Quantification of deuterium water (D2O) is calculated by integration at chemical
shift (4.7ppm) with a range of 0.8 ppm. The white squares indicate D2O images
of the brain use for further analysis in Figure 3.
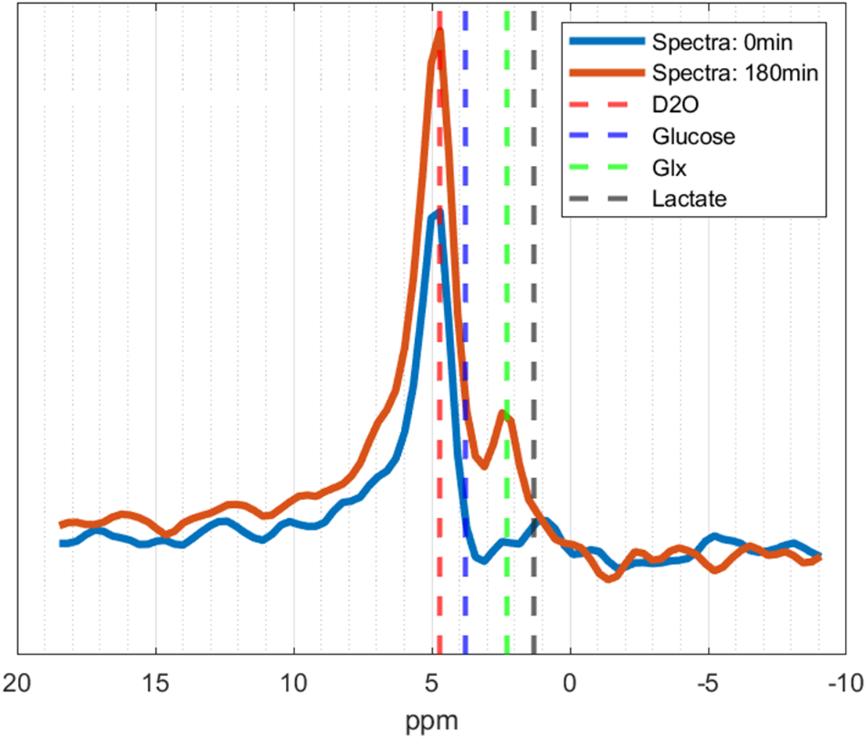
Figure
2 - Spectra of
total signal, from images, acquired at baseline (blue) and 180 min (red) after oral
glucose ingestion. Dotted lines indicate the chemical shifts of D20 (4.7 ppm),
Glucose (3.8 ppm), Glx (2.3 ppm), and Lactate (1.3 ppm).
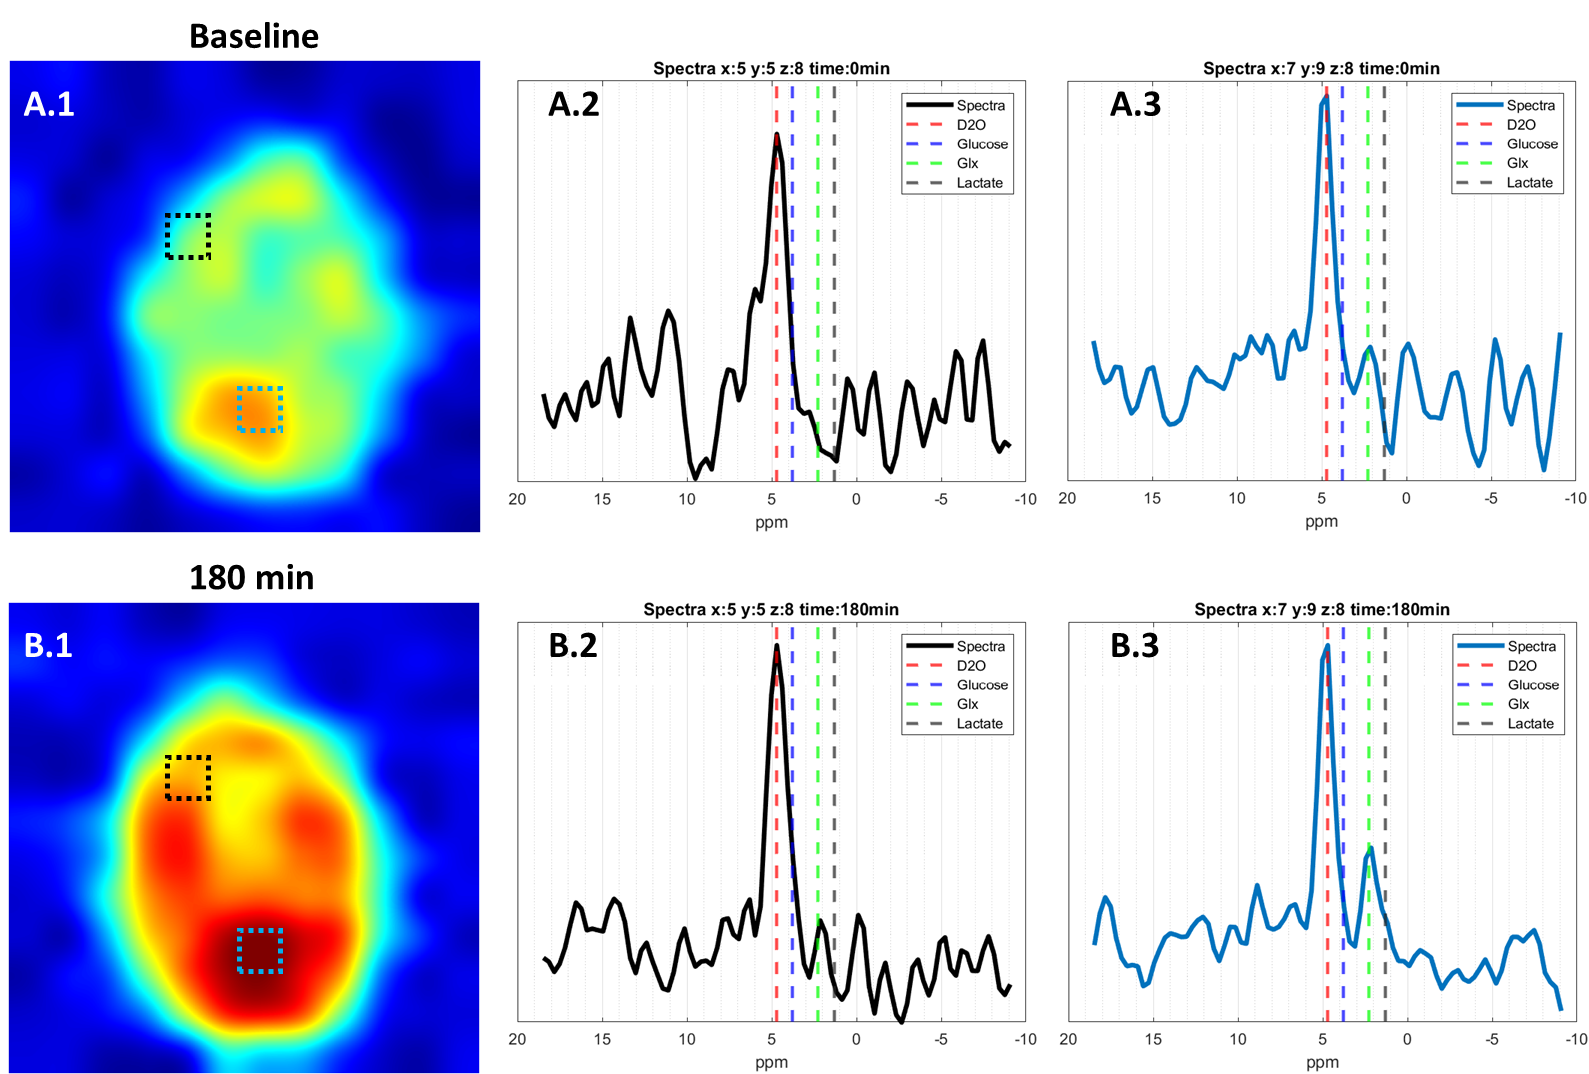
Figure
3 – Assessment of deuterium
spectra at two select voxels (Black square, x:5 y:5 z:8) and (White square, x:7
y:9 z:8) at baseline and 180 min after glucose ingestion. Dotted lines indicate
the chemical shifts of D20 (4.7 ppm), Glucose (3.8 ppm), Glx (2.3 ppm), and
Lactate (1.3 ppm).
DOI: https://doi.org/10.58530/2022/1357