1356
Prior knowledge fitting of 2H-labeled glutamate in the 1H MRS spectrum to map neural metabolism following ingestion of deuterated glucose1Department of Radiology, University of Pennsylvania, Philadelphia, PA, United States, 2Diagnostic Imaging, St Jude Children's Research Hospital, Memphis, TN, United States, 3Department of Bioengineering, University of Pennsylvania, Philadelphia, PA, United States, 4Department of Neurology, University of Pennsylvania, Philadelphia, PA, United States
Synopsis
Deuterium metabolic imaging (DMI) has brought about a renewed interest in the application of 2H-labeled substrates to map metabolism in vivo, yet deuterium spectroscopy remains challenging. We have shown that metabolism of deuterium-labeled glucose can be observed in the proton spectrum through a reduction in signal of downstream metabolites in a technique called quantitative exchange label turnover MRS (qMRS). Here, we show that prior knowledge fitting that includes unlabeled as well as deuterium-labeled forms of glutamate can be used to map neural metabolism reliably with qMRS.
Introduction
Deuterium metabolic imaging (DMI) has brought about a renewed interest in the application of 2H-labeled substrates to map metabolism in vivo1-3. In [2], 2H-labeled glucose was given to map glycolytic metabolism observed in the 2H-spectrum. However, deuterium spectroscopy remains challenging due to the requirement of specialized hardware and licenses as well as the inherent signal-to-noise limitations of low gyromagnetic ratio nuclei. Our group has recently shown that metabolism of 2H-labeled glucose can be observed in the 1H spectrum as a reduction in 1H signal on downstream metabolites in a technique called quantitative exchange label turnover MRS (qMRS).4 In particular, a reduction in the glutamate signal at 2.3ppm was observed in human brain following ingestion of deuterated glucose. Here, we show that this effect can be reliably measured using prior knowledge fitting with an extended basis set that takes into account partially deuterated isotopomers of glutamate.Methods
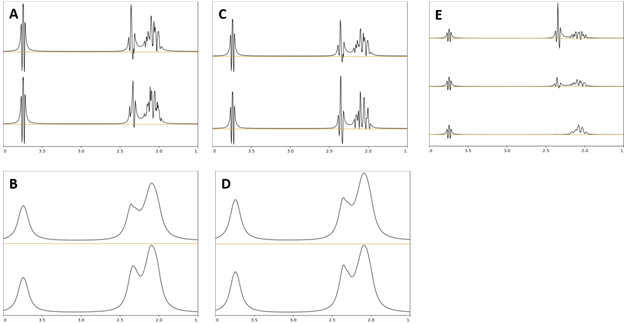
This study was approved by the local Institutional Review Board, and all subjects gave written informed consent. Four healthy subjects (two male/two female, 23-40 years old) were scanned on 7T (MAGNETOM Terra, Siemens Healthcare, Erlangen, Germany) after overnight fasting following ingestion of 0.8g/kg of body weight of [6,6’-2H2]-glucose dissolved in water. 1H-spectroscopy data was acquired using a custom 2D CSI sequence with semiLASER localization with the following parameters: TR/TE = 2050/40ms, 4 averages, 2048 points, 4kHz bandwidth, 160x160mm2 FOV, 10mm thickness. A 16x16 grid was acquired with elliptical weighting and Hamming apodization before interpolation to 32x32. The physical voxel size based on the PSF was estimated to be 2.7mL. VAPOR was used for water suppression, and outer volume suppression was used to help define the VOI. Scans were acquired for over 90minutes post ingestion with approximately 7minute temporal resolution. Baseline scans were acquired in a separate session without 2H-glucose ingestion. Basis spectra were simulated for the custom sequence using the FID-A toolkit5 and included 18 standard neuro metabolites and two additional deuterated glutamate spectra. It has been noted that single 2H replacement can occur on the H4 glutamate proton or on the H4’ proton, or with double replacement on both the H4 and H4’ protons, so each of these possibilities were simulated.2 Exact 2H-1H coupling constants in glutamate were not known, so simulations were done using values between 1-2 Hz based on known typical 2H-1H coupling constants. Figure 1 shows the simulated deuterium-labeled glutamate spectra. Based on similarity of the single replacement simulations, only the H4-replaced was included in the basis. Likewise, only spectra with a coupling constant of 1.5Hz were included for both single and double replacement. Prior knowledge fitting was done using LCModel v6.3.6 First attempts at fitting found that the default soft constraints imposed by LCModel were not satisfactory for this basis set and data. In particular, there was a tendency for the fit to overestimate deuterated glutamate and underestimate the macromolecule peak around 2.0-2.2ppm (‘MM20’ in the software) in baseline scans. Empirically, it was determined that adding several soft constraints on the ratio of MM20 to total creatine in the range of 0.1 to 1.0 mitigated the problem and produced more consistent macromolecule maps. Metabolite ratios were calculated with respect to NAA since it has been shown that NAA does not enrich following 2H glucose ingestion.4Results
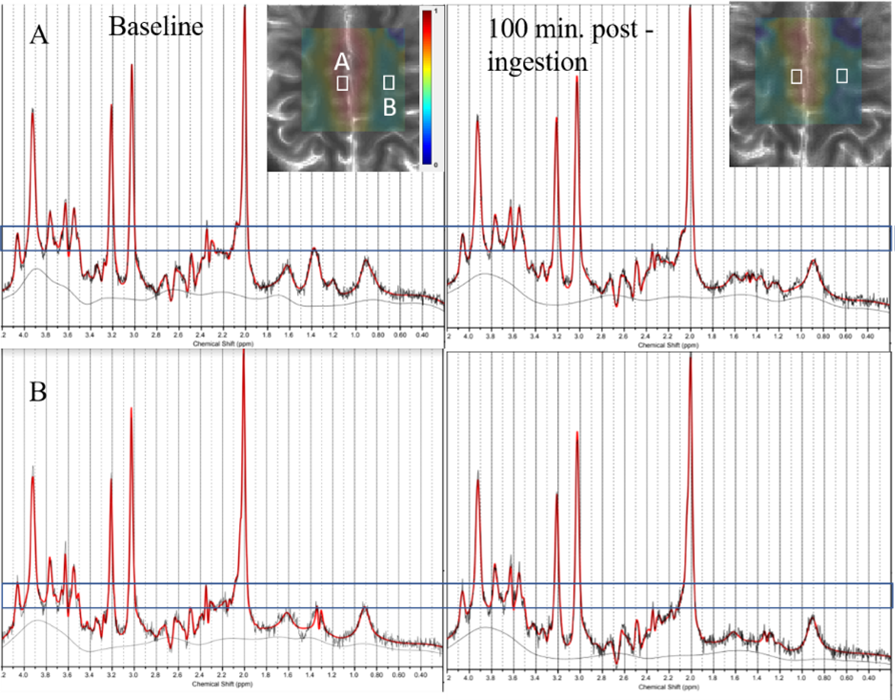
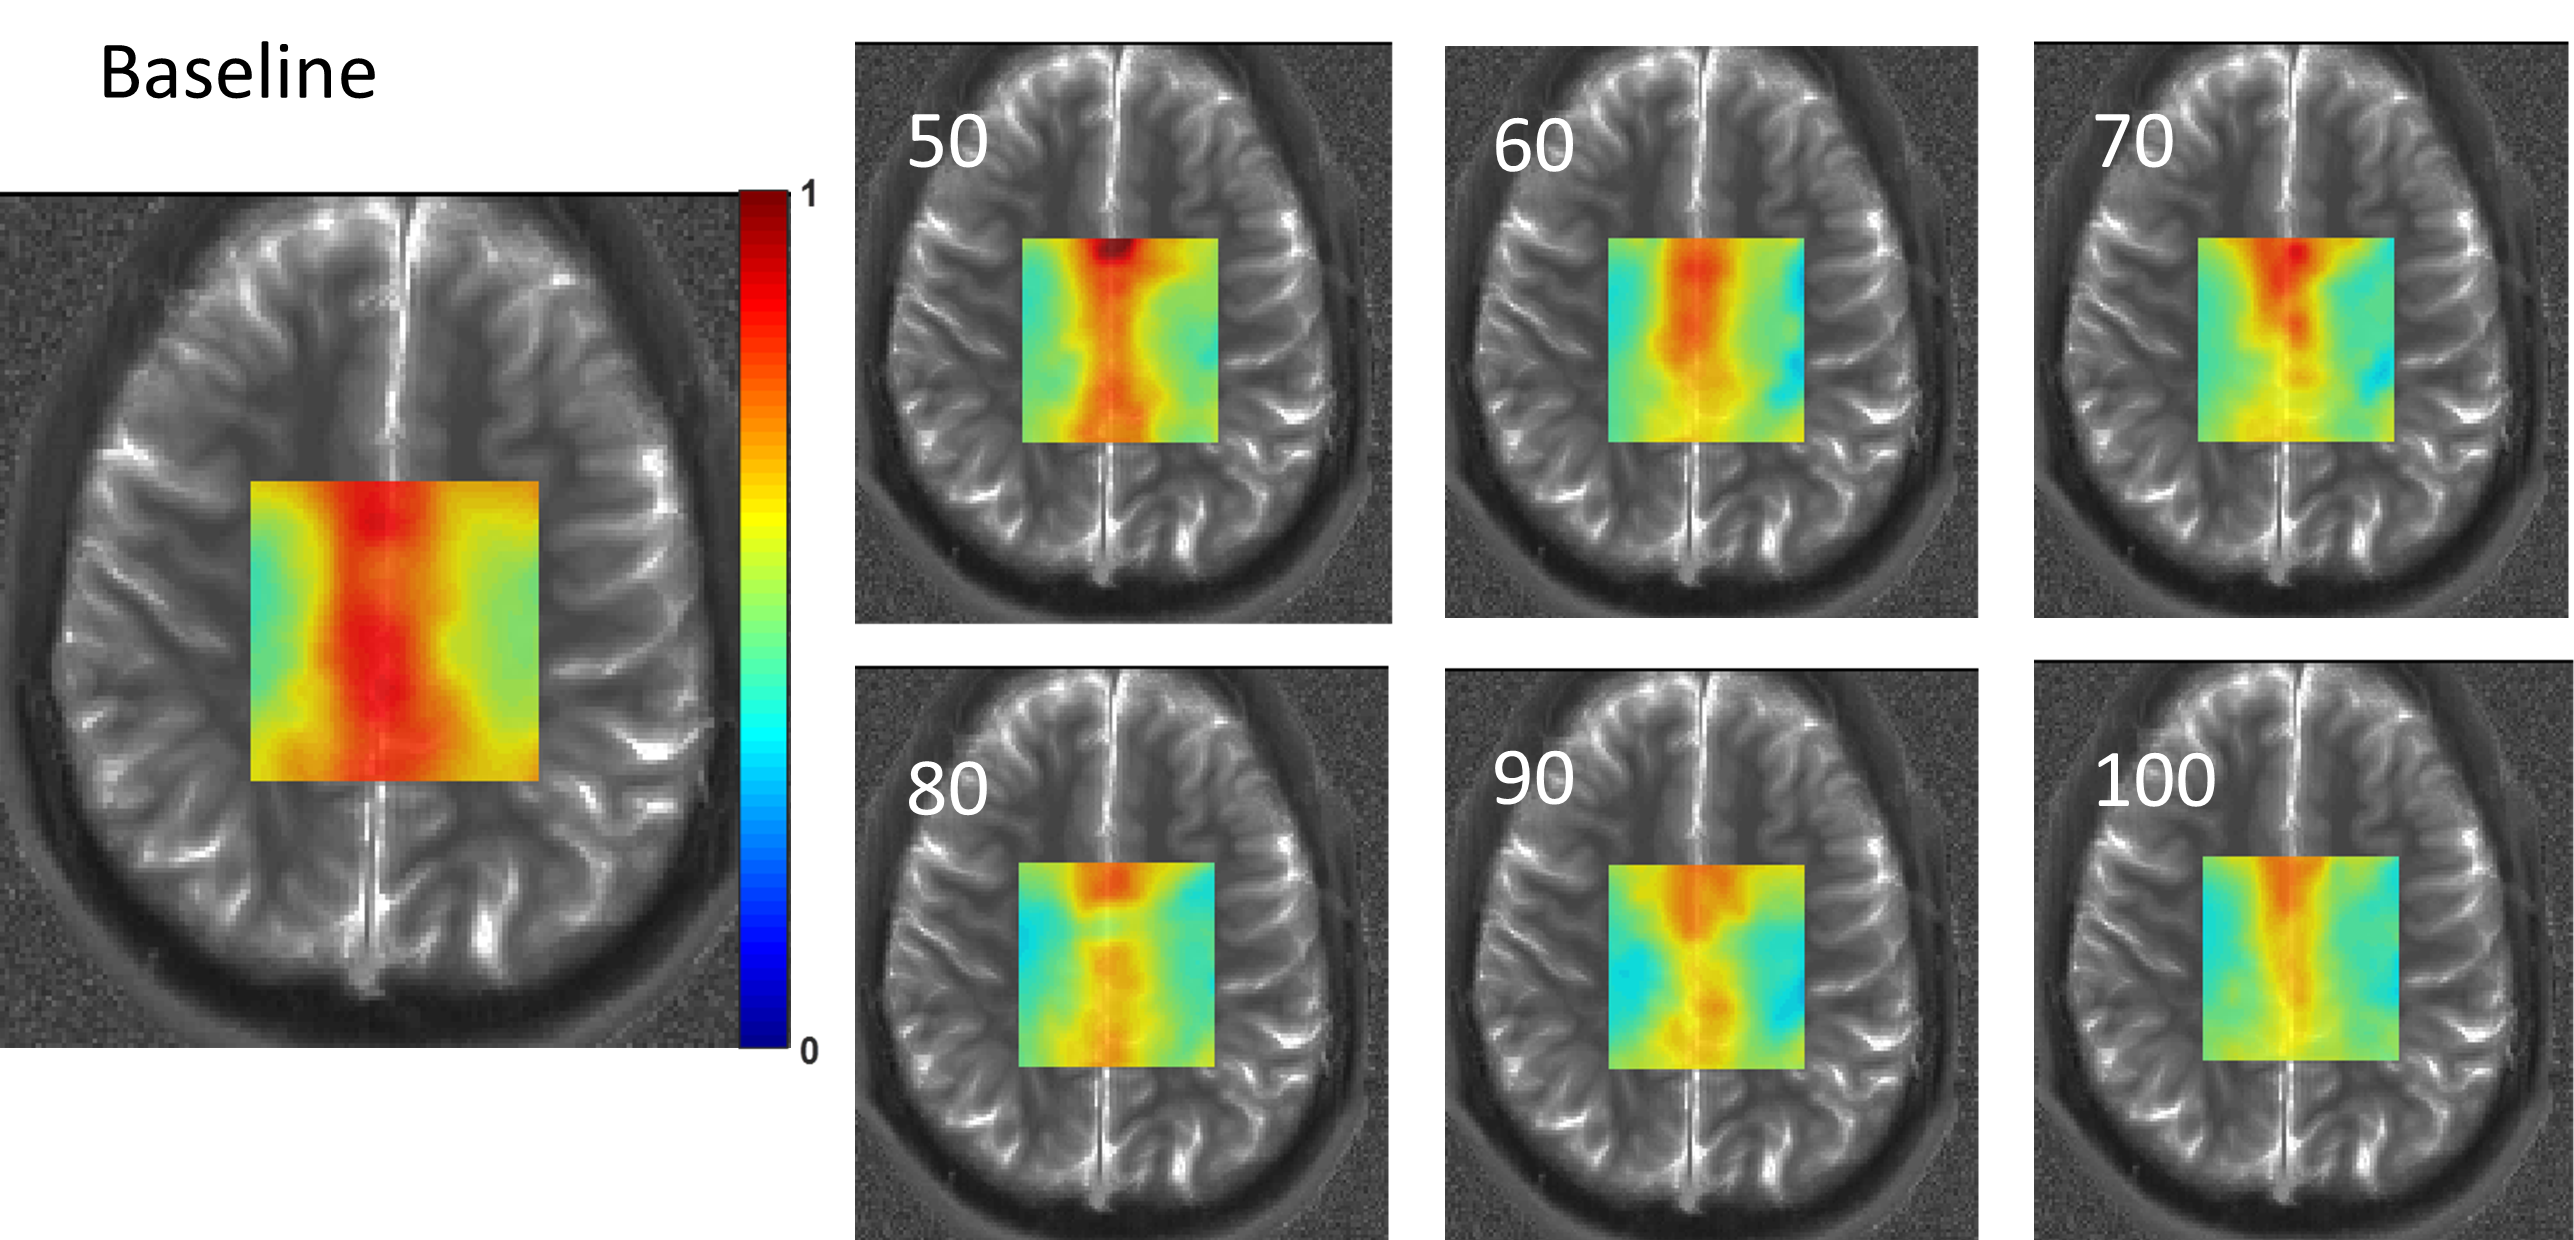
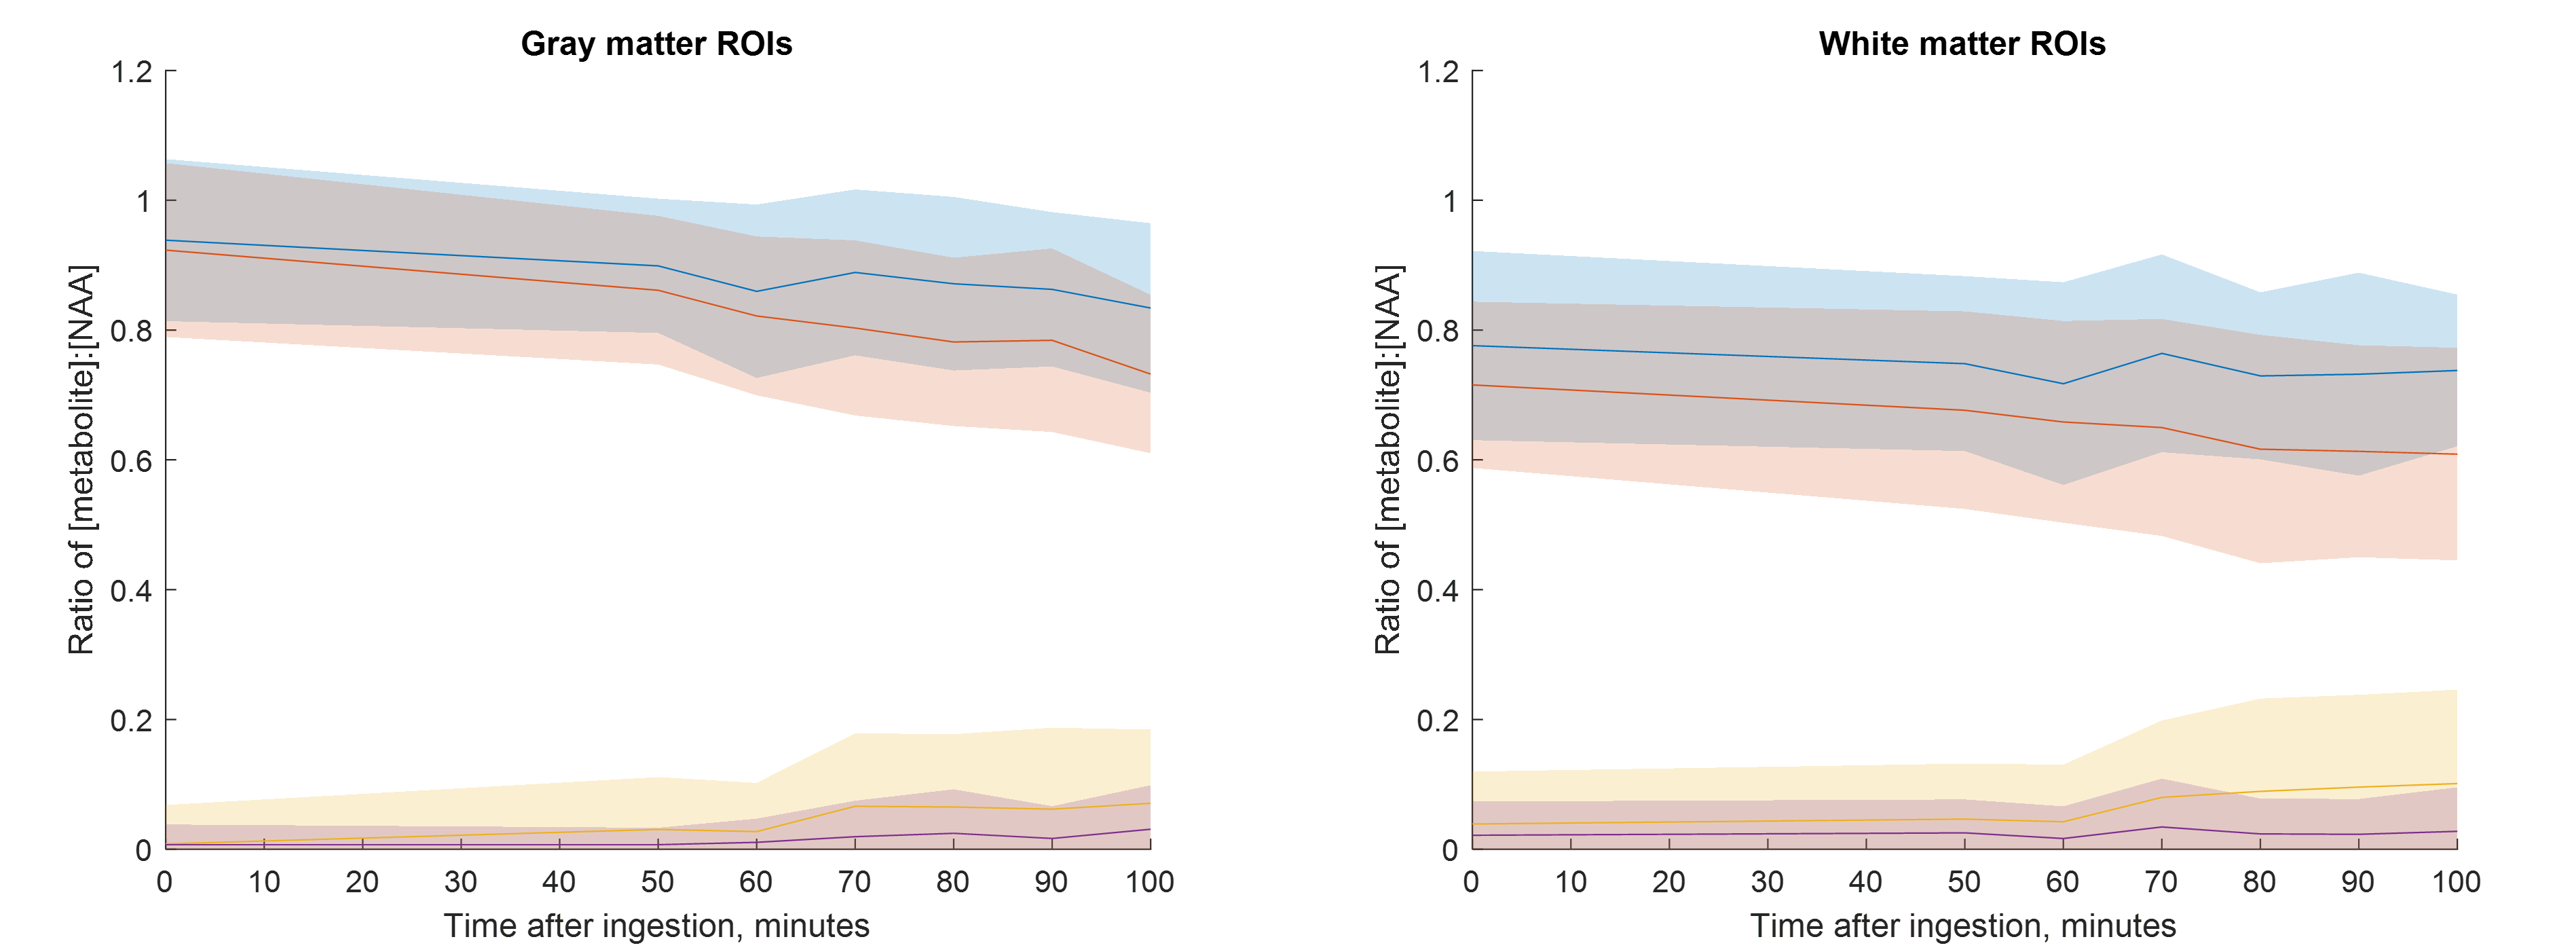
Figure 2 shows representative spectra along with LCModel fits from primarily grey and white matter voxels at baseline and 100minutes post 2H glucose ingestion. The reduction in 1H glutamate signal around 2.3ppm is qualitatively apparent in each voxel. Metabolite maps of the ratio of unlabeled glutamate to NAA are shown in Figure 3 from one subject. A decline in unlabeled glutamate from baseline is seen in all post ingestion time points, especially in the central grey matter. Figure 4 shows subject averaged ratios of unlabeled, single replacement labeled, double replacement labeled, and total glutamate for grey and white matter ROIs. The group averaged unlabeled glutamate shows a decreasing trend after ingestion, while both deuterium labeled metabolites show increases as expected.Discussion
qMRS has previously been shown to be sensitive to changes in glutamate signal around 2.3ppm as a result of 2H label turnover.7 However, in that work, only unlabeled glutamate was fit, and no attention was paid to the macromolecules. Since the basis set lacked components for deuterated glutamate, poorer fits were obtained in the spectral regions around 2.3ppm and 3.7ppm with residual signals incorrectly being ascribed to other metabolites and macromolecules. By fitting with an extended basis set and constraining certain macromolecules here, we are able to more reliably quantify both labeled glutamate and unlabeled glutamate. Further optimization of the prior knowledge fitting is a crucial step in making qMRS truly quantitative on par with techniques like DMI that look at the 2H spectrum directly. Accurate prior knowledge fitting also becomes more important at lower field strengths where the 1H spectrum becomes more crowded, and direct deuterium detection methods may be infeasible due to physical and hardware limitations.Conclusion
Prior knowledge fitting with an extended basis set that includes partially deuterated glutamate isotopomers along with updated macromolecule constraints allows for measurement of 2H-1H exchange label turnover to map neural metabolism without specialized hardware or multinuclear licenses.Acknowledgements
This project was supported by the National Institute of Biomedical Imaging and Bioengineering of the National Institute of Health under award number NIH P41EBO29460.
References
[1] Lu M, Zhu XH, Zhang Y, Mateescu G, Chen W. Quantitative assessment of brain glucose metabolic rates using in vivo deuterium magnetic resonance spectroscopy. J Cereb Blood Flow Metab. 2017;37(11):3518-3530. doi:10.1177/0271678X17706444
[2] De Feyter HM, Behar KL, Corbin ZA, et al. Deuterium metabolic imaging (DMI) for MRI-based 3D mapping of metabolism in vivo. Sci Adv. 2018;4(8):7314-7336. doi:10.1126/sciadv.aat7314
[3] Kreis F, Wright AJ, Hesse F, Fala M, Hu DE, Brindle KM. Measuring tumor glycolytic flux in vivo by using fast deuterium MRI. Radiology. 2020;294(2):289-296. doi:10.1148/radiol.2019191242
[4] Rich LJ, Bagga P, Wilson NE, et al. 1H magnetic resonance spectroscopy of 2H-to-1H exchange quantifies the dynamics of cellular metabolism in vivo. Nat Biomed Eng. 2020;4(3):335-342. doi:10.1038/s41551-019-0499-8
[5] Simpson R, Devenyi GA, Jezzard P, Hennessy TJ, Near J. Advanced processing and simulation of MRS data using the FID appliance (FID-A)—An open source, MATLAB-based toolkit. Magn Reson Med. 2017;77(1):23-33. doi:10.1002/mrm.26091
[6] Provencher SW. Estimation of metabolite concentrations from localized in vivo proton NMR spectra. Magn Reson Med. 1993;30(6):672-679. doi:10.1002/mrm.1910300604
[7] Bagga P, Rich LJ, Cember ATJ, et al. Assessing gray and white matter glutamatergic turnover in human brain non-invasively using 1H MRS and deuterated glucose. Proc Annu Meet Int Soc Magn Reson Med. Published online 2020.
Figures