1355
Deuterated α-ketoglutarate has the potential to detect the isocitrate dehydrogenase 1 mutation in low-grade gliomas.1Radiology, University of California San Francisco, San Francisco, CA, United States
Synopsis
2H-MRS is a novel method of imaging flux through metabolic pathways. Here, we show that 2H-MRS can be used to probe the isocitrate dehydrogenase 1 mutation (IDHmut), which catalyzes production of the oncometabolite 2-hydroxyglutarate (2-HG) in low-grade gliomas. Our results indicate that 2-HG production from [3,3’-2H]-α-KG can be specifically observed in IDHmut cells. Importantly, treatment with an IDHmut inhibitor, which is in clinical trials for low-grade glioma patients, results in a significant reduction in 2-HG production from [3,3’-2H]-α-KG in IDHmut cells. Our results point to the potential of [3,3’-2H]-α-KG as a probe of glioma IDHmut status and response to therapy.
Introduction
The isocitrate dehydrogenase 1 mutation (IDHmut) drives tumorigenesis in low-grade gliomas (LGGs)1,2. The wild-type isocitrate dehydrogenase (IDHwt) enzyme converts isocitrate to α-ketoglutarate (α-KG) while IDHmut catalyzes the conversion of a-KG to 2-hydroxyglutarate (2-HG)3. 2-HG is an oncometabolite that competitively inhibits the function of α-KG-dependent enzymes involved in the epigenetic control of gene expression, thereby initiating tumorigenesis (see schematic in Fig. 1)1-3. IDHmut is an attractive therapeutic target and several IDHmut inhibitors are in clinical trials for LGG patients3.Since 2-HG accumulates to concentrations of 5-35 mM in tumor tissues and is virtually undetectable in normal brain and in IDHwt gliomas, 2-HG is an ideal LGG biomarker1-3. 1H-MRS-based detection of 2-HG has been used to determine IDHmut status and assess response to IDHmut inhibitors4. However, 1H-MRS detects steady-state metabolism and does not reflect metabolic pathway activity. 2H-MRS following administration of 2H-labeled substrates recently emerged as a novel, clinically translatable method of assessing flux via metabolic pathways5,6. The goal of this study was to determine whether 2H-MRS-based assessment of [3,3’-2H]-α-KG metabolism has the potential to detect IDHmut status and response to IDHmut inhibitors in LGG models.
Methods
Synthesis of [3,3’-2H]-α-KG: To reduce the complexity of 2H-MR spectra, we examined the utility of [3,3’-2H]-α-KG (see schematic in Fig. 1). Specifically, metabolism of [3,3’-2H]-α-KG (2.9 ppm) is expected to produce [3,3’-2H]-2-HG or [3-2H]-2-HG (1.9 ppm; hereafter referred to as 2H-2-HG for clarity) through the action of the IDHmut enzyme. Alternatively, [3,3’-2H]-α-KG can be transaminated to [3,3’-2H]-glx or [3-2H]-glx (sum of glutamine and glutamate since these cannot be adequately resolved in vivo) which would produce a peak at 2.1 ppm; hereafter referred to as 2H-glx). [3,3’-2H]- -KG was synthesized as previously described using D2O at basic pH7.Cell culture: Immortalized normal human astrocytes expressing IDHwt (NHAIDHwt) or IDHmut (NHAIDHmut) were maintained in Dulbecco’s modified Eagles Medium supplemented with 10% fetal calf serum and 2 mM glutamine as described previously8-10. IDHwt and IDHmut expression has been confirmed previously8-10. For assessment of response to IDHmut inhibition, NHAIDHmut cells were treated with 1 mM BAY1436032 or vehicle-control (DMSO) every 24h for 72h11.
1H-MRS: Metabolites were extracted by methanol-chloroform extraction and 1H-MR spectra acquired on a Bruker 500 MHz spectrometer equipped with a Triple Resonance CryoProbe (1D ZGPR sequence, 90° flip angle, 3s relaxation delay, 256 acquisitions)8-10. Data was analyzed using Mnova. Peak integrals were calculated, corrected for saturation, and normalized to cell number and to an external reference (trimethylsilyl propionate).
2H-MRS: Cells were incubated in media containing 10 mM [3,3’-2H]-α-KG for 72h. 2H-MR spectra were acquired from live cell suspensions on a Varian 14.1T scanner using a 16mm 2H surface coil and a pulse-acquire sequence (TR=260ms, NA=7500, complex points=512, flip angle=64o, spectral width=2kHz). Data was analyzed in Mnova. Peak integrals were normalized to α-KG, the natural abundance of semi-heavy water (HDO, 4.75 ppm; estimated to be 12.8 mM and quantified from the signal collected from a vial containing saline) and to cell number and expressed as normalized 2-HG per 1012 cells.
Statistical analysis: All results are expressed as mean±standard deviation. Statistical significance was assessed using an unpaired two-tailed Student’s t-test with p<0.05 considered significant.
Results
[3,3’-2H]-α-KG metabolism to 2-HG can be observed in IDHmut cells: In order to ensure that our results are specific to IDHmut and not dependent on other genetic factors, we examined isogenic cells that differ only in their IDH status8-10. To this end, we examined immortalized normal human astrocytes that are isogenic and differ only in the expression of either IDHwt (NHAIDHwt) or IDHmut (NHAIDHmut) enzymes8-10. We confirmed the presence of 2-HG in NHAIDHmut but not NHAIDHwt cells by 1H-MRS (Fig. 2A-2B). Importantly, as shown in the representative 2H-MR spectra in Fig. 3A, NHAIDHmut cells showed a clear peak at 1.9 ppm corresponding to 2H-2-HG, which was absent in NHAIDHwt cells. Quantification of the data confirmed that NHAIDHmut cells produced significantly higher 2H-2-HG relative to NHAIDHwt cells (Fig. 3B).2-HG production from [3,3’-2H]-α-KG can be used to monitor response to IDHmut inhibitors: Next, we examined whether [3,3’-2H]-α-KG can be used to assess response to BAY1436032, an IDHmut inhibitor that reduces 2-HG production in IDHmut glioma cells11. As shown in the representative 2H-MR spectra and quantification in Fig. 4A-4B, 2H-2-HG labeling was significantly reduced by treatment with BAY1436032, confirming that the peak at 1.9 ppm is 2-HG and pointing to the potential ability of [3,3’-2H]-α-KG to assess response to IDHmut inhibitors.
Conclusions
IDHmut, which catalyzes 2-HG production, drives tumorigenesis in LGGs and IDHmut inhibitors have shown promise in clinical trials for LGG patients1-3. Non-invasive imaging of 2-HG production has the potential to report on IDH status and response to IDHmut inhibition. Our study shows that [3,3’-2H]-α-KG metabolism to 2-HG can be specifically observed in NHAIDHmut, but not NHAIDHwt, cells. Importantly, 2-HG production from [3,3’-2H]-α-KG is reduced in NHAIDHmut cells following treatment with the IDHmut inhibitor BAY1436032. Further studies in patient-derived IDHmut cells and tumor xenografts are ongoing to determine the utility of [3,3’-2H]-α-KG for in vivo imaging of tumor burden and treatment response in LGGs.Acknowledgements
This study was supported by NIH R01CA239288, Department of Defense W81XWH201055315 and UCSF Brain Tumor Center Loglio and NICO initiatives.
References
1 Waitkus, M. S., Diplas, B. H. & Yan, H. Isocitrate dehydrogenase mutations in gliomas. Neuro-oncology, doi:10.1093/neuonc/nov136 (2015).
2 Viswanath, P., Chaumeil, M. M. & Ronen, S. M. Molecular Imaging of Metabolic Reprograming in Mutant IDH Cells. Frontiers in oncology 6, 60, doi:10.3389/fonc.2016.00060 (2016).
3 Dang, L., Yen, K. & Attar, E. C. IDH mutations in cancer and progress toward development of targeted therapeutics. Annals of oncology : official journal of the European Society for Medical Oncology 27, 599-608, doi:10.1093/annonc/mdw013 (2016).
4 Leather, T., Jenkinson, M. D., Das, K. & Poptani, H. Magnetic Resonance Spectroscopy for Detection of 2-Hydroxyglutarate as a Biomarker for IDH Mutation in Gliomas. Metabolites 7 (2017).
5 De Feyter, H. M. & de Graaf, R. A. Deuterium metabolic imaging - Back to the future. Journal of magnetic resonance (San Diego, Calif. : 1997) 326, 106932, doi:10.1016/j.jmr.2021.106932 (2021).
6 Lu, M., Zhu, X. H., Zhang, Y., Mateescu, G. & Chen, W. Quantitative assessment of brain glucose metabolic rates using in vivo deuterium magnetic resonance spectroscopy. Journal of cerebral blood flow and metabolism : official journal of the International Society of Cerebral Blood Flow and Metabolism 37, 3518-3530 (2017).
7 Patteson, J. B., Dunn, Z. D. & Li, B. In Vitro Biosynthesis of the Nonproteinogenic Amino Acid Methoxyvinylglycine. Angew Chem Int Ed Engl 57, 6780-6785, doi:10.1002/anie.201713419 (2018).
8 Izquierdo-Garcia, J. L. et al. Metabolic Reprogramming in Mutant IDH1 Glioma Cells. PLoS One 10, e0118781, doi:10.1371/journal.pone.0118781 (2015).
9 Viswanath, P. et al. Mutant IDH1 gliomas downregulate phosphocholine and phosphoethanolamine synthesis in a 2-hydroxyglutarate-dependent manner. Cancer & metabolism 6, 3, doi:10.1186/s40170-018-0178-3 (2018).
10 Viswanath, P. et al. 2-hydroxyglutarate-mediated autophagy of the endoplasmic reticulum leads to an unusual downregulation of phospholipid biosynthesis in mutant IDH1 gliomas. Cancer research, doi:10.1158/0008-5472.can-17-2926 (2018).
11 Pusch, S. et al. Pan-mutant IDH1 inhibitor BAY 1436032 for effective treatment of IDH1 mutant astrocytoma in vivo. Acta Neuropathol 133, 629-644, doi:10.1007/s00401-017-1677-y (2017).
Figures
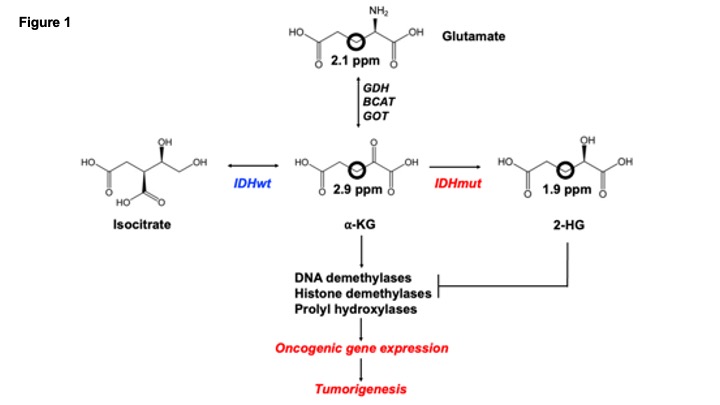
Illustration of the role of IDHmut in LGGs. IDHwt converts isocitrate to α-KG while IDHmut converts α-KG to 2-HG, which drives tumorigenesis. We examined the utility of [3,3’-2H]-α-KG (2.9ppm) which is converted to 2-HG labeled at the 3,3’ or 3 positions (1.9ppm) by IDHmut. [3,3’-2H]-α-KG can also be transaminated by glutamate dehydrogenase (GDH), glutamate-pyruvate transaminase (GOT) or branched chain aminotransferase (BCAT) to glx labeled at the 3,3’ or 3 positions (2.1ppm).
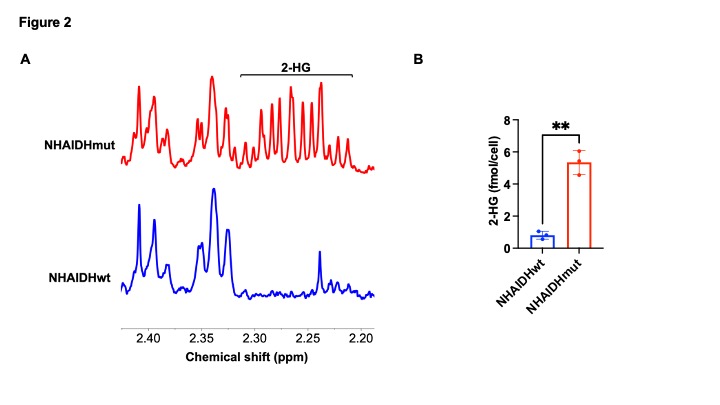
Verification of 2-HG production in IDHmut cells by 1H-MRS. (A) Representative 1H-MR spectra from NHAIDHwt and NHAIDHmut cells showing the resonance for 2-HG at 2.25 ppm in NHAIDHmut cells. (B) Quantification of 2-HG by 1H-MRS in cell extracts from NHAIDHwt and NHAIDHmut cells.
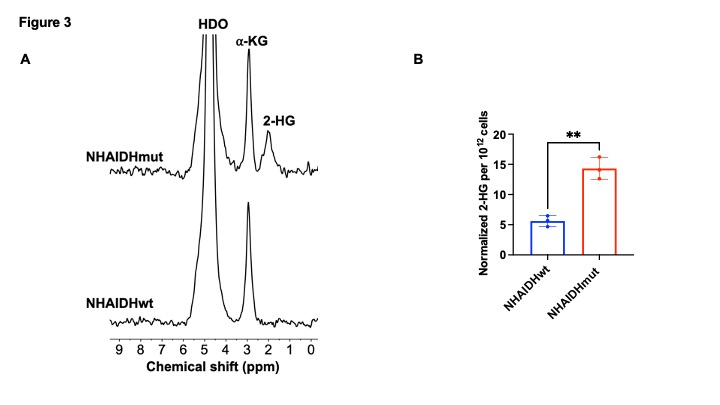
[3,3’-2H]-α-KG has the potential to report on IDHmut status. (A) Representative 2H spectra from live NHAIDHwt and NHAIDHmut cells cultured in medium containing 10 mM [3,3’-2H]-α-KG for 72h. Peaks for semi-heavy water (HDO; 4.75 ppm), α-KG (2.9 ppm) and 2-HG (1.9 ppm) are labeled. (B) Quantification of normalized 2-HG labeling in NHAIDHwt and NHAIDHmut cells (n = 3 each).
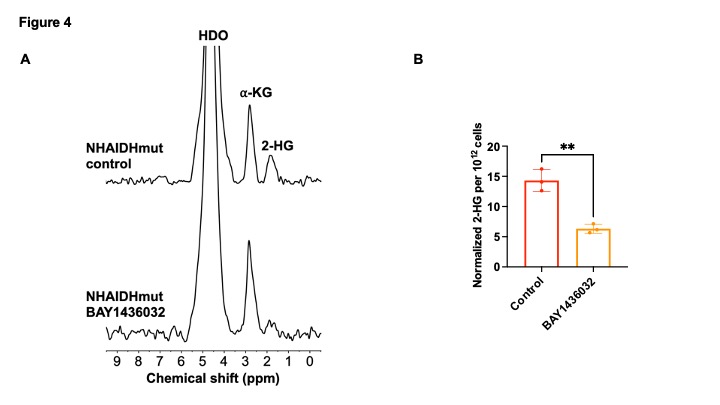
[3,3’-2H]-α-KG has the potential to monitor response to IDHmut inhibition. (A) Representative 2H spectra from live NHAIDHmut cells treated with BAY1436032 or vehicle-control and cultured in medium containing 10 mM [3,3’-2H]-α-KG for 72h. Peaks for semi-heavy water (HDO; 4.75 ppm), -KG (2.9 ppm) and 2-HG (1.9 ppm) are labeled. (B) Quantification of normalized 2-HG levels in vehicle-control and BAY1436032-treated NHAIDHmut cells (n = 3 cells).