1354
2H multi-echo bSSFP highlights pancreatic ductal adenocarcinomas and distinguishes them from pancreatitis in murine models1Weizmann Institute of Science, Rehovot, Israel, 2Chinese Academy of Sciences, Wuhan, China, 3Yale School of Medicine, New Haven, CT, United States
Synopsis
Pancreatic ductal adenocarcinoma (PDAC) is among the deadliest of cancers. We recently showed that deuterium metabolic imaging (DMI) can serve as a potential method for PDAC’s detection; we also demonstrated that multi-echo balanced steady-state free precession (ME-bSSFP) can greatly increase DMI’s SNR per unit time compared to CSI acquisitions. This study synergizes these aspects, to provide high resolution maps on the metabolic kinetic of PDAC and pancreatitis mouse models. ME-bSSFP at 15.2T showed that lactate accumulated in different kinds of tumors. In general, glucose was also uptaken by the tumors, and HDO concentrated in them.
Introduction
Although not among the 10 most widespread cancers, pancreatic ductal adenocarcinoma (PDAC) is among those with worst prognoses: in 2020 PDAC was the 3rd deadliest cancer in both the US and Israel.1,2 This reflects in part PDAC’s early diagnosis challenges: patients exhibit few early symptoms, and these are often hard to distinguish from non-malignant inflammations. Deuterium metabolic imaging (DMI) has been demonstrated as a potential method for screening cancer, when following the fate of 2H6,6’-glucose injections.3,4 The glucose is taken up by multiple organs (e.g., kidney) and, in regions with abnormal metabolism like tumors, it originates unusually high levels of 2H3,3’-lactate.5 Chemical shift imaging (CSI) can be used to generate spectrally-resolved spatial maps of these metabolites, as well as of the [2H]-water (HDO) generated via the TCA cycle. We have recently shown the usefulness of 2H CSI for highlighting PDAC in mice models,6 based on of 2H6,6’-glucose injections at 15.2T. We have also recently shown that multi-echo balanced steady-state free precession (ME-bSSFP7) can improve the SNR per unit time of these spectroscopic imaging experiments, providing a superior spatial resolution mapping.8 This work presents kinetic DMI studies of PDAC and pancreatitis mouse models carried out using this new tool.Methods
Animal experiments were approved by the Weizmann Institute IACUC. Nine C57 black mice were used in this study: seven were implanted with fluorescent and non-labeled KPC models of rodent PDAC,9 and two were used in Caerulein-induced pancreatitis studies.10 For DMI, ~4 g/kg body weight of 2H6,6’-glucose (dissolved in PBS) was injected via an intravenous tail-vein line. All measurements were performed on a 15.2T Bruker scanner, using Paravision 6.0 and surface coils tuned to 650 MHz (1H) and 100 MHz (2H). A 2D ME-bSSFP sequence was written and optimized for the targeted analytes: TR =11.48 ms, five TEs with 2.1 ms echo spacings, 60° flip angle excitations, ~6 min signal averaging per image, 32x32 matrix sizes, field-of-view FOV = 40x40mm, ≈10 mm slices accommodating the full tumors’ thicknesses. DMI images were overlaid on anatomical 1H coronal images collected using multi-slice TurboRARE: 10 slices, 0.8 mm slice thickness, 0.2 mm slice gaps, and the same FOVs of ME-bSSFP and 512x512 encoding matrix. 1H B0 maps were obtained by 3D double gradient echo, with same FOVs as for ME-bSSFP and 64x64x8 encoding matrices.The ME-bSSFP data were reconstructed using 2D FT, after zero-filling each echo along both dimensions to a 64x64 matrix and Gaussian apodization. The images arising from these separated echoes were processed using IDEAL,7,8 which has the capability of isolating the chemical shifts. 1H-based magnetic field maps were used as initial guesses for IDEAL’s magnetic field, in order to avoid “swaps” otherwise observed upon processing.11 Peak intensities were translated into metabolic concentrations using 2H’s natural abundance (~10 mM concentration prior to injection in liquid-containing spaces), and the ME-bSSFP theoretical signal expected from the T1, T2 and scan parameters for each species.8
Results & Discussion
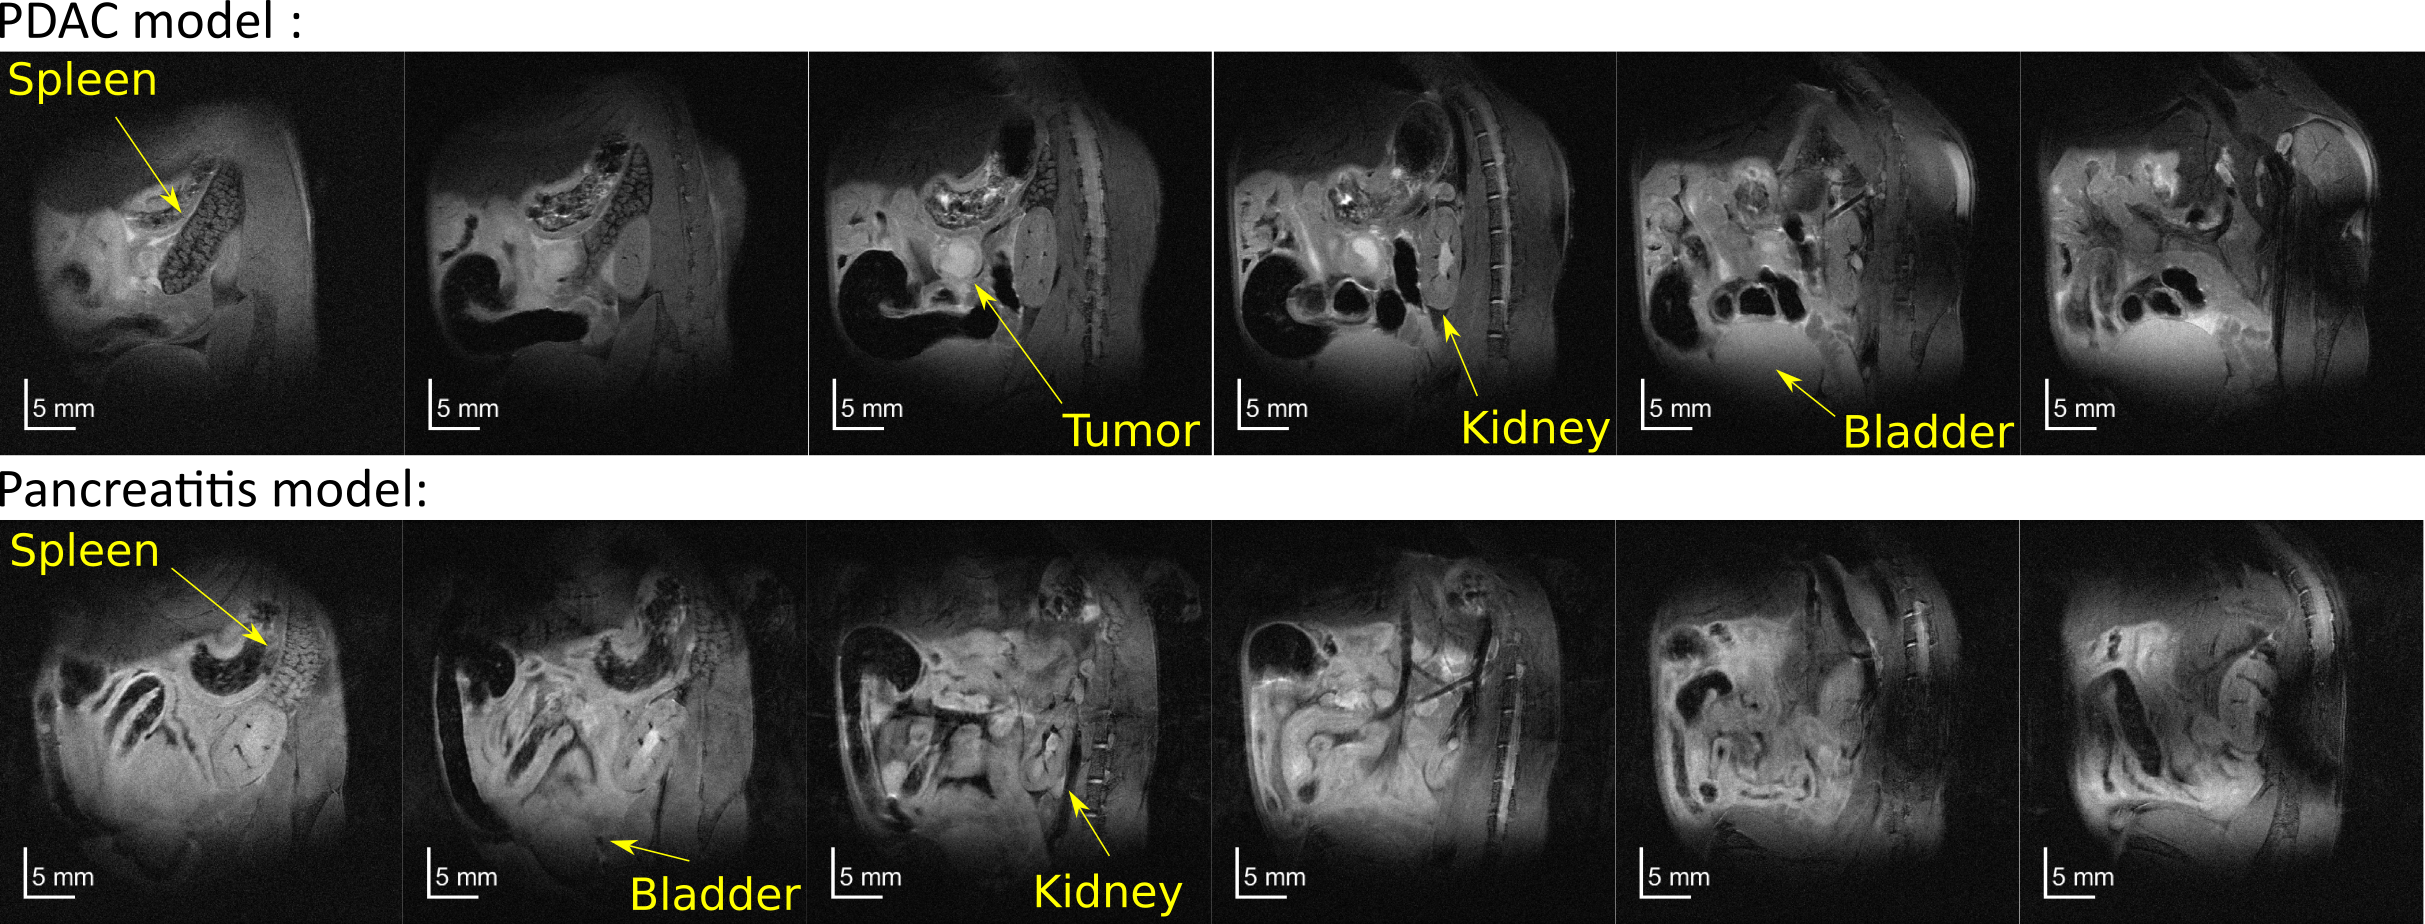
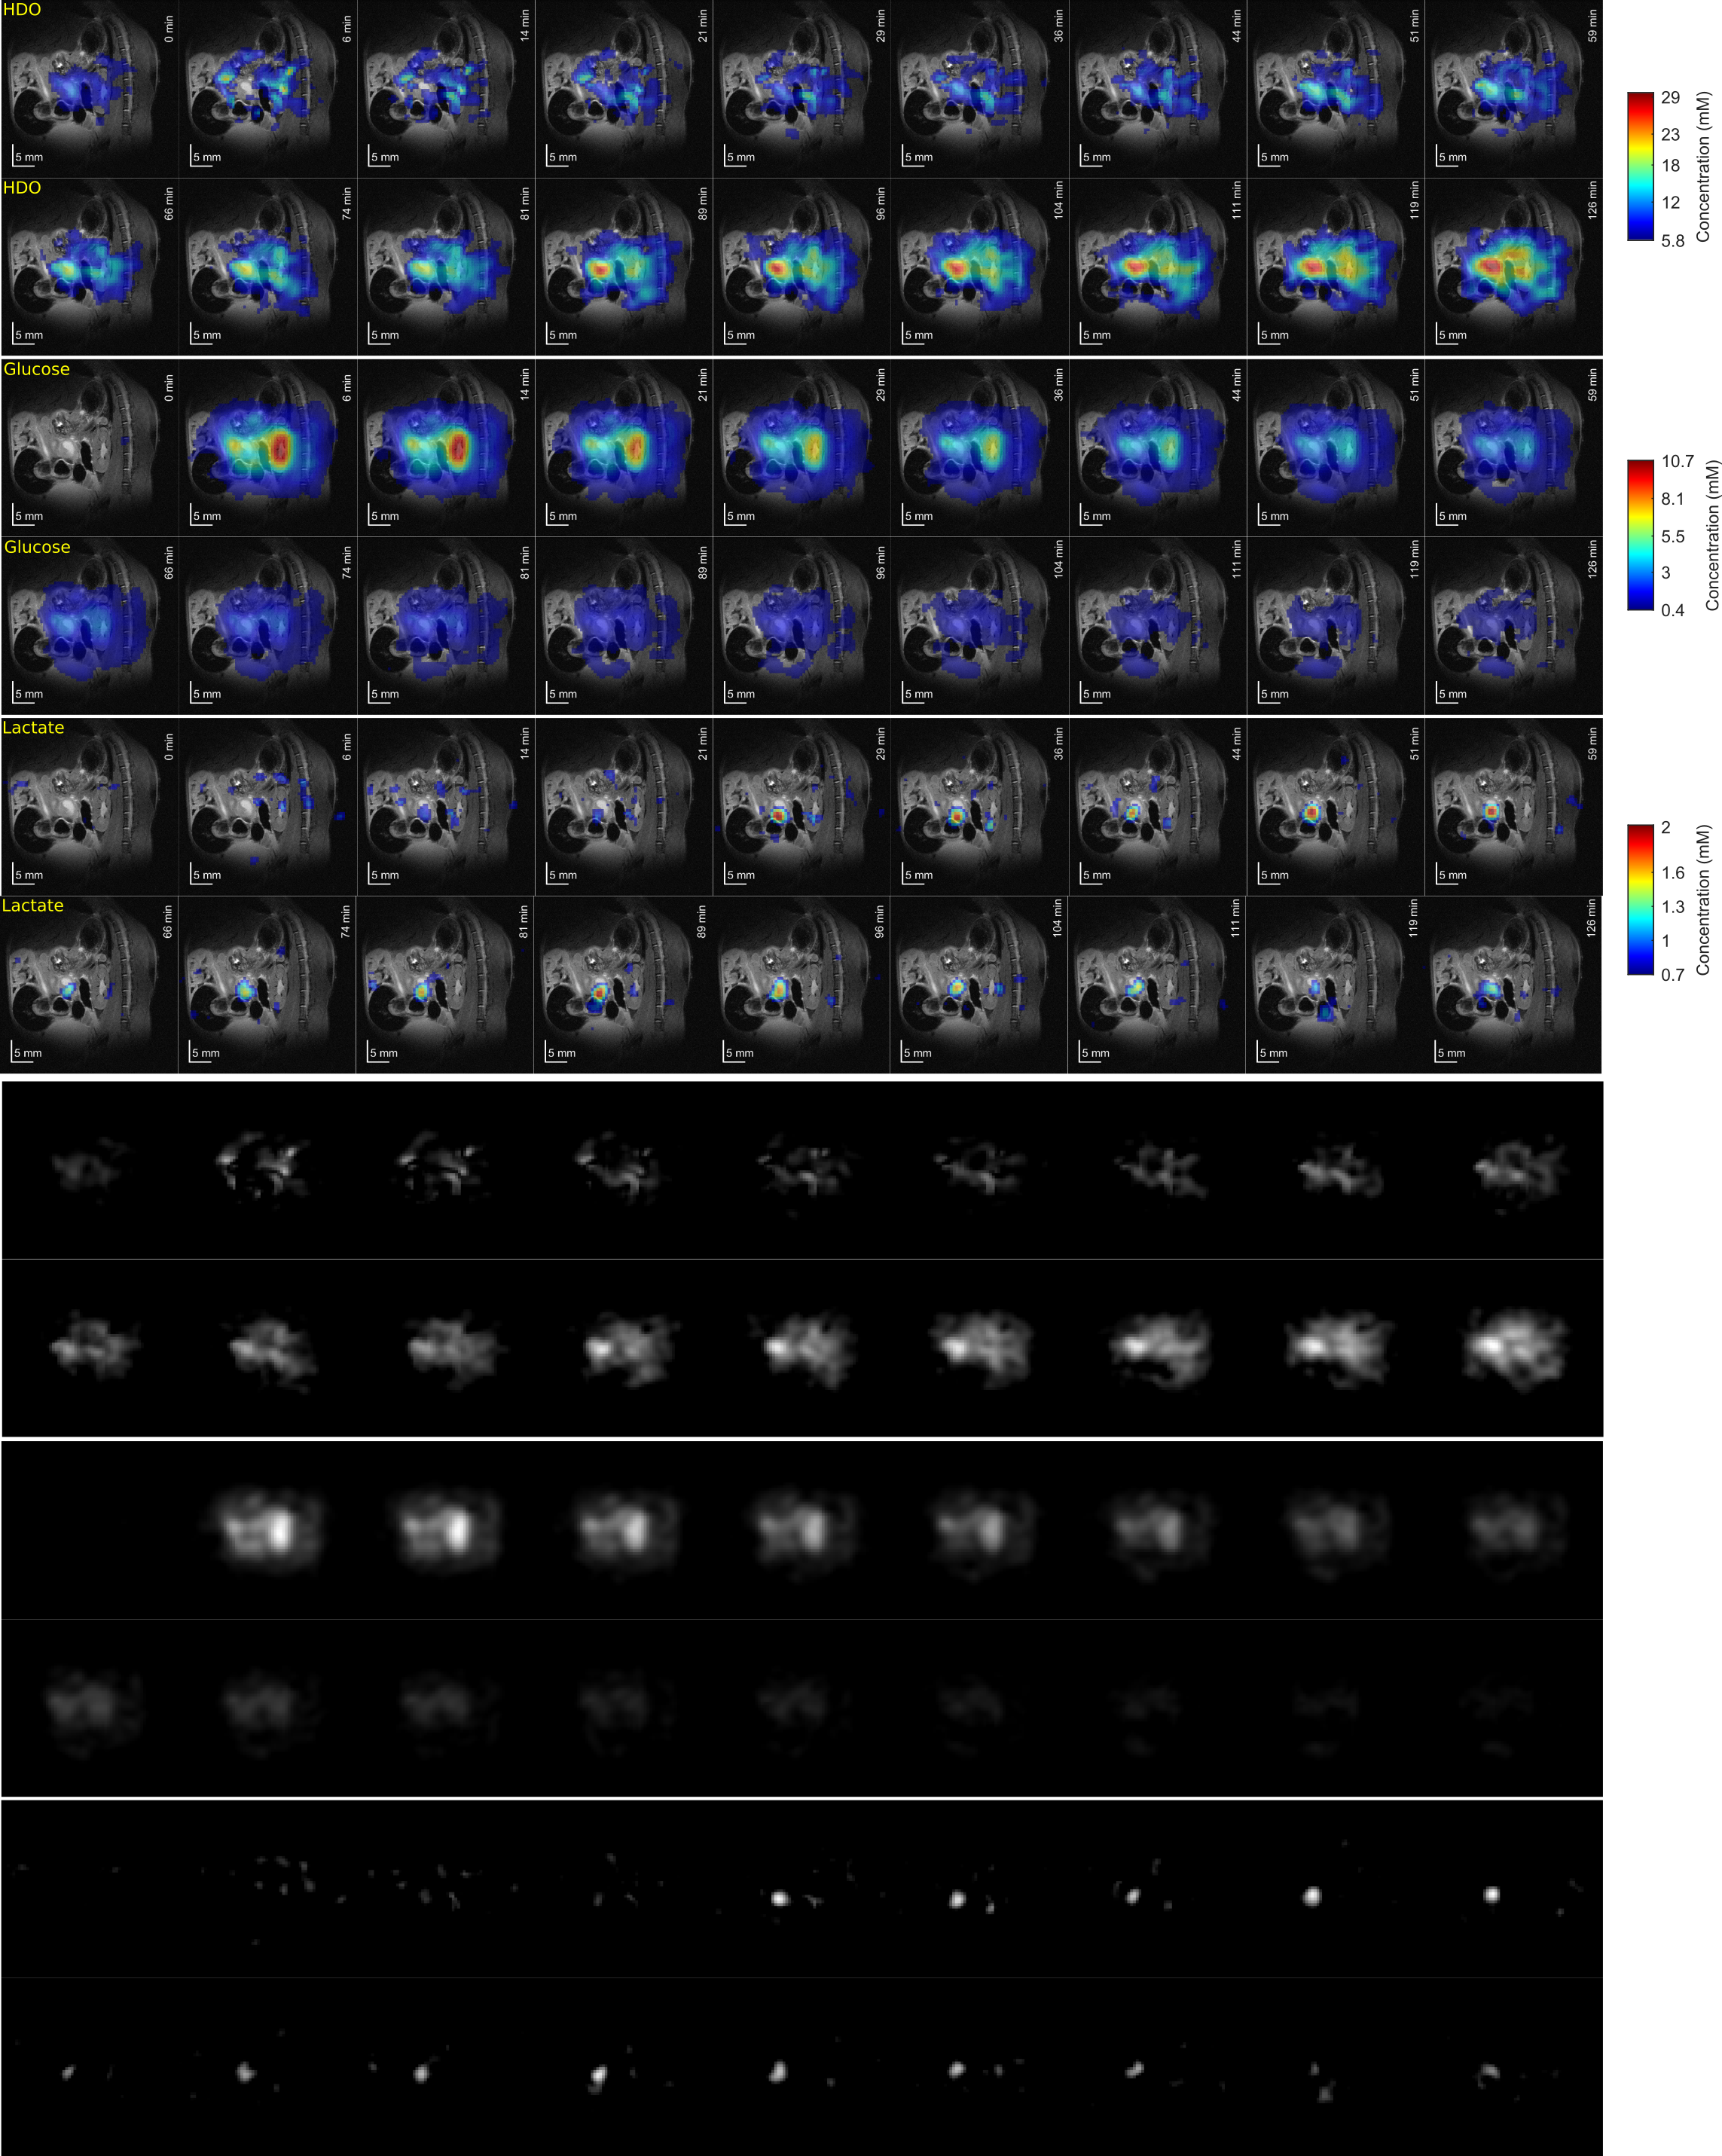
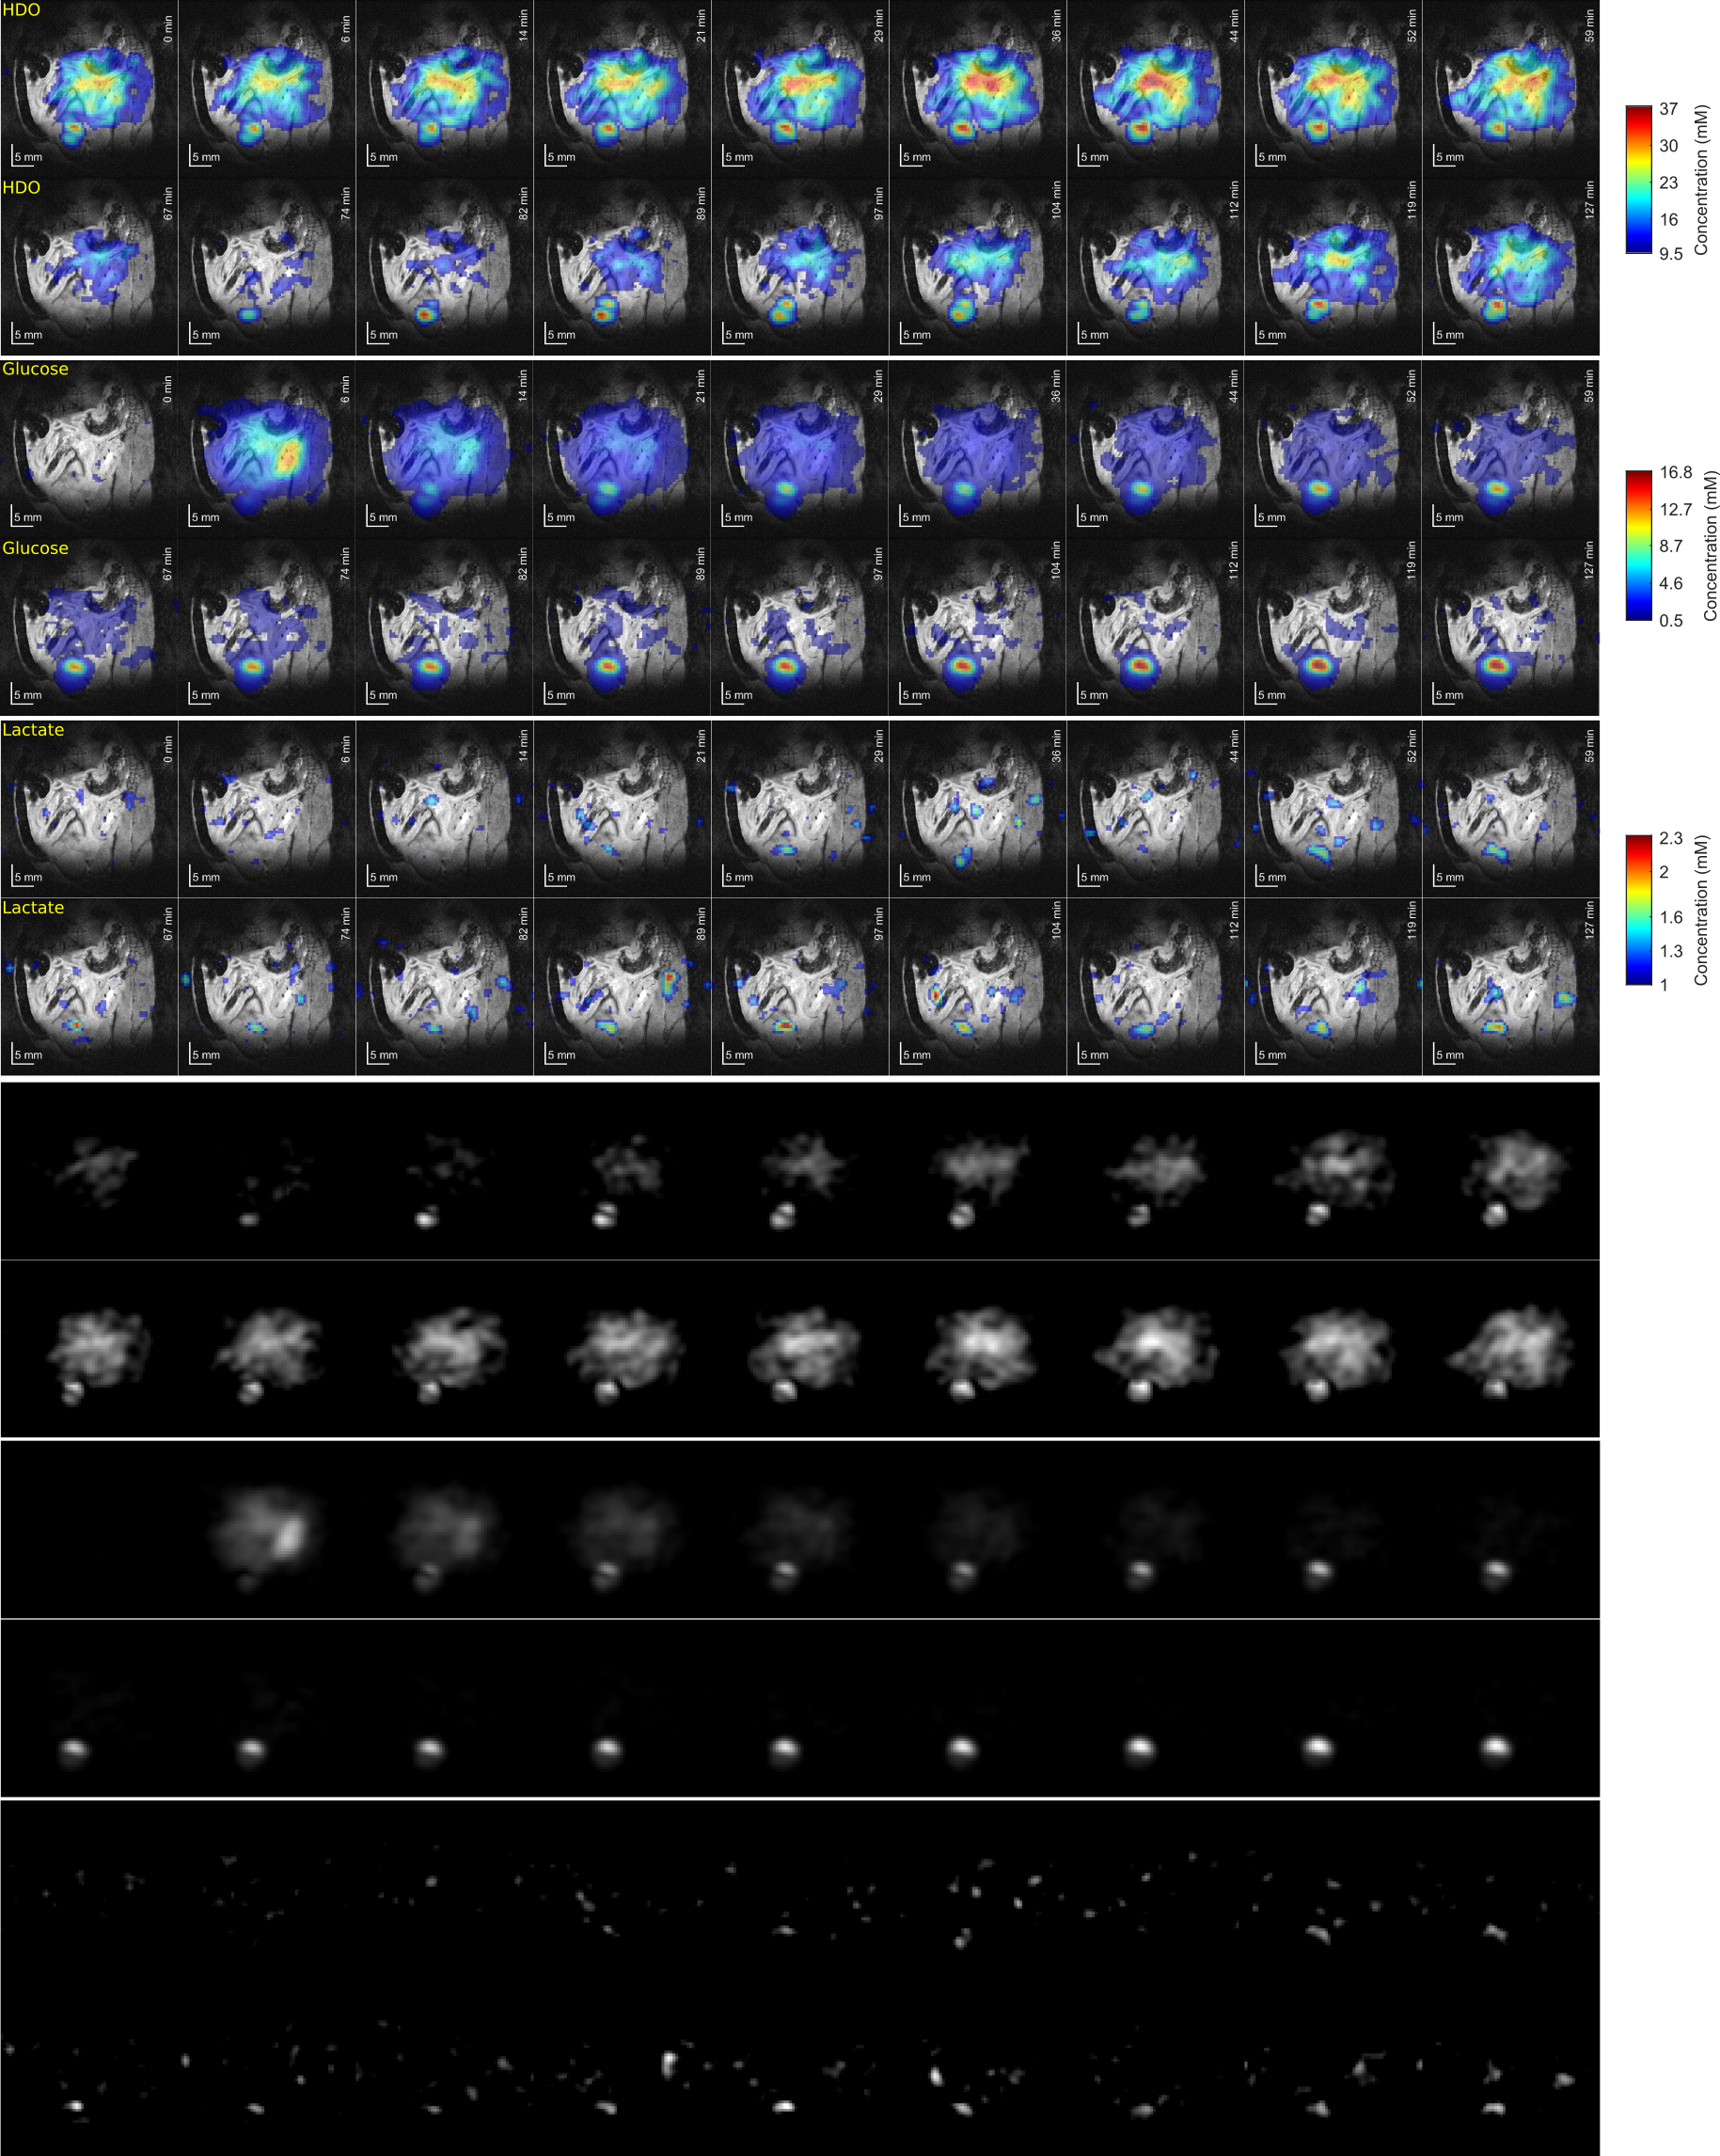
Figure 1 shows anatomic 1H images acquired for pancreatitis- and KPC-implanted animals. It is possible to observe in the latter the tumor, the kidney, and the bladder – which increases in volume over the course of the DMI acquisitions. Because of bladder enlargement ROIs were slightly adjusted as a function of the DMI kinetics. Note the cyst is visible in the middle of the tumor; this was a common feature in the non-labeled KPC model.Figures 2 and 3 show DMI images for the deuterated water, glucose and lactate, arising for the two mice models introduced in Figure 1. Note how immediately after injection the glucose accumulates in the kidneys; then it disappears as a combined result of metabolism and of elimination into the bladder. Glucose also accumulates in the tumor; while with a concentration that is smaller than glucose’s, lactate is also clearly visible in the tumor region. Lactate reaches a maximum ca. 1 hour after injection for all KPC mice, and thereafter disappear; there also seemed to be a correlation between the amount of lactate signal generated, and tumor size. HDO is also generated by the 2H6,6’-glucose; although more delocalized than either glucose or lactate, an HDO concentration in the tumor region is evidenced by the majority of KPC-implanted mice. For the pancreatitis models we could not observe the generation of 2H3,3’-lactate –not even from non-localized observations.
Conclusion
DMI by ME-bSSFP was used to study KPC models of PDAC and models of acute pancreatitis. The generation of 2H3,3’-lactate was common for all KPC-implanted mice, while no lactate signal was observed for the pancreatitis cases. DMI by ME-bSSFP thus has ample potential to become a useful method for metabolic imaging of this deadliest of cancers.Acknowledgements
This work was supported by the Thompson Family and the Israel Cancer Research Foundation. DP acknowledges the Benoziyo Endowment Fund for the Advancement of Science for a Visiting Faculty Fellowship to the Weizmann Institute. LF heads the Clore Institute for High-Field Magnetic Resonance Imaging and Spectroscopy, whose support is also acknowledged.References
1. Wallis C. https://www.scientificamerican.com/article/why-pancreatic-cancer-is-on-the-rise/.
2. https://gco.iarc.fr/today/home.
3. Lu M, Zhu XH, Zhang Y, Mateescu G, Chen W. Quantitative assessment of brain glucose metabolic rates using in vivo deuterium magnetic resonance spectroscopy. J Cereb Blood Flow Metab. 2017 Nov;37(11):3518-3530. doi: 10.1177/0271678X17706444. Epub 2017 May 15. PMID: 28503999; PMCID: PMC5669347.
4. De Feyter HM, Behar KL, Corbin ZA, Fulbright RK, Brown PB, McIntyre S, Nixon TW, Rothman DL, de Graaf RA. Deuterium metabolic imaging (DMI) for MRI-based 3D mapping of metabolism in vivo. Sci Adv. 2018 Aug 22;4(8):eaat7314. doi: 10.1126/sciadv.aat7314. PMID: 30140744; PMCID: PMC6105304.
5. Warburg O, Wind F, Negelein E. The metabolism of tumors in the body. J Gen Physiol. 1927;8:519-530.
6. Markovic S, Roussel T, Agemy L, Sasson K, Preise D, Scherz A, Frydman L. Deuterium MRSI characterizations of glucose metabolism in orthotopic pancreatic cancer mouse models. NMR Biomed. 2021 Sep;34(9):e4569. doi: 10.1002/nbm.4569. Epub 2021 Jun 16. PMID: 34137085.
7. Reeder SB, Pineda AR, Wen Z, Shimakawa A, Yu H, Brittain JH, Gold GE, Beaulieu CH, Pelc NJ. Iterative decomposition of water and fat with echo asymmetry and least-squares estimation (IDEAL): application with fast spin-echo imaging. Magn Reson Med. 2005 Sep;54(3):636-44. doi: 10.1002/mrm.20624. PMID: 16092103.
8. Peters, DC, Markovic, S, Bao, Q, et al. Improving deuterium metabolic imaging (DMI) signal-to-noise ratio by spectroscopic multi-echo bSSFP: A pancreatic cancer investigation. Magn Reson Med. 2021; 86: 2604– 2617. https://doi.org/10.1002/mrm.28906
9. Martinho RP, Bao Q, Markovic S, Preise D, Sasson K, Agemy L, Scherz A, Frydman L. Identification of variable stages in murine pancreatic tumors by a multiparametric approach employing hyperpolarized 13 C MRSI, 1 H diffusivity and 1 H T1 MRI. NMR Biomed. 2021 Feb;34(2):e4446. doi: 10.1002/nbm.4446. Epub 2020 Nov 21. PMID: 33219722.
10. Carrière C, Young AL, Gunn JR, Longnecker DS, Korc M (2011) Acute Pancreatitis Accelerates Initiation and Progression to Pancreatic Cancer in Mice Expressing Oncogenic Kras in the Nestin Cell Lineage. PLOS ONE 6(11): e27725. https://doi.org/10.1371/journal.pone.0027725
11. Yu H, Reeder SB, Shimakawa A, Brittain JH, Pelc NJ. Field map estimation with a region growing scheme for iterative 3-point water-fat decomposition. Magn Reson Med. 2005 Oct;54(4):1032-9. doi: 10.1002/mrm.20654. PMID: 16142718.
Figures