1353
Measuring Deuterium Relaxation Times in Human Brain at 7T following D2O Loading1School of Physics and Astronomy, University of Nottingham, Nottingham, United Kingdom, 2Sir Peter Mansfield Imaging Centre, University of Nottingham, Nottingham, United Kingdom, 3Mental Health and Clinical Neuroscience, School of Medicine, University of Nottingham, Nottingham, United Kingdom, 4NIHR Nottingham Biomedical Research Centre/Nottingham Clinical Research Facilities, Queen's Medical Centre, Nottingham, United Kingdom, 5Division of Cancer and Stem Cells, School of Medicine, University of Nottingham, Nottingham, United Kingdom, 6MRC-Versus Arthritis Centre for Musculosketal Ageing Research, University of Nottingham, Nottingham, United Kingdom, 7Division of Medical Sciences and Graduate Entry Medicine, School of Medicine, University of Nottingham, Nottingham, United Kingdom, 8School of Life Sciences, University of Nottingham, Nottingham, United Kingdom
Synopsis
Deuterium magnetic resonance measurements are of growing interest in the field of metabolic imaging. Four subjects were loaded with D2O to ~1.5% enrichment over a 6-week period for a parallel study of immune cell proteomics. We report T1 and T2* relaxation times of deuterium in HDO measured from cerebral spinal fluid (CSF), white matter (WM) and grey matter (GM) in vivo, using a 7T Philips Achieva scanner with a dual-tuned 2H/1H birdcage coil. 2H T1 values are significantly shorter than corresponding values for 1H in H2O, due to the quadrupolar 2H relaxation, whilst T2* values are comparable to 1H values.
Introduction
Deuterium (2H) has an integer spin of one which gives rise to a quadrupolar magnetic moment that offers sensitivity to molecular orientation1,2 and produces faster relaxation compared with 1H. The low natural abundance (~0.015%) along with the low gyromagnetic ratio (6.54 MHz/T) of 2H, when compared with 1H, reduces the available MR signal, but the reduced longitudinal relaxation time (T1) of 2H allows greater signal averaging in a given acquisition time. This has allowed 2H-labelled substrates to be used as metabolic tracers, and has led to an increased interest in deuterium magnetic resonance measurements following injection or ingestion of 2H-labelled compounds.3,4 Analysis of body fluid samples during heavy water loading is also used for studies of protein synthesis.5 Here, images and relaxation time maps are reported at 7T on healthy human subjects loaded with D2O to ~1.5% enrichment, which was maintained over a 6-week period, for a parallel study of immune cell proteomics. This allowed the characterisation of 2H relaxation times in different brain tissues in vivo for the first time.Method
Measurements were made on a 7T Philips Achieva scanner using a dual-tuned 2H/1H head birdcage coil (Rapid Biomedical). Four healthy subjects were scanned regularly during the loading period. 3D sagittal multi-echo, gradient echo (MEGE) 2H images (6 x 6 x 10 mm3 voxels) were acquired with a range of repetition times (TR) to allow calculation of T1 and T2* maps, using dual-fitting to the saturation recovery and echo-time (TE) variation of each voxel. A low resolution MEGE 1H image (3 x 3 x 5mm3) was also acquired for comparison and later co-registration. In an additional scanning session, a 32-channel receiver coil (Nova Medical) was used to acquire a high-resolution (0.7 mm isotropic) 1H MPRAGE for tissue segmentation and co-registration, along with a low resolution MEGE 1H image to allow calculation of 1H T2* maps. All images were transformed into standard MNI space for analysis. An affine matrix was obtained from a linear two-part registration with six degrees of freedom using FSL, which allowed the segmentation masks to be transformed into the low resolution 2H space. Mean relaxation times were calculated for cerebral spinal fluid (CSF), grey matter (GM) and white matter (WM) regions.Four subjects (A-D) were scanned and the 2H relaxation time measurements were repeated twice on Subjects C and D. Six sets of 2H relaxation times and four sets of 1H relaxation times are therefore reported in Table 1. Data from Subjects A and B was acquired with five echoes (TE1=4.3 ms; ΔTE=8.4 ms) and TR=68, 136, 272, 544 ms, with the number of averages adjusted so the acquisition time (TAQ) for each image was 487 s. Data from subjects C and D was acquired with six echoes (TE1=4.3 ms; ΔTE=8.4 ms) and one additional TR value (TR=816 ms; TAQ = 730 s). All 1H MEGE data was acquired with 15 TEs (TE1= 2.5 ms; ΔTE =2.34 ms), and TR = 41ms.
Results
Figure 1 shows example 3D sagittal images obtained by summing the 2H MEGE data for a single subject over TE and TR values. The resulting images, which predominantly show T2*contrast, clearly depict the brain anatomy and have a similar appearance to T2*-weighted, 1H images. The CSF in the ventricles appears hyperintense, while the white matter in the corpus callosum appears hypointense.Figure 2 shows images of one slice acquired at the individual TE and TR values for one subject. The persistence of CSF signal at longer TEs and the reduction of contrast at short TE and TR is evident. These images also show that good quality data is obtained in individual acquisitions.
Figures 3 and 4 show sagittal and axial relaxation rate maps from two subjects, with the dominant feature in the 2H maps being the reduced R1 and R2* relaxation rates in the ventricles. The elevated R2* seen in deep grey matter structures in the 1H maps is not evident in the 2H maps. Table 1 reports the average and standard deviation of the T1 and T2* values measured in GM, WM and CSF in the four subjects by applying the binarized segmentation masks to the relaxation maps.
Discussion
Images with good signal-to-noise-ratio could be obtained in times of around eight minutes at 7T with 6x6x10 mm3 resolution in subjects loading with D2O to ~1.5% concentration (~100 times natural abundance). Relaxation time measurements were consistent across the six measurements. Measured T1 values for deuterium in HDO were significantly shorter than corresponding values for 1H in H2O,6 as expected, due to the quadrupolar 2H relaxation. 2H T1 and T2* values were significantly higher in CSF than in GM/WM. 2H and 1H, T2* values were similar, but the quadrupolar 2H relaxation does not show strong sensitivity to iron content in deep grey matter (Fig. 3 and 4).Conclusions
2H T1 and T2* relaxation times from water in GM, WM and CSF have been measured at 7T in vivo from human subjects loading with D2O to 100 times natural abundance. These relaxation times can be applied in research protocols using the natural abundance 2H signal from water for calibration.Acknowledgements
The pilot study into immune cell responses in cancer is supported by Cancer Research UK [A29820]. The 2H imaging research is co-funded by the NIHR Nottingham BRC and CRF. DC’s Ph.D. studies are funded by the Precision Imaging Beacon at the University of Nottingham.References
- Gursan, A., et al. (2021). "Residual quadrupolar couplings observed in 7 Tesla deuterium MR spectra of skeletal muscle." Magn. Reason. Med. doi: 10.1002/mrm.29053
- Navon, G., et al. (2001). "Multiquantum filters and order in tissues." NMR in Biomedicine 14(2): 112-132.
- De Feyter, H. M., et al. (2018). "Deuterium metabolic imaging (DMI) for MRI-based 3D mapping of metabolism in vivo." Science advances 4(8): 7314.
- De Feyter, H. M. and R. A. de Graaf (2021). "Deuterium metabolic imaging – Back to the future." Journal of Magnetic Resonance 326: 106932.
- Miller, B. F., et al. (2020). "CORP: The use of deuterated water for the measurement of protein synthesis." Journal of Applied Physiology 128(5): 1163-1176.
-
Wright, P. J., et al.
(2008). "Water proton T1 measurements in brain tissue at 7, 3, and 1.5 T
using IR-EPI, IR-TSE, and MPRAGE: results and optimization." Magma
21(1-2): 121-130.
Figures
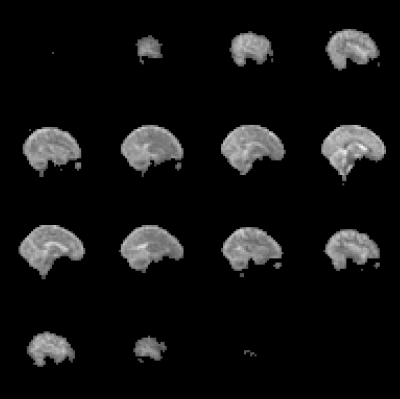
Figure 1. Example 3D MEGE 2H image data summed over 6 TEs and 5 TR values. Acquired with 6x6x10 mm3 voxels and a flip angle of 60o over a FOV of 288x288x240 mm3 from Subject C. The total acquisition time for the five images with different TRs was around 45 mins.
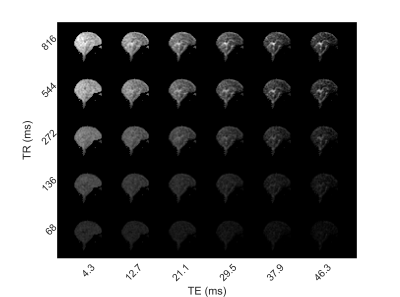
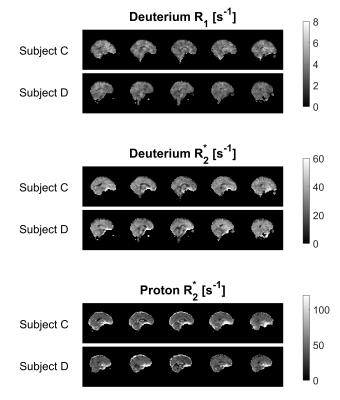
Figure 3. 2H sagittal R1 and R2*maps, along with 1H R2* maps, showing 5 slices obtained from Subjects C and D. Relaxation maps were calculated from MEGE data equivalent to that displayed in Figures 1 and 2.
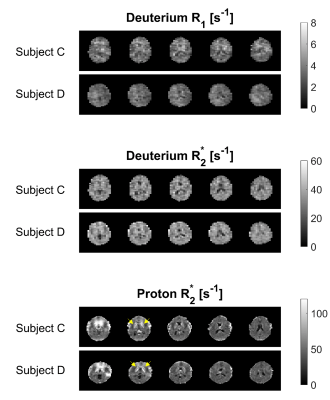
Figure 4. 2H axial R1 and R2*maps along with 1H R2* maps showing 5 slices obtained from Subjects C and D. Relaxation maps were calculated from MEGE data equivalent to that displayed in Figures 1 and 2. The elevated R2* in iron-rich deep grey matter structures is evident in the lower slices of the 1H maps (arrows), but is not seen in the 2H maps, since the 2H relaxation is due to quadrupolar rather than dipolar interactions.
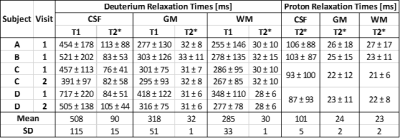
Table 1. Average and standard deviation of 2H and 1H relaxation times (T1 and T2*) from each subject and each visit obtained from averaging over segmented relaxation time maps, similar to those shown in Figures 3 and 4. Average relaxation times across subjects are also shown.