1352
Deuterium Metabolic Imaging for 3D Mapping of Human Brain Metabolism at 3T1Department of Electrical Engineering, Stanford University, Palo Alto, CA, United States, 2Department of Radiology, Stanford University, Palo Alto, CA, United States, 3Department of Neurology, Stanford University, Palo Alto, CA, United States
Synopsis
Deuterium metabolic imaging (DMI) is an emerging modality for investigating glucose metabolism with particular application for assessing the Warburg effect in tumors. Although high field systems, e.g., 7T, provide maximal signal-to-noise ratio (SNR), implementation on widely available 3T scanners could have immediate clinical impact. Using a birdcage 2H RF coil, modified gradient filter, and spherical k-space sampling, we demonstrate high-quality 3T whole-brain DMI of healthy adults following the oral ingestion of deuterated glucose. Results from these experiments provide critical data needed to explore DMI SNR, spatial resolution, and imaging time tradeoffs.
Introduction
Metabolic reprogramming, also known as the Warburg Effect in which lactate production via anerobic glycolysis (GLY) is favored over oxidative phosphorylation (OXPHOS), is a hallmark of cancer1. This effect is particularly pronounced in glioma and other brain tumors and is the target of multiple oncologic therapies2. However, limitations on measuring this abnormal tumor metabolism remains a crucial obstacle to clinical translation.The recent introduction of deuterium metabolic imaging (DMI) offers a promising approach for in vivo imaging of the Warburg effect1. Work by de Feyter et al. showed DMI can map the balance of glycolysis and mitochondrial metabolism in patiets with glioma at 4T 60-75 min following oral consumption of deuterated glucose ([6,6’-2H2]Glc)3. Analogous to the 13C Lac/Bic ratio, the ratio of 2H-Lac/Glx (glutamate+glutamine) provides a direct measure of the Warburg effect. In a pre-clinical animal model study, Kreis, et. al. further showed that dynamic DMI acquisitions could also be used to acquire quantitative and spatially resolved measurements of glycolytic flux in tumors, which can be used to assess treatment response4. Although much slower than HP13C (~2 vs 40 min acquisition), DMI requires no FDA Investigational New Drug approval, no intravenous injection, no spin polarizer (a ~$2 million instrument with an associated yearly service contract) and uses less expensive materials (~$600/study for human [6,6’-2H2]Glc vs ~$3k/injection for HP13C). In this project, we sought to implement the needed hardware for DMI on a clinical 3T PET/MR scanner (GE Healthcare, Waukesha, WI) and demonstrate high quality metabolic maps of HDO and 2H-Glx in adult brains.
Methods
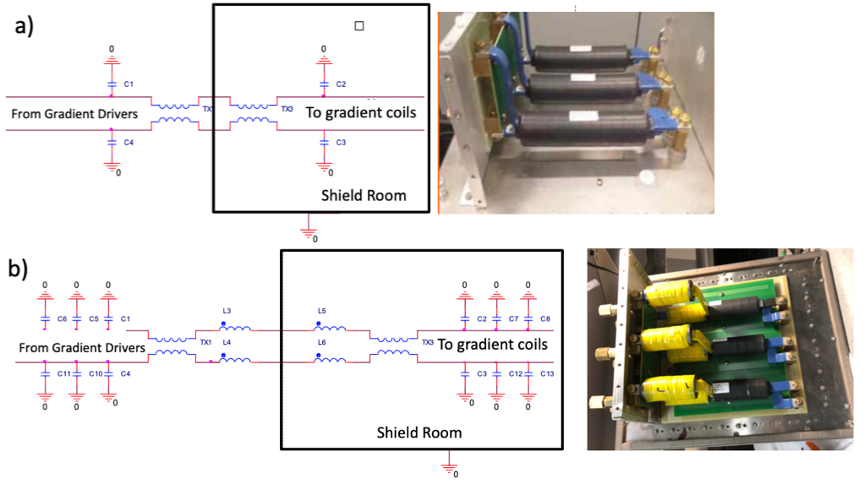
We first constructed a 3T 2H birdcage coil. The coil used a lowpass quadrature T/R birdcage head coil design built from high conductivity .25” copper tubing and was tuned to 19.6 MHz and fed with quarter wave feed lines. This yielded an unloaded Q of greater than 300. We then used a commercial deuterium coil interface by Clinical MR Solutions for 13C that was re-tuned from 32.12 MHz down to 19.6 MHz. The interface also contained a narrow band TR switch, low noise preamp, and a quadrature splitter combiner.On our 3T PET MRI GE scanner, the gradient drivers conduct harmonics into the 19-20 MHz band that are not adequately filtered using the standard gradient filters (consisting of common mode ferrite cores and capacitors to ground) mounted on the penetration panel. To remedy this problem, the filter was modified so that half of the cores were differential and the capacitors were increased 8-fold (Figure 1).
Using the modified gradient filter and 2H volume RF coil, we conducted initial investigations of in vivo whole-brain DMI in healthy adult volunteers following the oral ingestion of 60g/kg of deuterated glucose ([6,6’-2H2]Glc). DMI data was acquired with both conventional and spherical k-space encoded chemical shift imaging (CSI) and a 90° non-selective RF excitation pulse. A 10x10x10 cm spatial array with 2.4 cm isotropic resolution was acquired with a repetition time (TR) of 350 ms, yielding a 5.8 min. and 2.9 min. minimum scan time for cubic and spherically encoded 3D CSI respectively. The high-quality spectra demonstrated in the next section used 8 averages for a total acquisition time of ~23 minutes. An additional T1-weighted 1H image was acquired for anatomical comparison and co-registration.
Results & Discussion
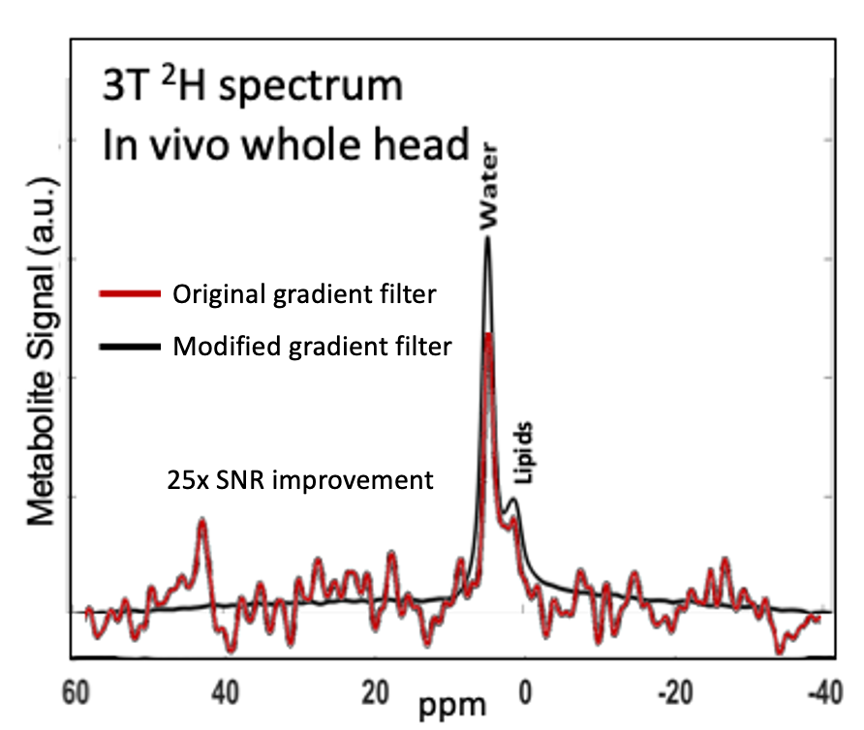
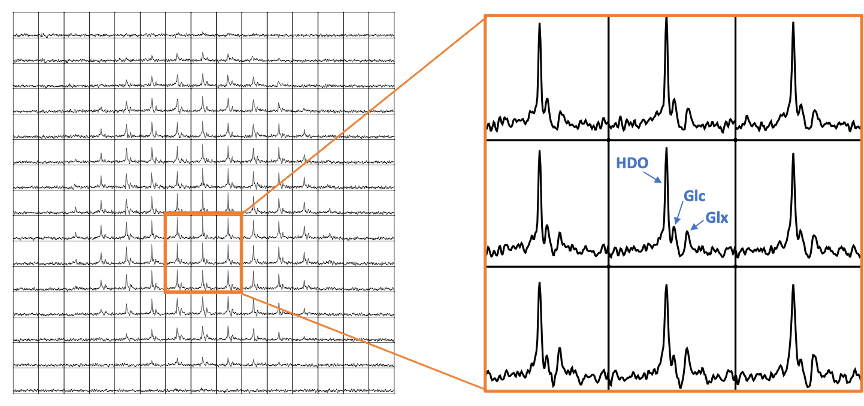
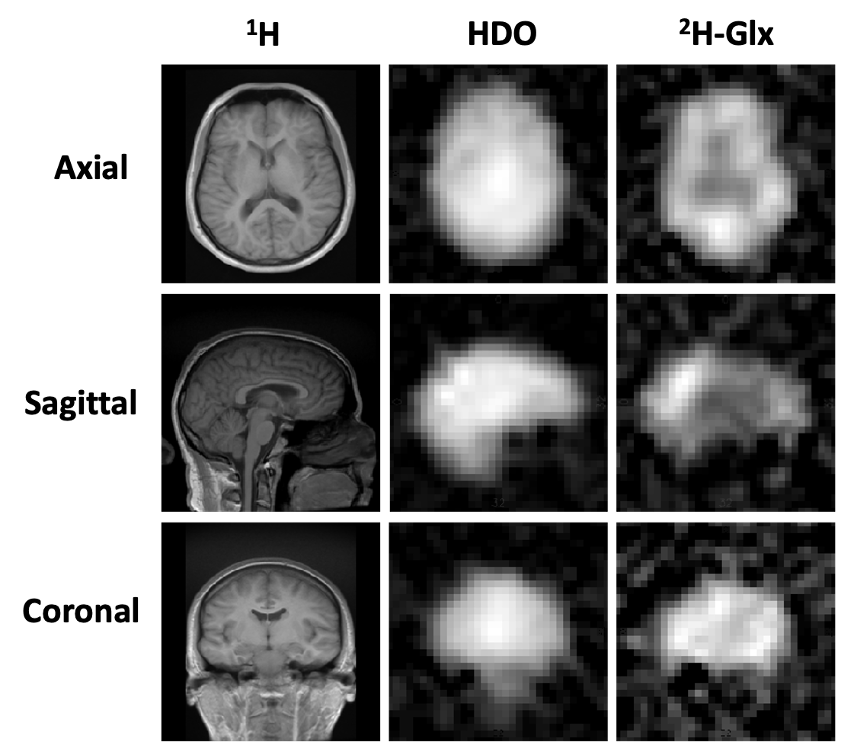
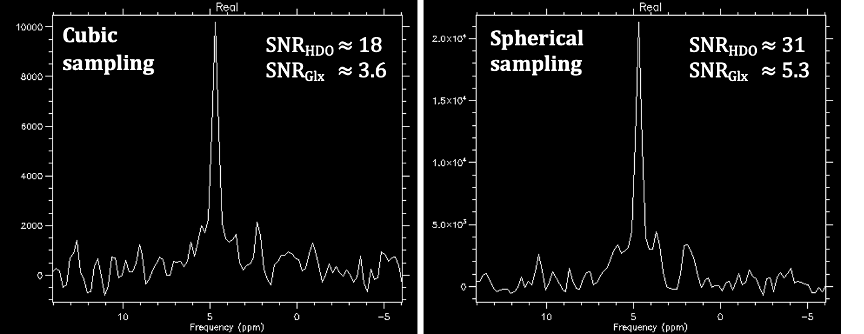
As shown in Figure 2, the modified gradient filter successfully removed the excess noise on our scanner seen in the 19-20 MHz RF frequency band. This led to good spectral quality across the brain volume, achieving a signal-to-noise ratio (SNR) of ~33 for HDO and ~5 for 2H-Glx at a representative center voxel spectrum (Figure 3). Note that the SNR for the 2H-Lac peak was too low in normal healthy volunteers to quantify reliably. Metabolic maps (computed via simple peak integration) of HDO and 2H-Glx demonstrate good anatomical correspondence with the T1-weighted 1H scans (Figure 4). In particular, the elevated HDO and reduced 2H-Glx signal in the center of the brain volume correspond well with the cerebrospinal fluid (CSF) in the proton scan. We additionally demonstrate that spherical k-space sampling yields an SNR gain of approximately √2 over cubic k-space sampling due to the twice the number of acquisition averages (Figure 5).Conclusion
Following the oral ingestion of deuterated glucose, we used a modified gradient filter, home-built 2H volume RF coil, and spherical k-space sampling in a 3D CSI acquisition to obtain high quality adult brain metabolic maps of 2H-labeled water and 2H-Glx products of glucose metabolism. Future work will include the construction of an improved 2H head coil and an assessment of image quality improvements achievable by exploiting the mutual information content among DMI, MRI, and FDG-PET acquisitions. It is also important to note that not all clinical 3T MRI scanners suffer from the same gradient noise problem seen on our GE 3T PET/MR system. For these scanners, no gradient filter modifications would be required.Acknowledgements
NIH R01 CA245097
Berg LLC
References
1. Corbin, Z., Spielman, D. & Recht, L. A Metabolic Therapy for Malignant Glioma Requires a Clinical Measure. Curr Oncol Rep 19, 84, doi:10.1007/s11912-017-0637-y (2017).
2. Phan, Liem Minh, Sai-Ching Jim Yeung, and Mong-Hong Lee. "Cancer metabolic reprogramming: importance, main features, and potentials for precise targeted anti-cancer therapies." Cancer biology & medicine 11.1 (2014).
3. De Feyter, H. M. et al. Deuterium metabolic imaging (DMI) for MRI-based 3D mapping of metabolism in vivo. Sci Adv 4, eaat7314, doi:10.1126/sciadv.aat7314 (2018).
4. Kreis, F. et al. Measuring Tumor Glycolytic Flux in Vivo by Using Fast Deuterium MRI. Radiology 294, 289-296, doi:10.1148/radiol.2019191242 (2020).
Figures